Precision displacement interferometry with stabilization of wavelength on
air
J. Lazar, M. Holá, J. Hrabina, Z. Buchta, and O. Číp
Institute of Scientific Instruments, Academy of Sciences of the Czech Republic, v.v.i., Královopolská 147, Brno, 612 64 Brno, Czech Republic
Abstract.We present an interferometric technique based on differential interferometry setup for measurement in the subnanometer scale in atmospheric conditions. The motivation for development of this ultraprecise technique is coming from the field of nanometrology. The key limiting factor in any optical measurement are fluctuations of the refractive index of air representing a source of uncertainty on the 10-6 level when evaluated
indirectly from the physical parameters of the atmosphere. Our proposal is based on the concept of overdetermined interferometric setup where a reference length is derived from a mechanical frame made from a material with very low thermal coefficient on the 10-8 level. The technique allows to track the variations of
the refractive index of air on-line directly in the line of the measuring beam and to compensate for the fluctuations. The optical setup consists of three interferometers sharing the same beam path where two measure differentially the displacement while the third represents a reference for stabilization of the wavelength of the laser source. The principle is demonstrated on an experimental setup and a set of measurements describing the performance is presented.
1 Introduction
Metrology of length and other geometrical quantities is a domain of various interferometric techniques where the fundamental etalon is represented by a highly-stabile laser. The stability is viewed in frequency domain. The references used for the laser control are mostly atomic transitions with precisely known frequency. Traditional concept of interferometric measurement is based on such a highly stable laser source with stabilized optical frequency representing a standard of wavelength which is consequently seen as an elementary length counted by an interferometer. Further improvement of resolution of an interferometer below this length element has been achieved by a combination of optical techniques and advanced electronic digital signal processing of the interference signal.
Stability of the optical frequency of laser sources which has been achieved recently is very precise. Traditional He-Ne lasers stabilized to the active Doppler-broadened line in Ne can operate with relative frequency stability on the level 10-8 – 10-9, He-Ne laser stabilized
through subdoppler spectroscopy in iodine on the 10-11 –
10-12 level and the potential of iodine stabilized lasers
based on frequency doubled Nd:YAG is very close to the 10-14 level [1]. The reproducibility of their absolute
frequencies is another goal in metrology and is limited to 2.1 x 10⁻¹¹, resp. 9 x 10-12 [2] and the absolute frequency
value is limited primarily by the absorbing medium [3]. The conversion of a stable frequency into a precise wavelength relies on the value of speed of light which is under vacuum conditions defined physical constant. In the laboratory environment the value of the refractive index of air has to be considered. The search and effort for a more precise interferometric measuring tool includes highly stable laser sources, reduction of noise, better optics, higher resolution through optical and electronic techniques, linearization, etc. [4, 5, 6].
In case of all commercial interferometric systems the compensation of index of refraction of air is done by measuring of the fundamental atmospheric parameters – temperature, pressure and humidity of air, accompanied in some cases by the measurements of concentration of carbon dioxide. The value of refractive index is extracted by evaluation of the empirical Edlen formula [7]. This fundamental formula was further tested and a set of improvements followed [8, 9, 10, 11]. All measurements of the refractive index of air performed by refractometers or by evaluation of the Edlen formula suffer from one principal limitation namely the fluctuations of air along and around the laser beam axis.
only close to the measuring path. While the evaluation of the refractive index of air through direct refractometery under laboratory conditions can be done with an uncertainty close to the 10-9 [12, 13]. The most precise
laboratory techniques seem to be those exploiting optical frequency comb synthesis [14, 15, 16, 17, 18]. The limiting factor seems to be the stability of the atmosphere around the beam path. The practical limit in evaluation of the refractive index of air is determined by effects such as thermal gradients and air fluctuations. They cannot be completely avoided; they depend on particular application and measurement configuration.
There has been an effort to combine the distance measuring interferometer and the refractometer into one instrument which could evaluate the influence of the refractive index of air during the measurement or directly compensate for it. A method linking the wavelength of the laser source to the mechanical length of some frame or board was proposed by [19]. In this case the concept relies on coherent and broadly tunable laser sources [20, 21]. Authors suggest using a set of two identical interferometers where one is fixed in the length and serves as a reference for the laser wavelength.
2 Stabilization of wavelength
An interferometric system referenced to the stabilized laser needs a conversion to stable wavelength through the speed of light which includes a refractive index of the environment. We propose an interferometric arrangement where the referencing could be derived not from an optical frequency with a transfer to wavelength via independently evaluated or measured refractive index of air but from directly referencing the wavelength of the laser source. Fixing the laser wavelength over the measurement axis to a mechanical reference can replace a stabilization of the laser frequency. A He-Ne laser for interferometry locked to the active line in Ne can offer a relative stability of the optical frequency in the order of 10-8. This is on the same level as the coefficient of thermal expansion of highly stable materials such as Zerodur from Schott or ULE from Corning. It seems to be feasible to use mechanical standards made from these materials as a reference for stabilization of the wavelength under conditions of varying refractive index.
If displacement is measured, it must always be stated what is measured against what. All the traditional sources of error (refractive index, vibrations, laser noise, linearity, misalignment, etc.) can be marginal when there is a mechanical instability of the reference point. The approach we present here combines the mechanical referencing of the interferometer itself with referencing of the laser wavelength. The mechanical referencing simply cannot be avoided so we at least link one source of variations and uncertainty (refractive index) to another (mechanical). We proposed a concept with an
over-determined counter-measuring interferometric
displacement measuring setup [22-24] where the length in one axis was measured by two interferometers with their position fixed to a highly stable mechanical reference. In this case the reference relied on a material
with thermal stability low enough to overcome the uncertainty caused by fluctuations of the refractive index of air. We used “0”–grade Zerodur ceramics from Schott, with stability at 10-8/K level for a wide range of
temperatures from 0°C to 50°C. In a smaller range the coefficient of thermal expansion should have a plateau with even smaller thermal expansion.
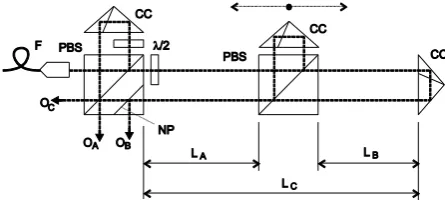
In our concept the wavelength of the laser source was fixed by a control loop to a sum value of the two interferometers representing a principle of stabilization of wavelength. In this contribution we present a new version of this concept with three interferometers with corner-cube reflectors where the overall length is not a sum value of two but an independently measured value (figure 1).
Fig. 1. Configuration with corner-cube reflectors measuring directly the overall length and two particluar displacements. CC: corner-cube reflector, PBS: polarizing beamsplitter, NP: non-polarizing plane, /2: half-wave plate, F: fiber-optic light
delivery, OA, OB, OC outputs, Lc. La, Lb: particular lengths
determining the position of the moving carriage.
The system consists of three independent interferometers where each measures the specified part of the overall length (A, B, C, see figure 1). The left polarizing beamsplitter with a corner-cube reflector serves as a reference arm for the interferometer measuring the distance between the left reference point and the moving carriage (A) as well as for the interferometer measuring the overall length (C). The moving carriage holds another beamsplitter with corner-cube reflector generating a reference arm for the interferometer measuring the distance between the moving carriage (B) and the right reference point. The beam of the interferometer C only passes through the beamsplitter on the moving carriage. Beam paths on air of the interferometers A and B are identical with proportional parts of the beam path of the interferometer C.
wavelength in the range given by interferometer C is kept constant and the carriage moves within.
The carriage position can be seen in our arrangement as overdetermined, it is measured from both sides, referred here as A and B. The carriage displacement may be referenced either to the left or right end of the measuring range. Still the identity of the displacement measuring beam path (on air) and the beam path of the tracking refractometer is limited by the ratio given by the carriage position. The value of the refractive index may differ in the left and right part (A, resp. B) of the setup. The best approximation of the resulting carriage position should be thus a value calculated from both A and B positions.
3
Tracking the refractive index drift
The interferometric system was placed into a double-wall glass box with the walls filled with water. Circulation of the water with a pump ensured an even distribution of temperature on the walls and reduction of thermal gradients in air inside. The circulating water went through a power Peltier heater/cooler. This allows us to control the temperature inside and let the air be heated or cooled gradually so the refractive index of air would vary within some range. To monitor the atmosphere inside, we added temperature, pressure, humidity sensors together with a sensor monitoring the content of CO2. Refractive
index of air was instantly calculated and recorded from these measurements to be compared with the interferometer values. Photo of the experimental arrangement is in figure 2. The interferometers are surrounded by sensors measuring the parameters of atmosphere. Glass walls of the water filled thermal box are visible around.
Fig. 2. Photo of the experimental setup on a Zerodur plate in a thermal control box together with the moving carriage in the
back and weather sensors in front.
To investigate the level of relevance of this concept we recorded the variations of refractive index monitored by the interferometer outputs in a steady-state regime with the carriage in approx. central position within the measuring range. The recording in figure 3 shows outputs from the three interferometers (A, B, and C) with the
temperature control box closed. A sum value of interferometers A and B is added. In both cases there is a small mechanical drift of the carriage but the recordings show well the level, frequency and overall nature of these fluctuations. The comparison between the sum of A and B and the interferometer C output shows how successful the stabilization of wavelength may be when used for compensation of the refractive index variations in the measuring axis. The differences between A+B and C should be interpreted in comparison with the sole variations of A, resp. B. The air path of the whole measuring range (monitored by the interferometer C) was 195 mm. The mean value of these differences is in closed box 5 nm which means relative uncertainty 2.5 x 10⁻⁸.
Fig. 3. Recording of the variations of the interferometers A (bottom line), B (top line), and overall length measuring C together with the sum of A and B (two middle lines) over time
in a closed thermal box.
Experimental verification of the system
performance. The interferometric setup was subject to a slow drift of the refractive index of air induced through heating of the air within the thermal control box. The aim was to compare the recording of the varying refractive index evaluated through Edlen formula with tracking of these variations through the laser optical frequency in the regime of stabilization of wavelength. The laser was locked through a servo control loop to the output of the interferometer C, at the beginning of the experiment reset to zero value. In figures 4 and 5 we show the refractive index drift and the corresponding drift of the laser optical frequency derived from a control voltage tuning the laser via PZT. The proof of the concept was based on comparison of these two values.
Fig. 4. Recording of a slow refractive index drift evaluated from measurement of air temperature, pressure, humidity and CO2
Fig. 5. Recording of the optical frequency tuning of the laser following stabilized wavelength over the measuring range.
The gradual drop of the refractive index recorded over approx. 10 min recorded in figure 4 performs steps due to poor resolution of the sensor for CO2 content. Not
considering these discontinuities the recording performs slowly varying smooth curve so we introduced a polynomial fit to represent the most likely course of the refractive index. The recording of the optical frequency shows the sensitivity of the system to follow the small-scale variations similar in nature and small-scale to those in figure 2 and thus the ability of this system to compensate for them. Recording of the refractive index in figure 3 shows how slow is the response of the sensors and how insensitive this indirect method is.
The recordings in figures 4 and 5 were recorded during heating show a “phase shift” caused by a slow response of the sensors for measuring of the parameters of the atmosphere. Then there is a gradual change of the course of the optical frequency drift while the refractive index still rises. To follow the principle of referencing to high-stability mechanical frame, it should include the central beamsplitter on the moving carriage to be made out such material as well, at least quartz glass. In our case we used SF-14 glass for technology reasons and its slow gradual heating together with high thermal expansion coefficient and high refractive index consequently acted against the course of the drift. To evaluate the agreement between these two recordings we considered only the first part of the slope before the expansion of the glass showed up. The agreement can be expressed as on the level 2 x 10⁻⁸.
3
Conclusions
Performance of this system can be judged on the basis how the laser locked to the constant wavelength is able to follow the fluctuations of the refractive index of air and how relevant the displacements measured by the interferometers A and B are within the measuring range set by the interferometer C with the stable wavelength. Agreement between the values measured by all three interferometers can be assumed from the figure 2. Agreement between the A and B value together with their sum compared with C shows good coincidence more than an order of magnitude smaller compared to the amplitude of fluctuations. Understandable disagreement between A and B (their beam paths are not identical) results in a suggestion to evaluate the measured displacement of the
carriage as an average from A and B of the overdetermined system. This would refer to the constant value of wavelength kept within the whole distance of C (see good agreement A+B vs. C). Thanks to constant
wavelength within the measuring range, the
interferometers can operate in their incremental regime without the need to know absolute (air) lengths of A, B or C.
The recordings in figure 2 as well as 4 show the nature of the refractive index variations. In case of interferometer C in figure 2 5 nm corresponds to 2.5 x10⁻⁸
of the refractive index change. In our experiment both the interferometer detection chain as well as the frequency response of the optical frequency servo loop were well over the bandwidth of this process. this may be seen in a sharp contrast with the slow response of the indirect evaluation of the refractive index through Edlen formula (figure 3).
The concept presented here is well able to follow the fluctuations of the refractive index of air and effectively compensate for them. Recording of the laser optical frequency in the locked regime shows very similar nature to the fluctuations of the refractive index. It is not able to measure the value of the refractive index absolutely. The initial value has to be measured a traditional way of with a help of a refractometer.
Acknowledgement
The authors wish to express thanks for support to the grant projects from Grant Agency of the Czech Republic, projects: GA102/09/1276, GAP102/11/P820, Technology Agency of the Czech Republic, projects: TA02010711, TE01020233, European Commission and Ministry of Education, Youth, and Sports of the Czech Republic, project: CZ.1.05/2.1.00/01.0017, and institutional support RVO: 68081731.
References
1. Rovera, G. D., Ducos, F., Zondy, J. J., Ace,f O., Wallerand, J. P., Knight, J. C., Russell, P. S., Meas. Sci. Technol., 13, 918-922 (2002).
2. Quinn, T. J., Metrologia, 40, 103-133 (2003). 3. Lazar, J., Hrabina, J., Jedlicka, P., et al., Metrologia,
46, 450-456 (2009).
4. Ottonelli, S., Dabbicco, M., De Lucia, F., di Vietro, M., Scamarcio, G., Sensors, 9, 3527-3548 (2009). 5. Ruiz, A. R. J., Rosas, J. G., Granja, F. S., Honorato,
J. C. P., Taboada, J. J. E., Serrano, V. M., Jimenez, T. M. A, Sensors, 9, 7622-7647 (2009).
6. Olyaee, S., Yoon, T. H., Hamedi, S., IET Optoelectron., 3, 215-224 (2009).
7. Edlén, B.“The refractive index of air,“ Metrologia, 2, 71-80 (1966).
8. Bönsch, B., Potulski, E., Metrologia, 35, 133-139 (1998).
9. Birch, K. P. and Downs, M. J., Metrologia, 30, 155-162 (1993).
11. Birch, K. P., Downs, M. J., Metrologia, 31, 315-316 (1994).
12. Quoc, T. B., Ishige, M., Ohkubo, Y., et al., Meas. Sci. Technol., 20, 125302 (2009).
13. Topcu, S., Alayli, Y., Wallerand, J. P., et al., European Physical Journal – Applied Physics, 24, 85-90 (2003).
14. Zhang, J., Lu, Z. H., Menegozzi, B., and Wang, L. J., Rev. Sci. Instr., 77, 083104 (2006).
15. Zhang, J., Lu, Z. H., Wang, L. J., Opt. Lett., 30, 3314-3316 (2005).
16. Šmíd, R., Číp, O., Lazar, J., Meas. Sci. Technol., 8, 114-117 (2008).
17. Šmíd, R., Číp, O., Čížek, M., et al., IEEE Transactions on Ultrasonics Ferroelectrics and Frequency Control, 57, 636-640 (2010).
18. Šmíd, R., Číp, O., Lazar, J., Proceedings of SPIE, 6995, M9950-M9950 (2008).
19. Höfler, H., Molnar, J., Schröder, C., Kulmus, K., Technisches Messen, tm 57, 346-350 (1990). 20. Lazar, J., Číp, O., Růžička, B., Meas. Sci. Technol.,
15, N6-N9 (2004).
21. Mikel, B., Růžička, B., Číp, O., et al., Proceedings of SPIE, 5036, 8-13 (2002).
22. Lazar, J., Číp, O., Čížek, M., et al., Sensors, 11, 7644-7655 (2011).
23. Lazar, J., Číp, O., Čížek, M., et al., TM-Tech. Messen, 78, 484-488 (2011).