www.nonlin-processes-geophys.net/16/211/2009/ © Author(s) 2009. This work is distributed under the Creative Commons Attribution 3.0 License.
Nonlinear Processes
in Geophysics
Seismic entangled patterns analyzed via multiresolution
decomposition
F. E. A. Leite1, R. Montagne2, G. Corso3, and L. S. Lucena4
1Departamento de Ciˆencias Ambientais, Universidade Federal Rural do Semi- ´Arido, 59625-900, Mossor´o, RN, Brazil 2Departamento de F´ısica, Universidade Federal Rural de Pernambuco, Rua Dom Manoel de Medeiros, s/n, 52171-900, Recife, PE, Brazil
3Departamento de Biof´ısica e Farmacologia, Centro de Biociˆencias, Universidade Federal do Rio Grande do Norte, Campus Universit´ario, 59078-972, Natal, RN, Brazil
4Departamento de F´ısica Te´orica e Experimental, International Center for Complex Systems, Universidade Federal do Rio Grande do Norte, Campus Universit´ario, 59078-970, Natal, RN, Brazil
Received: 19 September 2008 – Revised: 30 January 2009 – Accepted: 22 February 2009 – Published: 26 March 2009
Abstract. This article explores a method for distinguishing entangled coherent structures embedded in geophysical im-ages. The original image is decomposed in a series of j-scale-images using multiresolution decomposition. To improve the image processing analysis each j-image is divided in l-spacial regions generating set of (j, l)-regions. At each (j, l)-region we apply a continuous wavelet transform to evaluateEν, the spectrum of energy.Eνhas two maxima in the original data. Otherwise, at each scaleEνhast typically one peak. The lo-calization of the peaks changes according to the (j, l)-region. The intensity of the peaks is linked with the presence of co-herent structures, or patterns, at the respective (j, l)-region. The method is successfully applied to distinguish, in scale and region, the ground roll noise from the relevant geologic information in the signal.
1 Introduction
Seismic image filtering and processing is a very prolific area in geophysics (Yilmaz, 2003). Every year, new methods and new approaches in old techniques come into play (Drouji-nine, 2006; Leite et al., 2008; Liu, 1999). Wavelet analysis (Welford and Zhang, 2004; Corso et al., 2003; Chakraborty and Okaya, 1995), Karhunen-Lo`eve transform (Montagne and Vasconcelos, 2006a,b; Lu, 2002), Empirical Mode De-composition (Huang et al., 1999), Neural Networks (Tselen-tis et al., 2007) are just a few techniques used to clean and improve visualization of seismic data. In this paper we
fo-Correspondence to: R. Montagne
cus on one of this major image processing methodology: the wavelet analysis (Kumar and Foufoula-Georgiou, 1997; Tor-rence and Compo, 1998).
We use wavelet analysis for exploring seismic images composed by two entangled patterns: the ground roll and the actual geologic information. In land based seismic data the ground roll shows a peculiar characteristic: it is the main source of noise that contaminates the actual geologic infor-mation, but it is at the same time a coherent structure. The ground roll is a surface wave (Rayleigh dispersive wave) with low frequency and low phase and group velocities. In geo-physical image-processing, the ground roll is an undesirable information that need to be cleaned (Yilmaz, 2003). Our method allows a good visualization (in scale) of the two pat-terns immersed in the image. In this way, the method is use-ful to separate information from these two patterns (or co-herent structures) despite the fact that the patterns have not a clear contour and they are spread all over the image.
problems where one seeks to detect (and eventually remove) mixed coherent structures embedded in a complex pattern (Bernacchia and Naveau, 2008; Pi˜nuela et al., 2007).
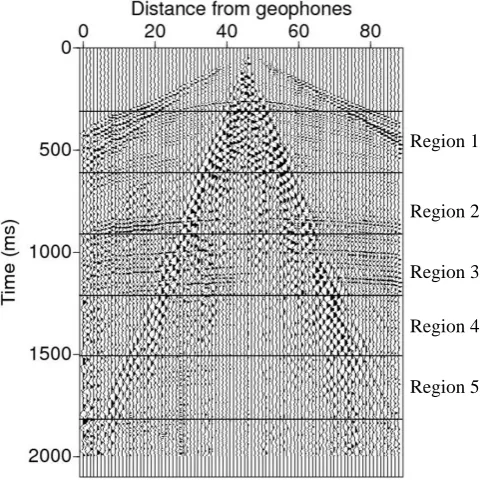
We work out our method on the seismic image shown in Fig. 1. This seismic section corresponds to record 25 of Yil-maz’s book (Yilmaz, 2003), available at Center for Wave Phenomena and Colorado School of Mines (2007)1. The ground roll appears in this seismic image as a fan–like struc-ture with downward oblique straight lines. On the other hand, the geologic information is mainly carried in the almost hor-izontal lines (actually flat hyperbolas) of the image. The pa-per is organized as follows. In the next section we present in some detail the wavelet background of the article, fix the mathematical notation and expose the methodology in detail. Then, we apply our method to a specific situation: seismic data contaminated with ground roll noise. Finally, we present our main conclusions and point future research work.
2 Mathematical background and methodology
2.1 Wavelet analysis and multiresolution
Much of what has been published on wavelets is of great mathematical complexity (Daubechies, 1992; Mallat, 1998) and thus it can not be easily applied by geophysicists. Here, we present, in a simple form, the minimal required mathe-matical concepts in order to understand the main ideas. A wavelet is defined as a functionψ (t )∈L2(R)(square
inte-grable functions) with a zero mean, localized in both time and frequency. By dilating and translating this waveletψ (t ), we produce a family of wavelets:
ψu, s(t )= 1
√
sψ t−u
s
, (1)
whereu, s∈R. Hereuis a location parameter ands is the dilation parameter or scale. The Continuous Wavelet Trans-form of a functionf (t ),CW Tf(u, s), is defined as the inner product of the family of waveletsψu, s(t )withf (t ). This is given by
CWTf(u, s)= hf, ψu, si = Z +∞
−∞
f (t )ψu, s∗ dt. (2) whereψ∗denotes the conjugate ofψu, s. In order to imple-ment the wavelet transform on sampled signals we need to discretize the parametersuands. The most common choice iss=2j andu=n2j with j-, n-integers. For a discrete data array,f[t], the Discrete Wavelet Transform DWTf(j, n)is done by:
DWTf(j, n)= Z +∞
−∞
f[t]√1
2jψ
t−n2j 2j
dt, (3)
1availale at: http://www.cwp.mines.edu/software.html
wheren=1,2, . . .is the index of data array. So, the function f (t )can be approximated by
f (t )=X
j X
n
DWTf(j, n)ψj, n(t ). (4)
The discrete wavelet transform measures the contribution to f[t]of scale 2j at locationn2j. These conditions are fairly broad and cover a wide range of situations. This features allows the study of a given signal at different scales. Ac-tually, this kind of analysis, known as MULTIRESOLUTION ANALYSIS(or Multiscale Analysis), study and represents at different resolutions (or scales) the signal being analized. In fact, the multiresolution analysis gives in an efficient way an algorithm for going from one scale to another. In order to add more resolution Grossmann et al. (1989) suggested decom-pose the signal choosing the parameterss=aj, witha=21/ν, whereν indicates the number of voices (ν voices by scale) per octave (interval[2j,2j+1]) andu=nu02j/ν withu0=1 andninteger. Using this decomposition we getψ
ψj, nν (t )=2−j/2νψ (2−j/νt−n) (5) where j and n are integer. Such decomposition us-ing a multivoice frame enables us to cover the range of scales in smaller steps, giving a more continuous pic-ture. For example, with ν=4 we obtain discrete scales at (s=1,21/4,21/2,23/4,2,25/4,23/2,27/4,4, . . .). In agree-ment with the notation above, the coefficients DWTf(j, n) have dimension m×n, where n is dimension of f and m=j∗ν. We define the wavelet energy spectrum off as Eν =
X
n
DWTf(ν, n) 2
. (6)
This idea is developed to characterize properties of seismic data.
2.2 Methodology
The seismic image is formed by an array of(Nx, Ny), where Nx is the number of elements in the horizontal (the number of traces in geophysics) andNythe elements in vertical (the number of samples per trace); usuallyNyNx. We sum-marize our image processing methodology in three parts: (i) Multiresolution decomposition of the original image in a set of j-images, (ii) Slicing of each j-images in a set of l-regions (or slices), (iii) continuous wavelet analysis at each slice to generate the energy spectrum at the (j, l)-slice. Next we detail the methodology:
Region 3 Region 4
Region 5 Region 2 Region 1
Fig. 1. Original data displaying the ground roll noise as the fan-like structure at the center of the figure. This seismic image corresponds to record 25 in Yilmaz’s book. The lines shown on the picture de-limit the regions used in the method described in the text.
2. Slicing of the image. Each j-image is sliced in l-sections for increasing the power of the method, before con-structing the energy spectrum. In fact, the analyzed co-herent structures are not equally distributed over the full image. As the j-image is sliced the energy spectrum cor-responding to the underlying coherent structures at each specific region is emphasized. The numberlof slices is empirically determined according toNyand the nature of the data.
3. Energy spectrum. For each (j, l)-region the signal is de-composed using a continuous wavelet transformation. The energy spectrum is the normalized square of the components of the wavelet transformation. The coher-ent structures underlying the image are visualized at this step of the method. Typically a coherent structure shows a bump-like signature in the energy spectrum, that means, at each scale the information of the structure is concentrated in a defined set of voices. To summa-rize, the energy spectrum splits the coherent structures into scales and voices.
3 Results and discussion
We apply our methodology for the seismic section shown in Fig. 1. The seismic data has naturally two entangled
coher-ent structures: the ground roll and the hyperbolic-like geo-logic layers. Following the enumerated steps of the previous section, we detail the technical information concerning the application of the method:
1. Multiresolution analysis. We use Daubechies discrete transformation in order to obtain the image at each scale. The size of the data isNy=2100,Nx=89 which generatej=11 scales in the vertical axis.
2. Slicing of the image. We choose to slice Fig. 1, after several tests, inl=5 sections. Indeed, largerl does not add new information to the analysis, conversely, smaller l, is not enough to explore the localized characteristics of the coherent structures.
3. Energy spectrum. We use the Gaussian wavelet (a con-tinuous wavelet basis) to construct the energy spectrum, with 8 voices. We have also tried the Morlet basis, but the results were not satisfactory.
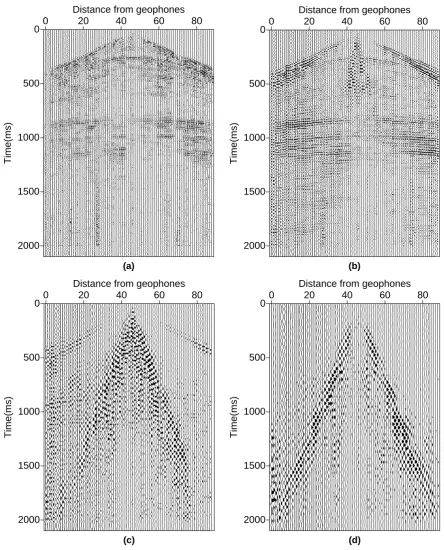
Figure 2 shows a sequence of four scale-images generated by multiresolution analysis using the discrete wavelet trans-form. Figure 2a–d correspond to scalesj=3, 4, 5, 6 respec-tively. We identify in this figure the hyperbolic lines at a and b, on the other hand, the ground roll structure is visible at d. Let us take a closer look at Fig. 2c, it consists of a mix of hyperbolic lines and ground roll patterns. We remark that the mixed image correspond to scalej=5, in the next paragraphs we return to this point.
Figure 3 shows a sequence of six energy spectra, the hor-izontal axis corresponds to the voice mand the vertical to the associated energyEν. Each plot shows five curves cor-responding to the five slices of the j-images. The slices are taken in a similar way as indicated in Fig. 1. Typically, the peaks in the energy spectrum representation correspond to the coherent patterns of the image. In Fig. 3a we show the spectra of the 5-slices of the original data. Figure 3b–f cor-respond to scalesj=3, 4, 5, 6, 7, respectively. A closer look at Fig. 3a reveals that the maxima of the curves are around voices 15–20 or 25–40 (low versus high voices) depending on the region which produces it. The two peaks shaped curves are due to the presence of an entangled arrangement of patterns: the ground roll (high voices) and the geologic layers (low voices). In fact, at Fig. 3a, regions 2 and 3, that have a well defined geological layers show the peak at low voices. Otherwise, regions 4 and 5, that have strong ground roll presence show the peak at high voices. The bimodal curves correspond to regions 2 and 3, where entangled pat-terns are visible.
To explore the contents of Fig. 3 we use the following no-tation. We denote the position of a peak at scalej aspj. We also use the indexh for peaks corresponding to the hyper-bolic lines and indexgfor ground roll peaks.
0
500
1000
1500
2000
Time(ms)
0 20 40 60 80
Distance from geophones
(a)
0
500
1000
1500
2000
Time(ms)
0 20 40 60 80
Distance from geophones
(b)
0
500
1000
1500
2000
Time(ms)
0 20 40 60 80
Distance from geophones
(c)
0
500
1000
1500
2000
Time(ms)
0 20 40 60 80
Distance from geophones
(d)
Fig. 2. Seismic images after multiresolution transformation for scales: (a)j=3, (b)j=4, (c)j=5, and (d)j=6. Image (a) and (b) show
mainly the hyperbolic lines and image (d) the ground roll. Image (c) shows an entangled arrangement of the two patterns.
peaks corresponding to hyperbolic lines are atph3=6. As can be seen in this figure, all the peaks are at the same position for the 5 regions. The hyperbolic pattern peaks are also
struc-0 20 40 60 80 100 0
0.01 0.02 0.03 0.04 0.05 0.06 0.07
Energy
voices
region 1 region 2 region 3 region 4 region 5 (a)
0 20 40 60 80 100
0 0.05 0.1 0.15 0.2 0.25 0.3 0.35
Energy
voices
region 1 region 2 region 3 region 4 region 5 (b)
0 20 40 60 80 100
0 0.04 0.08 0.12 0.16 0.2
Energy
voices
region 1 region 2 region 3 region 4 region 5 (c)
0 20 40 60 80 100
0 0.01 0.02 0.03 0.04 0.05 0.06 0.07
Energy
voices
region 1 region 2 region 3 region 4 region 5 (d)
0 20 40 60 80 100
0 0.01 0.02 0.03 0.04 0.05 0.06
Energy
voices
region 1 region 2 region 3 region 4 region 5 (e)
0 20 40 60 80 100 0
0.01 0.02 0.03 0.04
E
n
e
rg
y
voices region 1
region 2 region 3 region 4 region 5
(f)
ture is visible, but also the ground roll pattern. The ground roll structure is visualized at high scales (low frequencies). The ground roll peaks are shown in Fig.3d, e and f at posi-tionsph5=20,p6h=40 andp7h=80. The reader may well ask why the positions of the peaks due to the ground roll increase by a factor of two as the scale is increased. According to de-composition analysis, the frequency is scaled by a factor of 2, while going from scalej toj+1 that means, the position of a peak at scalej,pj, follows the equation:pj+1=2pj.
Remember that, Fig.3d corresponds to a special case, at this scale the peaks of the five regions are not all at the same position. In fact, depending on the region, the ground roll or the hyperbolic lines pattern is the dominant pattern. This fact is reflected in the position of the energy mode peaks. For region 1 the ground roll is more visible and for regions 4 and 5 the peaks are at the same position. At regions 2 and 3 the two patterns are very mixed and the peak is situated at an intermediate position between the previous ones. In the next section we summarize the information concerning this set of figures and conclude the work.
4 Final remarks
In this paper we explored the multiresolution analysis for identifying mixed coherent structures immersed in an image. We applied our methodology to seismic data and successfully splitted in voice and scale the two main coherent patterns: the ground roll and the geologic layers. Our main pourpose was to provide an effective method for separating in scales and voices mixed coherent patterns.
The multiresolution decomposition split an image into several scales, or frequency ranges. However, coherent pat-tern may be not restricted to a single scale. Specifically, in the case we studied, the ground roll pattern is present at scales j=5, 6 and 7 and the hyperbolic lines pattern at j=1, 2, 3, 4 and 5. The scalej=5 is the most stimulating case as it shares information from the two patterns. The patterns in this scale are splitted according to voices, hence, differ-ent patterns correspond to peaks cdiffer-entered at distinct voices in the energy spectrum. We clearly visualized this character-istic analyzing separately the regions of the seismic image. The regions corresponding to strong ground roll presence (slices 4 and 5) are associated with peaks at the same po-sition. In contrast, the regions corresponding to hyperbolic patterns (2 and 3, mainly 3) are related to peaks at a different position in the energy spectra. The region 3 deserves special attention, this region exhibit the most entangled mixing of the two patterns, consequently, the associated energy spec-trum shows a peak in between the two former cases.
In this manuscript we present a method for splitting seis-mic patterns using wavelet decomposition. We remark that we apply the wavelet transform over the data acquired at each geophone, that means, we transform the data of each trace, an unidimensional signal. In this way we do not capture the full
spacial information of the seismic image. Because we do not work directly on a bidimensional data we can not use more sophisticated basis like anisotropic Morlet basis or biorthog-onal basis (Neupauer and Powell, 2005; Allaei et al., 2008). The success of the splitting patterns in a one dimensional data encourage us to improve the method to perform the wavelet transform on two dimensional data. A natural basis in two di-mensional data is the anisotropic Morlet which was specially designed to deal with heterogeneous geologic images.
As a final remark we point out that our method will prove useful to design intelligent coherent pattern filtering. Let us suppose that we are interested in cleaning the ground roll and preserve the hyperbolic lines. In this case we should keep scales 1, 2, 3, 4 and the medium and low voices of the scale 5. The scales 6 and 7, as well the high voices of scale 5 should be erased. We are working at present, on a coherent pattern filter that automatically decompose the signal, identify the patterns, and erase the inconvenient patterns.
Acknowledgements. Financial support from the Brazilian
agen-cies CNPq, FAPERN, FACEPE, FINEP and CTPETRO is acknowledged.
Edited by: T. Chang
Reviewed by: three anonymous referees
References
Allaei, S. V., Sahimi, M., and Tabar, M. R. R.: Propagation of acoustic waves as a probe for distinguishing heterogeneous me-dia with short-range and long-range correlations, J. Stat. Mech.-Theory E, 3, 16–+, doi:10.1088/1742-5468/2008/03/P03016, 2008.
Bernacchia, A., Naveau, P., Vrac, M., and Yiou, P.: Detecting spa-tial patterns with the cumulant function - Part 2: An application to El Ni˜no, Nonlin. Processes Geophys., 15, 169–177, 2008, http://www.nonlin-processes-geophys.net/15/169/2008/. Chakraborty, A. and Okaya, D.: Frequency-time decomposition
of seismic data using wavelet-based methods, Geophysics, 60, 1906–1916, 1995.
Corso, G., Kuhn, P., Lucena, L., and Thom´e, Z.: Seismic ground roll time-frequency filtering using the Gaussian wavelet trans-form, Physica A, 318, 551–561, 2003.
Daubechies, I.: Ten Lectures on Wavelets, in: CBMS-NSF Re-gional Conference Series in Applied Mathematics, SIAM: Soci-ety for Industrial and Applied Mathematics, 61, ISBN-13: 978-0-898712-74-2/ISBN-10: 0-89871-274-2, 1992.
Droujinine, A.: Multi-scale geophysical data analysis using the eigenimage discrete wavelet transform, J. Geophys. Eng., 3, 59– 81, 2006.
Grossmann, A., Kronland-Martinet, R., and Morlet, J.: Reading and understanding continuous wavelets transforms, Springer, New York, NY, USA, 2nd edn. 1991, p. 20, 1989.
Huang, N. E., Shen, Z., and Long, S.: A new view of nonlinear water waves: The Hilbert spectrum, Annu. Rev. Fluid Mech., 31, 417–457, 1999.
Leite, F., Montagne, R., Corso, G., Vasconcelos, G., and Lucena, L.: Optimal wavelet filter for suppression of coherent noise with an application to seismic data, Physica A, 387(7), 1439–1445, 2008.
Liu, X.: Ground roll suppression using the Karhunen-Lo`eve trans-form, Geophysics, 64, 564 pp., 1999.
Lu, W.: Adaptive noise attenation of seismic image using Singu-lar Value Decomposition an texture direction detection, IEEE T. Image Process., 2, p. 465, 2002.
Mallat, S.: A wavelet tour of signal processing, Academic Press, New York, 2nd edn., 637 pp., 1998.
Montagne, R. and Vasconcelos, G.: An optimized filter for seis-mic data using the Karhunen-Lo`eve transform and a minimum-energy criterium, Physical Review E, 74, 01016213, 2006a. Montagne, R. and Vasconcelos, G.: Thermodynamic criteria for
optimal suppression of coherent noise in seismic data using the Karhunen-Lo`eve transform, Physica A, 371(1), 122–125, 2006b. Neupauer, R. M. and Powell, K. L.: A fully-anisotropic Morlet wavelet to identify dominant orientations in a porous medium-star, Comput. Geosci., 31, 465 pp., 2005.
Pi˜nuela, J., Andina, D., McInnes, K., and Tarquis, A.: Wavelet anal-ysis in a structured clay soil using 2-D images, Nonlin. Processes Geophys., 14, 425–434, 2007,
http://www.nonlin-processes-geophys.net/14/425/2007/. Torrence, C. and Compo, G. P.: A Practical Guide to Wavelet
Anal-ysis, B. Am. Meteorol. Soc., 79, 61 pp., 1998.
Tselentis, G., Serpetsidaki, A., Martakis, N., Sokos, E., Paraskevopoulos, P., and Kapotas, S.: Local high-resolution pas-sive seismic tomography and Kohonen neural networks – Ap-plication at the Rio-Antirio Strait, central Greece, Geophysics, 72(4), B93–B106, 2007.
Welford, J. K. and Zhang, R.: Ground-roll suppression from deep crustal seismic reflection data using a wavelet-based approach: A case study from western Canada, Geophysics, 69(4), p. 877, 2004.