Some Improved Modified Ratio Estimators Based
on Decile Mean of an Auxiliary Variable
Muhammad Abid
Department of Statistics, Faculty of Science and Technology Government College University, Faisalabad, Pakistan [email protected]
Rehan Ahmed Khan Sherwani
College of Statistical and Actuarial Sciences University of the Punjab Lahore, Pakistan [email protected]
Nasir Abbas
Department of Statistics, Faculty of Science and Technology Government College University, Faisalabad, Pakistan [email protected]
Muhammad Ali Raza
Department of Statistics, Faculty of Science and Technology Government College University, Faisalabad, Pakistan [email protected]
Abstract
The estimators developed so far regarding the study under consideration use the conventional measures of central tendencies, i.e. the mean, the median, the quartile mean etc., and comment on their properties. However, Sohel et al. (2012) have proposed decile mean as a measure of central tendency and have proved that it outperforms the conventional measures of central tendency. In this study, we have attempted to use the decile mean instead of the conventional measures suggested in previous studies. Also, we have used decile mean, population correlation coefficient, coefficient of variation and the linear combinations of auxiliary variable and investigated the properties associated with the proposed estimator. Theoretically, mean square error equations of all proposed ratio estimators are obtained and the efficiency conditions are derived. This study has been verified numerically.
Keywords: Auxiliary variable; Coefficient of variation; Decile mean; Mean squared error; Population correlation coefficient.
1. Introduction
Now a day, the information obtained through auxiliary variables was largely discussed in survey sampling. The auxiliary variables are generally connected with the study variables and we may take up this information in different forms such as ratio, product and regression etc. The auxiliary information may be accessible from several sources such as similar studies in past, economic reports, national census etc.
The problem of constructing efficient estimators for the population mean has been widely discussed by Several researcher such as Cochran (1940), Kadilar and Cingi (2004, 2006)), Murthy (1967), Rao (1991), Singh and Tailor (2003), Sisodia and Dwivedi (1981), Subramani and Kumarapandiyan (2012a, 2012b, 2012c, 2012d), Upadhyaya and Singh (1999), Yan and Tian (2010), Abid et al. (2016a, 2016b, 2016c) are developed efficient estimators for the population mean based on the auxiliary obtained in the form of ratio estimator.
Let * + be the different and particular units from a finite population and be the study variable with value obtained from , The purpose is to estimation population mean ̅ ∑ on the base of a random sample.
The notations considered in this article are as follows:
NOMENCLATURE
Romen
Population size Sample size
⁄ Sampling fraction Study variable Auxiliary variable
̅ ̅ Population means
̅ ̅ Sample means
Sample totals
Population standard deviations
Population covariance between
Coefficient of variation
( ) Bias of the Estimator
( ) Mean square error of the estimator
̅̂ Existing modified ratio estimator of ̅
̅̂ Proposed modified ratio estimator of ̅ Median of auxiliary variable
Quartile Deviation
∑ ( ) ( ) Gini’s Mean Difference
( ) √ ∑ ( ) ( ) Downton’s method
√ ∑ ( ) ( ) Probability Weighted Moments
Subscript
For existing estimators For proposed estimators
Greek
Coefficient of correlation
∑ ( ̅)
( )( ) Coefficient of skewness of auxiliary variable ( ) ∑ ( ̅)
( )( )( )
( )
( )( ) Coefficient of kurtosis of auxiliary variable
Regression coefficient of on
The ratio estimator based on the population mean, ̅, is defined as
̅̂ ̅ ̅ ̅ (1)
The bias, related constant and the mean squared error (MSE) of the ratio estimator are respectively given by
( ̅̂) ( ) ̅( ), ̅ ̅ , ( ̅̂) ( )(
).
The rest of the study is presented as follows: Section 2 gives a explanation of the existing estimators. The construction and the efficiency comparison of the suggested estimator with the existing estimators are obtainable in Section 3. Section 4 contains the numerical comparison of the proposed and existing estimators. Finally, conclusions of the study are given in Section 5.
2. The existing modified ratio estimators
Kadilar and Cingi (2004, 2006) has been proposed some linear regression type ratio estimators as follows:
̅̂ ̅ ( ̅ ̅) ̅ ̅, ̅̂ ̅ ( ̅ ̅)( ̅ ) ( ̅ ), ̅̂ ̅ ( ̅ ̅)( ̅ ) ( ̅ ),
̅̂ ̅ ( ̅ ̅)( ̅ ) ( ̅ ), ̅̂ ̅ ( ̅ ̅)( ̅ ) ( ̅ ), ̅̂ ̅ ( ̅ ̅) ̅ ( ̅ ),
̅̂ ̅ ( ̅ ̅)( ̅ ) ( ̅ ),
̅̂ ̅ ( ̅ ̅)( ̅ ) ( ̅ ), ̅̂ ̅ ( ̅ ̅)
( ̅ ) ( ̅ ), ̅̂
̅ ( ̅ ̅)
( ̅ ) ( ̅ ).
Yan and Tian (2010) suggested some modified linear regression type ratio estimators as follows:
The Subramani and Kumarapandiyan (2012a, 2012b, 2012c) suggested estimators based on population median, skewness, kurtosis and coefficient of variation of an auxiliary variable are shown below:
̅̂ ̅ ( ̅ ̅)( ̅ ) ( ̅ ), ̅̂ ̅ ( ̅ ̅)( ̅ )( ̅ ), ̅̂ ̅ ( ̅ ̅)( ̅ )( ̅ ),
̅̂ ̅ ( ̅ ̅)( ̅ )( ̅ ).
Jeelani et al. (2013) developed an estimator based on quartile deviation and skewness. Jeelani et al. (2013) can be written as,
̅̂ ̅ ( ̅ ̅)( ̅ )( ̅ ).
Abid et al. (2016c) developed some modified ratio estimators by using non-conventional measures of dispersions. Abid et al. (2016c) estimators can be written as,
̅̂ ̅ ( ̅ ̅)( ̅ ) ( ̅ ), ̅̂ ̅ ( ̅ ̅)( ̅ ) ( ̅ ), ̅̂ ̅ ( ̅ ̅)( ̅ ) ( ̅ ), ̅̂ ̅ ( ̅ ̅)( ̅ ) ( ̅ ), ̅̂ ̅ ( ̅ ̅)( ̅ ) ( ̅ ), ̅̂ ̅ ( ̅ ̅)( ̅ ) ( ̅ ), ̅̂ ̅ ( ̅ ̅)( ̅ ) ( ̅ ), ̅̂ ̅ ( ̅ ̅) ( ̅ )( ̅ ), ̅̂ ̅ ( ̅ ̅) ( ̅ )( ̅ ).
The constants, biases and MSEs of the estimators developed by Kadilar and Cingi (2004, 2006), Yan and Tian (2010), Subramani and Kumarapandiyan (2012a, 2012b, 2012c), Jeelani et al. (2013) and Abid et al. (2016c) are given below, respectively,
( ̅̂ ) ( ) ̅ , ( ̅̂ ) ( ) ̅ , ( ̅̂ ) ( ) ̅ , ( ̅̂ )
( )
̅ , ( ̅̂ ) ( )
̅ , ( ̅̂ ) ( )
̅ , ( ̅̂ ) ( )
̅ ,
( ̅̂ ) ( ) ̅ , ( ̅̂ ) ( ) ̅ , ( ̅̂ ) ( ) ̅ .
( ̅̂) ( )( ( )), ( ̅̂ ) ( )( ( )),
( ̅̂ ) ( )( ( )), ( ̅̂) ( )( ( )),
( ̅̂ ) ( )( ( )), ( ̅̂) ( )( ( )),
( ̅̂ ) ( )( ( )), ( ̅̂) ( )( ( )),
( ̅̂) ( )( ( )), ( ̅̂ ) ( )( ( )),
( ̅̂ ) ( )( ( )), ( ̅̂ ) ( )( ( )),
( ̅̂ ) ( )( ( )), ( ̅̂ ) ( )( ( )),
( ̅̂ ) ( )( ( )), ( ̅̂ ) ( )( ( )),
( ̅̂ ) ( )( ( )), ( ̅̂ ) ( )( ( )),
( ̅̂ ) ( )( ( )), ( ̅̂ ) ( )( ( )),
( ̅̂ ) ( )( ( )), ( ̅̂ ) ( )( ( )),
( ̅̂ ) ( )( ( )), ( ̅̂ ) ( )( ( )),
( ̅̂ ) ( )( ( )), ( ̅̂ ) ( )( ( )).
3. The Suggested modified ratio estimators
In this section, we have suggested some modified ratio type estimators using the auxiliary information on population decile mean, population coefficient of variation and population correlation coefficient for the estimation of population mean of a variable of interest. Sohel et al. (2012) showed that the decile mean perform better than the conventional measures of locations such as mean, median, mode in the presence of extreme values. So, it is better to use decile mean instead of mean, median and mode when the extreme values are present in the data sets. The proposed estimators are shown below,
̅̂ ̅ ( ̅ ̅)
( ̅ ) ( ̅ ), ̅̂
̅ ( ̅ ̅)
( ̅ ) ( ̅ ), ̅̂
̅ ( ̅ ̅)
( ̅ ) ( ̅ ).
whereas the bias, constant and MSE of these proposed estimators are respectively as under:
( ̅ ) ̅ , ( ̅ ̅ ), ( ̅ ) ̅ .
( ̅̂ ) ( )( ( )), ( ̅̂ ) ( )( ( )),
( ̅̂ ) ( )( ( )).
3.1. Efficiency Comparisons
In this section, the efficiency conditions for which the proposed modified ratio estimators performs better as compared to the existing modified ratio estimators have been derived algebraically.
3.2.1. Comparisons with existing ratio estimator
The proposed ratio estimators performed better than the existing ratio estimators if an only if,
( ̅̂ ) ( ̅̂), ( )(
( )) ( )( ( )), ,
, (2)
where .
If the above condition is fulfilled, then our suggested estimators perform better as compared to the existing estimators consider in this study.
4. Numerical Illustration
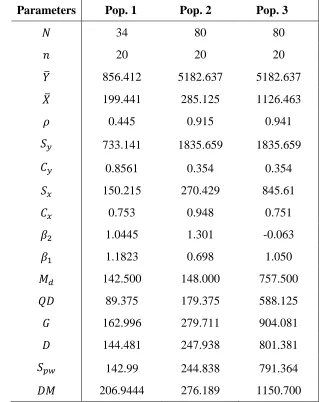
For the empirical study of the proposed and existing estimators, we have used 3 natural populations. The population 1 is obtained from Singh and Chaudhary (1986) page 177 and Population 2 and Population 3 are obtained from Murthy (1967) page 228.
Table 1: Characteristics of the Populations.
Parameters Pop. 1 Pop. 2 Pop. 3
34 80 80
20 20 20
̅ 856.412 5182.637 5182.637
̅ 199.441 285.125 1126.463
0.445 0.915 0.941
733.141 1835.659 1835.659
0.8561 0.354 0.354
150.215 270.429 845.61
0.753 0.948 0.751
1.0445 1.301 -0.063
1.1823 0.698 1.050
142.500 148.000 757.500
89.375 179.375 588.125
162.996 279.711 904.081 144.481 247.938 801.381
142.99 244.838 791.364
206.9444 276.189 1150.700
From an analysis of Tables 2-5, several interesting observations can be made:
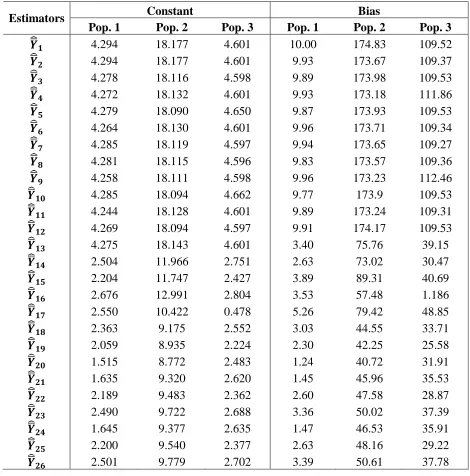
It is observed that the condition mentioned in equation (2) is satisfied because all the proposed estimators have smaller values of constants as compared to the existing estimators (cf Table 2 vs Table 3).
The biases of the suggested estimators are smaller than the existing estimators in literature (cf Table 2 vs Table 3).
Table 2: The biases and constants of existing estimators
Estimators Constant Bias
Pop. 1 Pop. 2 Pop. 3 Pop. 1 Pop. 2 Pop. 3
̅̂ 4.294 18.177 4.601 10.00 174.83 109.52
̅̂ 4.294 18.177 4.601 9.93 173.67 109.37
̅̂ 4.278 18.116 4.598 9.89 173.98 109.53
̅̂ 4.272 18.132 4.601 9.93 173.18 111.86
̅̂ 4.279 18.090 4.650 9.87 173.93 109.53
̅̂ 4.264 18.130 4.601 9.96 173.71 109.34
̅̂ 4.285 18.119 4.597 9.94 173.65 109.27
̅̂ 4.281 18.115 4.596 9.83 173.57 109.36
̅̂ 4.258 18.111 4.598 9.96 173.23 112.46
̅̂ 4.285 18.094 4.662 9.77 173.9 109.53
̅̂ 4.244 18.128 4.601 9.89 173.24 109.31
̅̂ 4.269 18.094 4.597 9.91 174.17 109.53
̅̂ 4.275 18.143 4.601 3.40 75.76 39.15
̅̂ 2.504 11.966 2.751 2.63 73.02 30.47
̅̂ 2.204 11.747 2.427 3.89 89.31 40.69
̅̂ 2.676 12.991 2.804 3.53 57.48 1.186
̅̂ 2.550 10.422 0.478 5.26 79.42 48.85
̅̂ 2.363 9.175 2.552 3.03 44.55 33.71
̅̂ 2.059 8.935 2.224 2.30 42.25 25.58
̅̂ 1.515 8.772 2.483 1.24 40.72 31.91
̅̂ 1.635 9.320 2.620 1.45 45.96 35.53
̅̂ 2.189 9.483 2.362 2.60 47.58 28.87
̅̂ 2.490 9.722 2.688 3.36 50.02 37.39
̅̂ 1.645 9.377 2.635 1.47 46.53 35.91
̅̂ 2.200 9.540 2.377 2.63 48.16 29.22
̅̂ 2.501 9.779 2.702 3.39 50.61 37.78
Table 3: The biases and constants of proposed estimators
Estimators Constant Bias
Pop. 1 Pop. 2 Pop. 3 Pop. 1 Pop. 2 Pop. 3
̅̂ 2.107 9.233 2.276 2.137 45.111 26.800
̅̂ 1.806 8.993 1.949 1.483 42.792 19.650
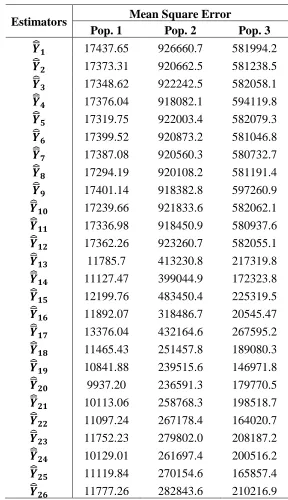
Table 4: Mean square errors of existing estimators
Estimators Mean Square Error
Pop. 1 Pop. 2 Pop. 3
̅̂ 17437.65 926660.7 581994.2
̅̂ 17373.31 920662.5 581238.5 ̅̂ 17348.62 922242.5 582058.1 ̅̂ 17376.04 918082.1 594119.8 ̅̂ 17319.75 922003.4 582079.3 ̅̂ 17399.52 920873.2 581046.8 ̅̂ 17387.08 920560.3 580732.7 ̅̂ 17294.19 920108.2 581191.4
̅̂ 17401.14 918382.8 597260.9 ̅̂ 17239.66 921833.6 582062.1 ̅̂ 17336.98 918450.9 580937.6 ̅̂ 17362.26 923260.7 582055.1 ̅̂ 11785.7 413230.8 217319.8 ̅̂ 11127.47 399044.9 172323.8 ̅̂ 12199.76 483450.4 225319.5
̅̂ 11892.07 318486.7 20545.47 ̅̂ 13376.04 432164.6 267595.2 ̅̂ 11465.43 251457.8 189080.3 ̅̂ 10841.88 239515.6 146971.8 ̅̂ 9937.20 236591.3 179770.5 ̅̂ 10113.06 258768.3 198518.7 ̅̂ 11097.24 267178.4 164020.7 ̅̂ 11752.23 279802.0 208187.2 ̅̂ 10129.01 261697.4 200516.2 ̅̂ 11119.84 270154.6 165857.4 ̅̂ 11777.26 282843.6 210216.9
Table 5: Mean square errors of proposed estimators
Estimators Mean Square Error
Pop. 1 Pop. 2 Pop. 3
̅̂ 10934.74 254364.7 153292.6
̅̂ 10386.83 242346.5 116239.3
It can be seen that the proposed estimators have smaller values of MSE as compared to the estimators proposed by Kadilar and Cingi (2004), Kadilar and Cingi (2006), Subramani and Kumarapandiyan (2012a), Subramani and Kumarapandiyan (2012b), Subramani and Kumarapandiyan (2012c), Jeelani et al. (2013) and Abid at al. (2016c) which shows that the proposed estimators are perform better as compared to the existing estimators (cf Table 4 vs Table 5). It is noted that the proposed estimator, ̅̂ has a smaller MSE value i.e. (9644.04,
234368.4 and 144936.7) as compared to all the proposed estimators and existing estimator for three real populations consider in this study (cf Table 4 vs Table 5). So in general, we can say that our suggested modified ratio estimators are perform more efficiently as compared to the existing modified ratio estimators.
5. Conclusions
In sample survey the availability of auxiliary information enhances the efficiency of the estimators. In this study, we have been proposed several modified ratio estimators using known value of population decile mean, coefficient of variation and population correlation coefficient by using the information on the auxiliary variable. It is observed that the mean squared errors values of the suggested estimators are smaller than existing estimators for all the selected three known populations. Also, as we know that the measures like the mean, median and mode are affected by the extreme values in the population, while decile mean is robust to extreme values. Hence, it can be claimed that our proposed estimators outperform than the exiting estimators for the practical consideration.
References
1. Abid, M., Abbas, N., Nazir, H.Z. and Lin, Z. (2016a). Enhancing the mean ratio estimators for estimating population mean using non-conventional location parameters. Revista Colombiana de Estadistica, 39(1), 63-79.
2. Abid, M., Abbas, N. and Riaz, M. (2016b). Improved modified ratio estimators of population mean based on deciles. Chiang Mai Journal of Science, 43(1), 1311-1323.
3. Abid, M., Abbas, N., Sherwani, R.A.K. and Nazir, H.Z. (2016c). Improved ratio estimators for the population mean using non-conventional measures of dispersion. Pakistan Journal of Statistics and Operation Research, 12(2), 353-367.
4. Cochran, W. G. (1940). Sampling Techniques, Third Edition, Wiley Eastern Limited.
5. Jeelani, M. I. Maqbool, S. and Mir, S. A. (2013). Modified ratio estimators of population mean using linear combination of coefficient of skewness and quartile deviation. International Journal of Modern Mathematical Sciences, (6), 174–183. 6. Kadilar, C. and Cingi, H. (2004). Ratio estimators in simple random sampling.
7. Kadilar, C. and Cingi, H. (2006). An Improvement in estimating the population mean by using the correlation coefficient, Hacettepe Journal of Mathematics and Statistics, 35 (1), 103-109.
8. Murthy, M.N. (1967). Sampling Theory and Methods. Statistical Publishing Society, Calcutta, India.
9. Rao, T.J. (1991). On certain methods of improving ratio and regression estimators. Communications in Statistics-Theory and Methods, 20 (10), 3325–3340.
10. Singh, D. and Chaudhary, F.S. (1986). Theory and Analysis of Sample Survey Designs. New Age International Publisher.
11. Singh, H.P. and Tailor, R. (2003). Use of known correlation coefficient in estimating the finite population means, Statistics in Transition, 6 (4), 555-560. 12. Sisodia, B.V.S. and Dwivedi, V.K. (1981). A modified ratio estimator using
coefficient of variation of auxiliary variable. Journal of the Indian Society of Agricultural Statistics, 33(1), 13-18.
13. Sohel, R., Md, S.U.D., Habshah, M. and Imon, A.H.M.R. (2012). Decile mean: A new robust measure of central tendency, Chiang Mai Journal of Science, 39(3), 478-485.
14. Subramani, J. and Kumarapandiyan, G. (2012a). Estimation of Population Mean using Co-efficient of variation and Median of an Auxiliary Variable. International Journal of Probability and Statistics, (1), 111–118.
15. Subramani, J. and Kumarapandiyan, G. (2012b). Estimation of population mean using known median and co-efficient of skewness. American Journal of Mathematics and Statistics, (2), 101-107.
16. Subramani, J. and Kumarapandiyan, G. (2012c). Modified ratio estimators using known median and co-efficient of kurtosis. American Journal of Mathematics and Statistics, (2), 95–100.
17. Subramani, J.and Kumarapandiyan, G. (2102d). A class of modified ratio estimators using Deciles of an Auxiliary Variable. International Journal of Statistical Application, 2, 101-107.
18. Upadhyaya, L.N. and Singh, H.P. (1999). Use of transformed auxiliary variable in estimating the finite population mean, Biometrical Journal, 41(5), 627-636. 19. Yan, Z. and Tian, B. (2010). Ratio method to the mean estimation using