https://doi.org/10.5194/esd-8-1107-2017 © Author(s) 2017. This work is distributed under the Creative Commons Attribution 3.0 License.
Structure and functioning of the acid–base
system in the Baltic Sea
Karol Kuli ´nski1, Bernd Schneider2, Beata Szymczycha1, and Marcin Stokowski1
1Institute of Oceanology, Polish Academy of Sciences, IO PAN,
ul. Powsta´nców Warszawy 55, 81-712 Sopot, Poland
2Leibniz Institute for Baltic Sea Research Warnemünde, IOW, Seestrasse 15, 18119 Rostock, Germany
Correspondence:Karol Kuli´nski ([email protected])
Received: 6 April 2017 – Discussion started: 12 April 2017
Revised: 21 October 2017 – Accepted: 6 November 2017 – Published: 11 December 2017
Abstract. The marine acid–base system is relatively well understood for oceanic waters. Its structure and func-tioning is less obvious for the coastal and shelf seas due to a number of regionally specific anomalies. In this review article we collect and integrate existing knowledge of the acid–base system in the Baltic Sea. Hydro-graphical and biogeochemical characteristics of the Baltic Sea, as manifested in horizontal and vertical salinity gradients, permanent stratification of the water column, eutrophication, high organic-matter concentrations and high anthropogenic pressure, make the acid–base system complex. In this study, we summarize the general knowledge of the marine acid–base system as well as describe the peculiarities identified and reported for the Baltic Sea specifically. In this context we discuss issues such as dissociation constants in brackish water, differ-ent chemical alkalinity models including contributions by organic acid–base systems, long-term changes in total alkalinity, anomalies of borate alkalinity, and the acid–base effects of biomass production and mineralization. Finally, we identify research gaps and specify limitations concerning the Baltic Sea acid–base system.
1 Introduction
The acid–base system controlling seawater pH is formed by a number of chemical substances having acid–base properties (Dickson et al., 2007). The importance of each of these sub-stances (structure of the acid–base system) depends on both concentrations of individual constituents and their dissocia-tion constants. The control by physical condidissocia-tions (temper-ature, salinity) and biogeochemical processes (e.g. biomass production and mineralization) as well as interrelationships between individual components determine the functioning of the acid–base system. The understanding of the structure and functioning of the acid–base system is necessary to inves-tigate important issues that shape the Baltic Sea ecosystem and that are of interest in present-day chemical oceanogra-phy, such as ocean acidification, calcium carbonate (CaCO3)
formation/dissolution and carbon dioxide (CO2) exchange
through the air–sea interface.
The steady increase in atmospheric CO2 concentrations
leads to enhanced dissolution of CO2 in the ocean. Since
CO2dissolved in seawater forms diprotic carbonic acid,
hy-drogen ions are released. Although the major fraction of the hydrogen ions are taken up by carbonate ions (a buffering re-action), a significant fraction stays in the water column and thus causes a decrease in pH. This phenomenon is known in the scientific literature as “ocean acidification” although seawater does not really become acidic but only moves from its alkaline character towards the acidic regime (Riebesell et al., 2010). Ocean acidification has been recognized as one of the greatest threats for marine ecosystems not only by the scientific community (e.g. Bates et al., 2014; Zeebe, 2012), but also in European Union (EU) legislation. The EU Ma-rine Strategy Framework Directive (MSFD, 2008) explicitly points out that the EU member states should place more at-tention on ocean acidification and emphasizes the necessity to include measurements of pH and of the CO2partial
pres-sure (pCO2) as descriptors for the environmental status of
There is a general belief that the magnitude of ocean acid-ification can be sufficiently quantified from the atmospheric pCO2 levels and the CO2 exchange between seawater and
the atmosphere (Zeebe, 2012; Riebesell et al., 2010; Caldeira and Wicket, 2003). This is generally true for oceanic waters. However, it is not the case for coastal seas because several other processes influence seawater pH such as CaCO3
forma-tion and/or dissoluforma-tion, eutrophicaforma-tion or oligotrophicaforma-tion, total alkalinity (AT) consumption and production,
weather-ing, contribution by organic substances, and terrestrial in-puts. The general structure and functioning of the acid–base system in seawater are relatively well identified; however, some aspects still show a lot of gaps and/or shortcomings, which can lead to wrong conclusions and questionable pre-dictions of the future pH development (Orr et al., 2015; Ko-eve and Oschlies, 2012; Hunt et al., 2011; Dickson et al., 2007; Cai et al., 1998).
Since the CO2system is an integral part of the ocean acid–
base system, it is impossible to understand the CO2system
and to assess processes such as the CO2 gas exchange or
CaCO3dissolution/formation without a clear idea about the
structure and functioning of the whole acid–base system. The saturation states of calcite and aragonite are of crucial impor-tance for organisms forming their exoskeletons from CaCO3.
Although pelagic calcifying organisms do not occur in the Baltic Sea, this aspect is still relevant as some benthic organ-isms can also build CaCO3 into their shells (Tyrrell et al.,
2008). Moreover, calcifying processes not only depend on the acid–base system structure but in turn can modify it by decreasing the concentration of carbonate ions (CO23−) and thus the alkalinity.
Carbon dioxide is a major component of the global carbon cycle and transport of CO2 links all Earth’s compartments.
It is believed that the world oceans absorb about 25 % of anthropogenic CO2emissions. However, there is still a
de-bate on the role that the shelf seas play in this context (Le Quéré, 2016). The direction and magnitude of the CO2
ex-change through the air–sea interface depend largely on the pCO2difference between seawater and the atmosphere. The
level of seawater pCO2is mainly controlled by the structure
of the acid–base system, which is influenced by the combined effect of biological activity (biomass production vs. mineral-ization), CO2exchange with the atmosphere and temperature
(Emerson and Hedges, 2008).
In this context the Baltic Sea can be considered a very complex ecosystem. On the one hand, the low buffer ca-pacity (Beldowski et al., 2010) makes the seawater vulner-able to acidification in most regions of the Baltic Sea; on the other hand, the sea is exposed to various anthropogenic in-fluences which have the potential to change the acid–base system and thus also seawater pH and all pH-related pro-cesses. This makes the Baltic Sea different from the oceans for which the CO2system as part of the acid–base system
has been well characterized during the last decades (Bates et al., 2014; Riebesell et al., 2010; Dickson et al., 2007). A
considerable research effort was also made in recent years to investigate the Baltic Sea CO2system and its
peculiari-ties. However, this was done from different perspectives and resulted in specific problem-oriented and diverse knowledge. Therefore, the goal of this review article is to collect and inte-grate the existing knowledge of the structure and functioning of the acid–base system in the Baltic Sea, to point out the re-search gaps and thus also to address challenges for the future research in this field.
2 The standard acid–base model for ocean water
Four measurable variables exist to describe the acid–base system of seawater. These are pCO2, pH, total inorganic
car-bon concentration (CT, known also as DIC) and total
alkalin-ity (AT).CTis the total concentration of all inorganic carbon
forms present in seawater (Eq. 1), where [CO2*] represents
the sum of molecular dissolved CO2and undissociated
car-bonic acid (H2CO3):
CT=CO∗2+HCO−3+
h
CO23−
i
. (1)
Measurements ofCT are usually based on the acidification
of the sample and coulometric or infrared detection of the extracted CO2 (Dickson et al., 2007).AT is defined as the
excess of proton acceptors (bases formed from weak acids with a dissociation constant of K ≤10−4.5 at 25◦C) over proton donors (acids withK >10−4.5) and expressed as the hydrogen ion equivalent in 1 kg of sample (Dickson, 1981):
AT=HCO−3+2hCO32−i+B(OH)−4+OH− +hHPO24−i+2hPO43−i+SiO(OH)−3+[NH3]
+HS−
+[minor bases]−H+
−HSO−4
−[HF]
−[H3PO4]−[minor acids]. (2)
AT can be determined by open- or closed-cell acidimetric
titration. For both CT and AT certified reference
materi-als are provided by Andrew Dickson’s laboratory, UC San Diego, USA (Dickson et al., 2007). pH measurements in seawater are usually calibrated against tris buffer. Its char-acteristics are well known at salinities of 20–35 (Mosley et al., 2004; DelValls and Dickson, 1998). The efforts to improve the tris buffer characteristics for lower salinities are ongoing within the BONUS PINBAL project (https:// www.io-warnemuende.de/pinbal-home.html). The use of tris buffer helps to calibrate the systems for pH measurements but does not fully guarantee the quality of the pH results as reference materials in seawater matrix still do not exist for pH measurements. In many cases pH is still measured poten-tiometrically on the NBS scale although spectrophotometric measurements on the total scale (pHtot), which also takes into
equilibrium with seawater. According to the standard operat-ing procedure (Dickson et al., 2007), measurements of pCO2
require the continuous flow of water, which makes this pa-rameter difficult to measure in discrete samples.
All four variables interact and control the pH as described by a set of equilibrium constants and mass balance equa-tions. In general the interrelationships between these four pa-rameters facilitate the calculation of any two variables when the two others are known, e.g. through measurements, and when the dissociation constants of the involved acid–base re-actions are known for the respective temperature and salin-ity. This fact is used in biogeochemical models for simula-tions of the marine CO2system. All biogeochemical models
are based on the transport and transformations ofATandCT
because these variables are independent of temperature and pressure and behave conservatively with respect to mixing (mass conservation). Moreover, straightforward techniques for sampling and analysis forATandCT exist and are sup-ported by the availability of reference materials (Dickson et al., 2007). Hence, these two variables are very well suited for CO2system studies. However, the use ofATandCTfor the
CO2system studies is not free of limitations. To obtain high
accuracy for the calculation of pH and pCO2from measured
or modelledATandCT, all dissociation constants and total
concentrations of all non-CO2components of the acid–base
system must be known. This requirement is generally ful-filled with regard to ocean studies where the total concentra-tions of non-CO2acid–base components are either negligible
or can be approximated as a function of salinity (Riebesell et al., 2010). However, this issue is more critical for coastal and shelf regions, where the biogeochemical composition of seawater shows regional peculiarities (e.g. Kuli´nski 2014; Hernandez-Ayon et al., 2007; Cai et al., 1998). This is the case for the Baltic Sea, which shows various unique biogeo-chemical characteristics.
3 Peculiarities of the Baltic Sea acid–base system
3.1 Hydrographic setting
The Baltic Sea is one of the largest brackish ecosystems in the world. This is caused by both limited inflows of saline oceanic water through the shallow and narrow Danish Straits and high river runoff. The drainage basin of the Baltic Sea is almost 4 times larger than the area of the sea itself, while the mean annual freshwater supply (428 km3) constitutes about 2 % of the Baltic Sea water volume (22×103km3). The spe-cific features of the Baltic Sea hydrology cause clear horizon-tal and vertical salinity gradients. Salinity in the surface layer fluctuate from 2 in the northern Bothnian Bay to > 20 ob-served in the Kattegat. Dense and highly saline water, which irregularly enters the Baltic Sea, sinks and moves along the sea bottom. This deep water is separated from the brackish surface water layer by a permanent halocline located at a depth of 60–70 m, which is at the same time the maximum
mixed layer depth in the Baltic Sea (Lass and Matthäus, 2008; Winsor et al., 2001). The stratification limits ventila-tion of the deep-water masses. Simultaneously, the deeper water layers are supplied with large amounts of particulate organic matter that either originated from terrestrial sources or derived from the biomass production in the surface un-der the influence of high nutrient concentrations (eutrophica-tion). Some fraction of the sedimentary organic matter min-eralizes releasing CO2and consuming oxidants, which leads
to hypoxia or even anoxia in the bottom waters (HELCOM, 2009).
3.2 Dissociation constants in brackish water
If any variables of the marine CO2system are to be used for
biogeochemical studies, it is advisable to measure these di-rectly and not to derive it from the measurements of other variables of the CO2 system (Dickson et al., 2007).
How-ever, sometimes direct measurements may be prevented by technical reasons or routine analytical methods do not exist. The latter refers, for example, to the determination of CO23− ion concentrations, which are important for the assessment of the state of the CaCO3 saturation and thus for the
disso-lution or formation of CaCO3 shells. In this case,
calcula-tions on the basis of other known variables such asCT,AT, pCO2or pH are indispensable and require knowledge about
the equilibrium constants of the CO2system. Here we
exam-ine the availability of the necessary constants for low-salinity brackish water. Three fundamental equations characterize the equilibria of the marine CO2system. The first refers to the
solubility of gaseous CO2in seawater:
CO∗2=
k0·fCO2. (3)
The solubility constant,k0, relates the concentration of CO∗2
in seawater to the CO2fugacity, fCO2. In contrast to the CO2
partial pressure, pCO2, the fugacity accounts for the
non-ideal behaviour of CO2at atmospheric conditions. It differs
only slightly from the pCO2 and in many cases can be
re-placed by the pCO2. The solubility and thusk0decrease with
increasing temperature and salinity and vice versa. Studies by Weiss (1974) that describek0as a function of tempera-ture and salinity have received widespread acceptance and are almost exclusively used in chemical oceanography. The situation is somewhat more complicated for the determina-tion of the dissociadetermina-tion constants for carbonic acid because it is a diprotic acid. Again using CO2* as a variable, the two
dissociation equilibria are given by
K1=
H+ HCO−3/[CO∗2], (4)
K2= [H+]hCO32−i/[HCO−3]. (5)
Figure 1.Map of the Baltic Sea showing its division into natural basins and sub-basins (modified after Kuli´nski and Pempkowiak, 2011).
Systematic studies concerning the dissociation constants of carbonic acid in seawater were already performed during the 20s and 30s of the last century. One of the leading scien-tists in this field was Kurt Buch from the former Finnish Insti-tute for Marine Research, whose research was mainly related to the Baltic Sea and whose laboratory studies on the CO2
system focused on brackish water with salinities down to 0. The results of his lab work and of field studies performed dur-ing 1927 to 1936 are summarized in Buch (1945). The pre-sented dissociation constants must be considered “hybrid” constants because the hydrogen ions are represented by the hydrogen ion activity, whereas the CO2constituents refer to
concentrations.
With the increasing awareness of the importance of the oceans for the uptake of anthropogenic CO2 and thus
for climate change scenarios, large-scale measurement pro-grammes concerning the state of the marine CO2system on
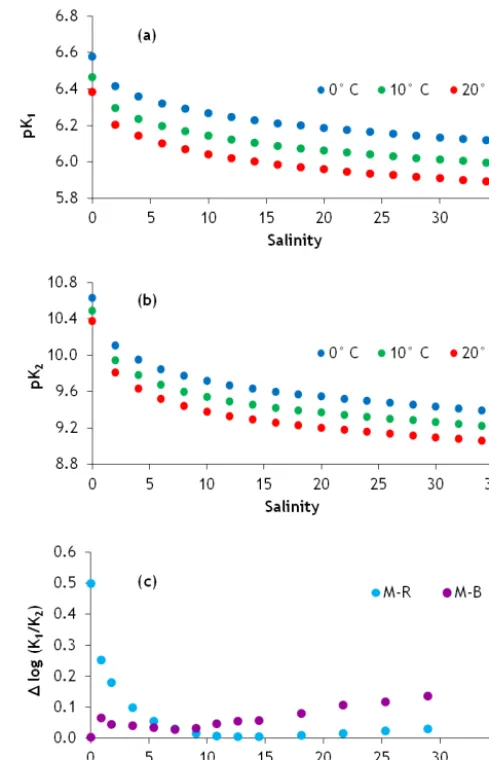
then this set of dissociation constants is state of the art for CO2 research in brackish waters. The salinity and the
tem-perature dependency ofK1andK2are presented in Fig. 2a and b, respectively.
A direct comparison between the dissociation constants that were used in the past for brackish water is difficult be-cause the constants by Buch (1945) are based on a pH scale that is based on the hydrogen ion activity. Since it is difficult to convert the activities to total hydrogen ion concentrations, we use the ratioK1/ K2for a comparison. This ratio is
ob-tained by dividing the equilibrium equations for the first dis-sociation step (Eq. 4) through that of the second disdis-sociation step (Eq. 5):
K1 K2
=
[HCO−3]2
[CO∗2] · [CO23−]. (6)
Equation (6) shows that K1/ K2 is not connected to the hydrogen ion concentration and is thus not affected by the choice of the pH scale. Hence it is suited as an indica-tor of the quality of the early dissociation constants de-termined by Buch (1945). We used the logarithmic nota-tion, log(K1/ K2), which is equivalent to pK1 – pK2, for
a comparison of the dissociation constants suggested by Buch (1945), Millero (2010) and Roy et al. (1993). The differences 1log(K1/ K2), referring to Millero (2010) and
Buch (1945) and Millero (2010) and Roy et al. (1993) indi-cated as M-B and M-R, respectively, are shown as a function of salinity in Fig. 2c.
At salinities > 7, M-R is less than 0.03, but the differences increase rapidly at lower salinities and amount to 0.06 and 0.10 already atS=5.4 andS=3.6, respectively. Such differ-ences in log(K1/ K2) are equivalent to a temperature change of 1◦C. The deviations of the Buch (1945) data from those of Millero (2010) (M-B in Fig. 2c) ranged below 0.10 at salinities below 20. This is a surprisingly small difference in view of the limited technical capabilities that were avail-able to Buch and his co-workers in the 20s and 30s of the last century.
When alkalinity is also used for the calculation of any vari-ables of the CO2system, the contributions of non-CO2acid–
base components to AT (Eq. 2), which are generally low, must be taken into account. This requires knowledge about the concentration of the individual acid–base pairs and about the corresponding dissociation constants. In the deep basins of the central Baltic Sea, ammonia and sulfide anions are re-leased during organic-matter mineralization at anoxic con-ditions (see Sect. 3.4.2). Both these constituents are strong proton acceptors forming mainly HS−and NH+4. Since their concentrations may be on the order of several tens and up to a few hundred µmol L−1(Nausch et al., 2008), respectively, they have a strong effect on alkalinity and pH. Therefore, any calculations concerning the CO2system at anoxic
con-ditions must account for the dissociation equilibria of H2
S-HS−(Millero et al., 1988) and NH+4-NH3(Clegg and
Whit-Figure 2.Dissociation constants(a)pK1and(b)pK2as a function
of salinity calculated according to Millero (2010) for three different temperatures: 0, 10 and 20◦C;(c)differences in log(K1/ K2) be-tween the dissociation constants obtained from Millero (2010) and Roy et al. (1993) (M-R, blue dots) and between Millero (2010) and Buch (1945) (M-B, purple dots) at different salinities.
field, 1995; Johansson and Wedborg, 1980). The concentra-tions of S2−at the pH of anoxic water are extremely small and can be neglected.
3.3 The central role of alkalinity
3.3.1 RegionalATvs.Sdistribution – consequences for pH distribution pattern
There are several different AT vs. S regimes in the Baltic
Sea. They reflect differentATconcentrations in the
respec-tive rivers, which can be deduced from extrapolation of re-gionalATvs.Srelationships to zero salinity. Low alkalinities
Figure 3.DifferentATvs.S regimes observed in the Baltic Sea
(modified after Beldowski et al., 2010).
shown by the AT vs. S plot for the Gulf of Riga (Fig. 3),
are rich in alkalinity. These differences are a consequence of the geological conditions and weathering processes in the re-spective catchment areas. As a result lower alkalinities and lower mean pH are observed in the Gulf of Bothnia and Fin-land, whereas higher mean alkalinities and thus somewhat higher pH are found in the Gulf of Riga and also in Gdánsk Bay (Kulinski et al., 2014; Beldowski et al., 2010; Hjalmars-son et al., 2008).
The central Baltic Sea acts as a mixing chamber for the different water masses, including water originating from the North Sea. This results in alkalinity in the surface wa-ter of the Baltic Proper (salinity around 7) of about 1600– 1700 µmol kg−1.
An important, but still not well investigated, aspect of the
AT supply to the Baltic Sea is theAT seasonality in river
water. AsATis one of the variables used in biogeochemical
models to study the CO2system, well-described spatial and
temporal variability in AT loads could improve the
charac-terization of the AT distribution in the Baltic Sea and thus
increase the accuracy of the modelled pH and pCO2. This
could be achieved by the evaluation of the AT monitoring data which are regularly collected by some Baltic Sea states within the framework of the HELCOM monitoring program. In some countries, such as Sweden, the monitoring data are publicly accessible; in others some limitations still exist.
ATcan also enter the Baltic Sea by submarine groundwa-ter discharge (SGD). The chemical composition of ground-water, as in river ground-water, depends to some extent on the ge-ological structure of the catchment through which the wa-ter flows. Thus, SGD enwa-tering the Baltic Sea along the continental part of the coast can be rich in AT.
Szym-czycha et al. (2014) noticed significant CT concentrations
(5400 µmol kg−1on average) in SGD seeping to the south-ern Baltic along the Polish coast. Although there might be
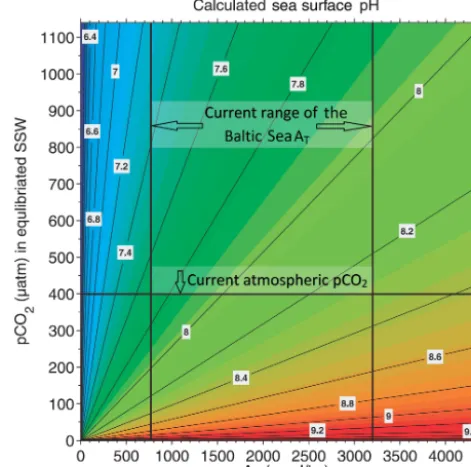
Figure 4.Distribution of pHtot as a function ofATand pCO2at
a salinity of 7.5 and temperature of 0◦C (modified after Omstedt et al., 2010). TheAT range represents findings by Beldowski et
al. (2010). SSW is an abbreviation for surface seawater.
some contribution from CO2to this highCT, it is very likely
that SGD can, at least locally, play an important role for the
ATbudget. However, direct measurements ofAT concentra-tions and loads in SGD have not been reported in the Baltic Sea so far.
At equilibrium with the atmospheric CO2,ATcontrolsCT
and thus pH. Hence, pH may be depicted as a function of
ATand pCO2. A sensitivity study performed by Omstedt et
al. (2010) indicates that the pH of the Baltic Sea surface wa-ter that is at equilibrium with the atmosphere (pCO2 of ca.
400 µatm at 0◦C) can vary between 7.7 and 8.3 depending on theAT (Fig. 4). This range is significantly higher than
that observed in the open ocean, whereAT oscillates only
in a narrow range: 2170–2460 µmol kg−1 (Riebesell et al., 2010). The reason for that is the high spatial variability in
AT in the surface Baltic Sea waters, from low AT (below 1000 µmol kg−1) observed in the Bothnian Bay to the AT -rich (more than 3000 µmol kg−1) estuaries of the large conti-nental rivers. The diagram presented in Fig. 4 also shows that higherAT reduces shifts in seawater pH caused by changes in pCO2.
3.3.2 Long-termATchanges – consequences for ocean acidification
in the atmospheric CO2(Bates et al., 2014). There is
there-fore reason to expect that the progression of ocean acidifica-tion can be assessed on the basis of CO2emission scenarios
and the modelling of the effect on the atmospheric CO2. It
also implies that changes in alkalinity will not occur in the future. On timescales of decades this may be a reasonable assumption for the oceans which react very slowly to inter-nal or exterinter-nal changes. However, the situation is different for the Baltic Sea, which is under the immediate influence of nat-ural and anthropogenic processes on land. The first hints of increasing alkalinity in the surface water of the central Baltic Sea were reported by Schneider et al. (2015), who argued that this may have considerably mitigated the acidification due to increasing atmospheric CO2. Müller et al. (2016) took
up this idea and performed a thorough and comprehensive statistical analysis of all alkalinity data that were available since the start of CO2research in the Baltic Sea at the
begin-ning of the last century. The authors focused on high-quality data measured after 1995 and detected a distinct AT trend
that showed a clear regional gradient. The highest trend was found in the Gulf of Bothnia (7.0 µmol kg−1yr−1), followed by 3.4 µmol kg−1yr−1in the central Baltic, whereas no trend could be detected in the Kattegat. Müller et al. (2016) es-timated that the changes in AT have reduced the
acidifica-tion effect in the central Baltic Sea by about 50 % and that the Gulf of Bothnia was not subjected at all to acidification during the last 20 years. Several reasons for the increasing
ATare discussed by Müller et al. (2016), but a major player could not be identified and, hence, it remains unclear whether the trend will continue in the future.
3.3.3 Effect of organic alkalinity
The Baltic Sea water contains 3–5 times more organic mat-ter than open-ocean wamat-ters. In the surface wamat-ter of the open Baltic Sea, concentrations of dissolved organic car-bon (DOC) range from about 260 to about 480 µmol C L−1, while those in the surface water (top 100 m) of the At-lantic Ocean are much lower and range between 50 and 80 µmol C L−1(Hoikkala et al., 2015; Carlson et al., 2010). This is a result of both high inputs of terrestrial organic mat-ter and eutrophication driven by nutrient supply from land (Hoikkala et al., 2015; Kuli´nski and Pempkowiak, 2011; Kuli´nski et al., 2011). Organic substances contain functional groups, some of which (carboxylic, phenolic, amines) have an acidic character and can dissociate in seawater, releas-ing protons (H+). This contributes to pH decrease. How-ever, as most of these groups are believed to act as weak acids (pKa> 4.5), their dissociation releases the equivalent
of organic acids, which are strong bases. This, according to Eq. (2), causes no change inATconcentration since an
equiv-alent amount of protons have been released. It affects the in-ternal structure ofATby changing the contributions of
differ-entATcomponents according to their individual dissociation
constants (Cai et al., 1998; Hunt et al., 2011; Kuli´nski et al.,
2014). The lower the pKaof an organic acid added to the sys-tem, the greater are the shifts in the internalATdistribution. As a consequence bases forming the acid–base system are partially protonated and their concentration decreases while the concentration of the corresponding undissociated acid is increasing. In the case of the carbonate alkalinity, this means a reduction in CO23−and an increase in H2CO3and thus the
pCO2.
Kuli´nski et al. (2014) estimated the organic alkalinity (Aorg) in the Baltic Sea as an excess alkalinity calculated
from the difference between measured AT and that
cal-culated from CT and pH or pCO2. They found Aorg of
25–35 µmol kg−1in the surface Baltic Sea water (from the Arkona Basin to the Bothnian Bay) without any clear spatial distribution pattern. ThisAorg contribution amounted from 1.5 to 3.5 % of the measuredAT values. Even higher val-ues of more than 50 µmol kg−1 were found by Hammer et
al. (2017) in the Baltic Sea surface mixed layer during the spring phytoplankton bloom. They reported also thatAorg
decreases with depth and approaches 0 below the permanent halocline due to pH decrease.
In sensitivity studies Kuli´nski et al. (2014) showed for the Baltic Sea that calculations concerning the CO2system that
use measuredATmay lead to significant errors ifAorgis
ig-nored. Highest deviations between calculated and observed values were found whenATwas used together withCT for
computations of pCO2and pH. The pCO2values obtained in
that way were 27–56 % lower than the measured ones, while pH was overestimated by more than 0.4 units. These results are especially important as this combination (ATandCT) is used in biogeochemical models (Edman and Omstedt, 2013; Kuznetsov and Neumann, 2013; Omstedt et al., 2009, 2012) because they are conservative variables. This means that they are independent of pressure and temperature and follow the law of conservation of mass during mixing, which are prereq-uisites for variables transported in models. The first attempts to include anAorgparameterization in biogeochemical
mod-els were made by Gustafsson et al. (2015) and Omstedt et al. (2015). However, the sensitivity of the models with regard to the inclusion/negligence ofAorghas not yet been reported.
The source of the calculation errors related to ignoring
Aorg is due to the fact that measurements include all inor-ganic and orinor-ganic contributors, while subsequent calcula-tions using the standard chemicalATmodel and respective software interpret the measuredATonly as inorganic alkalin-ity. Including organic substances into theATmodel is, how-ever, challenging as there are a number of organic substances having acidic functional groups, and, according to theAT
definition, for each of them the information on concentration and dissociation constants must be available. Accounting for
Aorgin the chemicalATmodel is less important for oceanic
use one single bulk dissociation constant, pKDOM, and relate
Aorg to the concentration of DOC, a commonly measured parameter. According to their studies, slightly corrected by Ulfsbo et al. (2015), pKDOM in the Baltic Sea amounts to
7.34. They also estimated experimentally that 12 % of DOC acts as a carrier for acidic functional groups in the Baltic Sea DOM. The model studies by Ulfsbo et al. (2015) showed that this experimentally derived share fits the share estimated from the hypothetical structure of the fulvic acids. They also suggested that the method proposed by Kuli´nski et al. (2014) is the best available approach for representing organic alka-linity in biogeochemical models at the current state of knowl-edge. They also showed that organic matter (as represented by the fulvic acids) also contains some functional groups having pKa already below 4.5. According to the definition (Dickson, 1981), they should be considered strong acids. In experimental studies Hammer et al. (2017) also found that humic and/or fulvic substances are more acidic than the bulk DOM naturally occurring in the Baltic Sea. This may also be a source of uncertainty in theATmeasurements as the
deter-mination of the titration end-point requires the titration of the samples through this pH region.
3.3.4 Role of borate alkalinity
The carbonate system plays a central role in the marine acid– base system. Thus, studies on seawater pH and buffering ca-pacity usually focus on the carbon species. Less attention is paid to boron, though borates are, after bicarbonates and car-bonates, the third most abundant constituent of seawaterAT
(Eq. 2). Boron exists in seawater in the form of weak boric acid, B(OH)3, and the anion, B(OH)−4. The high pKa (8.60
at salinity 35 and temperature 25◦C) means that at a sea-water pH of about 8, the undissociated boric acid predomi-nates. The boron concentration,BT, in seawater is
approxi-mated as a function of salinity or, for the historical data, as a function of chlorinity (S=1.80655·Cl). First measurements of boron concentrations in the Baltic Sea were reported by Buch (1945), who found that BT [mg kg−1]=0.133·S.
This finding was confirmed recently by Lee et al. (2010) for oceanic waters. Another relationship linking BT andS
and often used in acid–base system studies is that by Upp-ström (1974), who reported that BT [mg kg−1]=0.128·S. All these formulas suggest a fixedBT/Sratio, which is only the case if the river water that enters the Baltic Sea contains no boron. However, the studies by Kremling (1970, 1972) in-dicated that this is not the case and that aBT concentration anomaly exists in the Baltic Sea, where the experimentally determined BT vs.S relationship yielded a river water BT
(anomaly term) of 0.15–0.20 mg kg−1atS=0. This anomaly is not included in the chemicalATmodel commonly used for
numerical simulations of the CO2system and, similar to the
effects of ignoringAorg, may lead to wrong conclusions. This
can be especially critical at low salinities, where the effect of the anomaly is the largest.
3.4 Modulation of the acid–base system by organic-matter production/mineralization (concurrentATandCTchanges) 3.4.1 Biomass production
In the case of pH changes referring to equilibrium with the atmosphere, it may be meaningful to consider the pH at a given alkalinity as a function of pCO2 because the
atmo-spheric CO2is then the only driver for any pH changes.
How-ever, when assessing pH changes as the consequence of in-ternal biogeochemical transformations, it is more appropri-ate to considerATandCTas the controls for pH and pCO2.
Biomass production primarily altersCTbecause
phytoplank-ton (but also other plants) consume CO2in the course of
pho-tosynthesis (Fig. 5). As a consequence it increases the pH and lowers the pCO2in the upper water layers and causes a
pCO2disequilibrium between seawater and the atmosphere.
This leads to CO2uptake by the seawater and thus
counter-acts the effect of biomass production and dampens the pH in-crease. However, the CO2exchange through the air–sea
inter-face is much slower than the effects of biological processes. Therefore, the Baltic Sea water is in almost permanent pCO2
disequilibrium with the atmosphere throughout the year. In spring and summer, seawater is undersaturated with respect to atmospheric CO2 with two characteristic pCO2 minima
and two pH maxima (Fig. 5), which reflect the spring bloom and the midsummer nitrogen fixation period. In autumn and winter the Baltic Sea surface water pCO2increases over the
atmospheric values as a consequence of less active produc-tion in the upper water column and transport of deeper CO2
-enriched water to the surface by mixing (Fig. 5; Schneider, 2011).
Another way in which biomass production influences sea-water pH and pCO2is related to nitrate consumption. As
phy-toplankton assimilate nitrate for growth, an equivalent of H+ is also transported to the cells to keep the charge balance neutral. According to Eq. (2) this increases the seawaterAT
and thus raises the pH during biomass production (Brewer and Goldman, 1976). This assimilation also decreases the pCO2and therefore reinforces the drop in pCO2by biomass
production. Some small AT changes can be also induced
by phosphate consumption. However, due to low phosphate concentration the effect is negligible (Wolf-Gladrow et al., 2007).
Biological production may also consume CO23− ions in the calcification processes. This causes anATreduction and in consequence a pCO2 increase and also a pH decrease.
However, this mechanism has been recognized as less im-portant in the Baltic Sea. According to studies by Tyrrell et al. (2008), the Baltic Sea surface water is undersaturated in winter with respect to both aragonite and calcite, which are biogenic modifications of CaCO3. This possibly prevents the
Figure 5.Typical seasonality of pCO2in surface water (blue line)
and the atmosphere (green line) in the Eastern Gotland Sea modified after Schneider (2011) and presented together with pH calculated from the shown pCO2data and the meanATvalue.
3.4.2 Remineralization
In contrast to biomass production, CO2 is released during
the remineralization processes and causes an increase inCT.
Consequently, this leads to a pH decrease and pCO2increase.
Some fraction of organic matter produced in situ undergoes remineralization in the upper water layers. Particulate or-ganic matter (POM) may be mineralized directly or via the prior release of DOM. In the Baltic Sea terrigenous organic matter entering the sea from rivers constitutes an important part of the organic matter. Kuli´nski and Pempkowiak (2011) reported that the Baltic Sea receives 340 Gmol of organic carbon from land annually. The model studies by Gustafs-son et al. (2014a) suggested that as much as 39.5 % of ter-rigenous organic carbon that enters the Baltic Sea under-goes mineralization without distinguishing between miner-alization pathways. This makes it difficult to estimate all the consequences of that terrestrial organic carbon loss for the Baltic Sea acid–base system. The incubation experiments performed by Kuli´nski et al. (2016) indicated that ca. 20 % of terrestrial dissolved organic carbon and 34 % of DOC present in the Baltic Sea is bioavailable. It is important to mention here that the latter result likely refers to the mixture of terres-trial and marine DOC.
Whereas theAT in surface water is mainly controlled by the mixing of different water masses, the deep-waterAT dis-tribution additionally depends on the organic-matter trans-formations by various redox processes (Brenner et al., 2016; Krumins et al., 2013; Thomas et al., 2009; Schulz and Zabel, 2006). A certain fraction of the organic matter produced in the euphotic zone is exported to deeper water layers and to surface sediments, where it undergoes mineralization, pro-duces CO2and changes the alkalinity. The change inAT
de-pends on the oxidant that is required for the mineralization and may cover a wide range. Therefore, it is not possible to predict the change in pH or pCO2during the mineralization
process without knowledge of the oxidant. In the presence of oxygen, mineralization takes place according to Eq. (7),
which reverses the bulk photosynthesis reaction. However, in sediments and in deep-water layers of some basins of the cen-tral Baltic, where longer periods (years) of stagnation occur, oxygen may be entirely depleted. Organic matter can then be mineralized in a certain thermodynamically controlled se-quence by other oxidants (Schulz and Zabel, 2006). First, manganese dioxide takes over the role of oxygen (Eq. 8), followed by denitrification where nitrate acts as an oxidant (Eq. 9). After nitrate is consumed, the mineralization process may be continued by iron (III) oxide (Eq. 10) before sulfate oxidizes the organic matter and generates hydrogen sulfide (Eq. 11). In the Baltic Sea these processes may take place in the water column where a pelagic redoxcline (an interface be-tween oxic and anoxic conditions) can develop during longer periods of stagnation. Only the final mineralization, that is an internal oxidation and generates methane (methanogene-sis, Eq. 12) after the sulfate concentration has approached 0, is confined to deeper sediment layers only. Except for oxic mineralization, all other processes are connected with a si-multaneousATincrease caused either by the release of strong
bases (S2−) or by the consumption of H+(see Eq. 2) (Ulfsbo et al., 2011; Schneider et al., 2015; Lukawska-Matuszewska, 2016). The change inAT(1AT) for different mineralization
pathways is given in moles AT per 106 moles of released
CO2 (Eqs. 7–12). It shows large differences and is highest
when the insoluble oxides of iron (III) and manganese (IV) are reduced during the mineralization process. As a conse-quence of the higherAT level, the pCO2 increase and pH
decrease by increasingCTduring the mineralization is mit-igated or may even be reversed. In the Eastern Gotland Sea these mechanisms stabilize the pH in the deep, anoxic water layers at a level of about 7 (Hammer et al., 2017).
(CH2O)106(NH3)16(H3PO4)+138O2
→106CO2+16H++16NO−3 +122H2O+H3PO4 (7)
Oxic mineralization,1AT= −16.
(CH2O)106(NH3)16(H3PO4)+236MnO2+472H+
→236Mn2++106CO2+8N2+366H2O+H3PO4. (8)
Manganese reduction,1AT= +472.
(CH2O)106(NH3)16(H3PO4)+84.8H++84.8NO−3
→106CO2+42.4N2+16NH3+148.4H2O+H3PO4. (9)
Denitrification,1AT= +100.8.
(CH2O)106(NH3)16(H3PO4)+212Fe2O3+848H+
→424Fe2++106CO2+16NH3+530H2O+H3PO4. (10)
(CH2O)106(NH3)16(H3PO4)+53SO24−
→106CO2+16NH3+53S2−+106H2O+H3PO4. (11)
Sulfate reduction,1AT= +122.
(CH2O)106(NH3)16(H3PO4)
→53CO2+53CH4+16NH3+H3PO4. (12)
Methanogenesis,1AT= +16.
Generally, benthic processes linked to early diagenesis of organic matter can be an important source of AT to the
water column (Brenner et al., 2016). This corresponds to the findings by Gustafsson et al. (2014b), who, in a model study, found that external sinks and sources of AT in the Baltic
Sea are imbalanced and cannot reproduce the observedAT
inventory and that an internal AT source must exist in the
Baltic Sea. However, it must be taken into account that alkalinity released from sediments as sulfide or ammonia only influences the acid–base system locally. Upon contact with oxic water, most of the AT-generating processes – except for denitrification – are reversed and do not constitute a permanent AT source. Some minor increase in AT can be also expected due to the burial of iron (II) minerals like pyrite or vivianite (Reed et al., 2016).
4 Challenges for future research
General knowledge of the marine acid–base system has been gained mainly from oceanic research. It has been integrated and documented in the form of a guide (Dickson et al., 2007) and included in different software packages (Orr et al., 2015), which allow for computations of two out of the four acid– base system parameters (pCO2, pH,AT,CT), when the other
two are known (e.g. by measurements). Although this works nicely for the open-ocean waters, problems appear when that knowledge is used for studying the acid–base-system-related processes in coastal and shelf seas. This uncovers research gaps and limitations but also define challenges for marine biogeochemists working in these regions.
In this context the Baltic Sea can be considered a model experimental field, where strong horizontal and vertical salinity gradients, permanent stratification of the water col-umn, eutrophication, high organic-matter concentrations, and high anthropogenic pressure make the acid–base system even more entangled. The challenges are related to analytical methods, interpretation of the data and parameterization of the acid–base-system-related processes for use in numerical models. Great effort has recently been made to adapt spec-trophotometric pH measurements based on m-cresol pur-ple to Baltic Sea conditions. This was done by Hammer et al. (2014) and was recently improved within the framework of the BONUS PINBAL project. Further progress can be ex-pected if pH reference materials for brackish water are made
available in the future. For the pCO2measurements the
state-of-the-art method that is based on measuring the CO2
con-tent in air equilibrated with the seawater is commonly used (e.g. Schneider et al., 2014). Due to a relatively long response time, this method may, however, not be fast enough to resolve steep horizontal pCO2 gradients in the vicinities of river
mouths. The development of accurate and precise sensors for pCO2, like optodes, could improve our understanding of the
CO2system in the transition area from the coast to the open
sea. Additionally, it would facilitate pCO2measurements in
discrete samples, which are highly desired for investigations of the organic-matter mineralization processes in the water column but difficult to obtain with common underway mea-surement techniques. The determination ofAT by titration with an acid (HCl) allows a high accuracy (±2 µmol kg−1) for ocean water. This is difficult to achieve for Baltic Sea wa-ter because the detection of the endpoint of theATtitration is more difficult due to the influence of organic acid–base constituents. The studies by Ulfsbo et al. (2015) showed that fulvic and humic acids, substances commonly found in the Baltic Sea, have relatively high concentrations of acid–base constituents, which have pKavalues close to the pKaof
car-bonic acid and may thus impede the correct detection of the titration endpoint. CT measurements are less critical since
reference materials exist and the analytical procedure is rel-atively straightforward. However, the development of high-accuracy underway methods forCT(but alsoAT) would im-prove the horizontal coverage of the data.
Interpretations of the acid–base system data require an appropriate parameterization of the related processes and chemical reactions. With regard to the Baltic Sea some pecu-liarities of the composition of the acid–base system must be taken into account, which are neglectable in ocean waters. An example is the influence of DOM on the acid–base system. In the oceans, it is ignored due to low DOM concentrations, but in the Baltic SeaAorgbecomes a noticeable component
ofAT (Kuli´nski et al., 2014). The challenge remains to
in-clude the contribution by DOM in the chemicalAT model.
The approach suggested by Kuli´nski et al. (2014) to use the so-called bulk dissociation constant,KDOM, is only a first
ap-proximation, asKDOMhas no real thermodynamic meaning.
It also does not allow for distinguishing the influence of indi-vidual substances. Respective improvements would require substantial progress in analytical techniques, as the charac-terization of the structure and composition of DOM is still far from being satisfactory (Nebbioso and Piccolo, 2013). Problems also arise due to the ion anomalies observed in the Baltic Sea (Kremling, 1970, 1972) that are not taken into ac-count in the AT model. An example is boron, whose
con-centration is usually approximated by the assumption of a constant boron/salinity ratio. However, the function link-ing both these parameters does not account for river water as a source of boron. Furthermore, common software for CO2
base reactions: H2S-HS−-S2−and NH+4-NH3, which require
consideration in computational models. All these shortcom-ings may cause uncertainties in any calculations of the CO2
system including those in biogeochemical models whenAT
is used as a controlling variable. It is also recommended to perform sensitivity studies in order to estimate the quantita-tive importance of inadequate chemical characterization of
AT.
Furthermore, we promote the implementation of the acid– base system (or marine CO2 system) into biogeochemical
models. This includes the simulation of surface water CO2
partial pressure, pCO2. The pCO2is an ideal validation
vari-able because on the one hand, it can easily be measured with high spatiotemporal resolution (e.g. on Voluntary Ob-serving Ships, VOSs) and, on the other hand, it reflects the biogeochemical transformations such as biomass production. Hence, agreement between simulated and measured pCO2
data gives an indication of the quality of the biogeochemi-cal process parameterization. Or, vice versa, unsatisfactory agreement gives reason to rethink the description of the re-spective processes in the model.
The latter aspect was the focus of several model studies which initially failed to reproduce the observed pCO2
draw-down during spring and summer (Fig. 5). This indicated that the traditional parameterization of the biomass production that is based on the Redfield (1963) C / N / P ratios and on nutrient concentrations at the start of the productive pe-riod did not reflect the reality. Omstedt et al. (2009) solved the problem by including a fractional nutrient release into their model. This meant that nutrients that have been used for production are partly released from the POM and reused for new production. In another study Kuznetsov et al. (2011) introduced an additional cyanobacteria group and flexible
C / N / P ratios into their model in order to achieve ap-proximate agreement between the simulated and measured pCO2. A further study by Gustafsson et al. (2014a)
inves-tigated the changes in the simulated CO2 air–sea flux
af-ter including organic alkalinity and changes in exaf-ternal in-puts of carbon, alkalinity and nutrients. Modelling the CO2
system was also used to simulate the vertical distribution of total CO2 and alkalinity in stagnant waters of the deep
basins (Edman and Omstedt, 2013) and to assess the im-portance of internal alkalinity generation (Gustafsson et al., 2014b). Finally, model calculations were used to estimate fu-ture changes in the Baltic Sea CO2system and in particular in
the development of the ocean acidification effect (Omstedt et al., 2012; Kuznetzov and Neumann, 2013). Both simulations indicated that the increasing atmospheric CO2 will mainly
control long-term changes in pH, of course, not taking into account the recently reported current increase in alkalinity (see Chap. 3.3.2; Müller et al., 2016).
5 Summary and conclusions
With our review we have proposed that the Baltic Sea acid– base system cannot be explained by dissolved CO2 and a
minor contribution of boric acid. Whereas acid–base com-ponents other than CO2and borate may be ignored in ocean
waters, this is not the case in the Baltic Sea and, presum-ably, other marginal and semi-enclosed seas, which in a sim-ilar way are strongly impacted by high biomass production and natural and anthropogenic processes in connected catch-ment areas as well. The complexity of the Baltic Sea acid– base system is displayed in the formulation of the alkalin-ity (Eq. 2), which is the central variable for the character-ization of the acid–base properties of seawater. The pecu-liarities of the Baltic Sea alkalinity system are either caused by specific internal processes related to the intense produc-tion/mineralization of organic matter or to the immediate ef-fect of riverine input of acidic substances. This riverine in-put refers mostly to dissolved organic matter, which may strongly affect the composition of the alkalinity in the Baltic Sea surface water (Kuli´nski et al., 2014), but also to boric acid (borate), which in ocean water is linked to salinity by a constant ratio but may show distinct deviations from this ra-tio in some of the Baltic Sea estuaries because of boron input by river water.
Internal biogeochemical processes such as organic-matter production or mineralization also have the potential to affect the acid–base system in the Baltic Sea. Alkalinity changes by organic-matter production caused by the removal of H+ dur-ing the uptake of nitrate are of minor importance. This may be different if the production is associated with calcification, which reduces the alkalinity, but the abundance of calcifying plankton in the Baltic Sea is restricted to the high-salinity Kattegat region. Although the effect of organic-matter pro-duction on alkalinity is minor, it is the major control for the seasonal modulation of the acid–base properties such as pH and pCO2.
In contrast, organic-matter mineralization taking place at anoxic conditions in the Baltic Sea deep basins causes changes in the acid–base system which are specific for ma-rine systems with a pelagic redoxcline. Anoxic mineraliza-tion of organic matter generates large amounts of alkalinity by the formation of sulfide ions and the release of ammonia. This reduces the increase in the pCO2in the deep water and
Our compilation of the major features of the Baltic Sea acid–base system indicates that an exact quantitative treat-ment of its properties is difficult to achieve. This refers to both the biogeochemical modelling and the interpretation of measured alkalinity in terms of the calculation of individual alkalinity contributions. An example is the calculation of the carbonate alkalinity that is necessary for the full character-ization of the CO2 system based on measurements of
alka-linity together with another variable. This requires knowl-edge of the dissociation constants and the determination of the total concentrations of the individual compounds with acid–base properties. Regarding inorganic alkalinity contri-butions, it may be realistic to obtain this information. But in view of our limited knowledge concerning the composition of the dissolved organic matter, it is currently impossible to specify and characterize the contributions of individual or-ganic acid–base compounds to the alkalinity. Hence we con-clude that this is one of the greatest challenges for more ad-equate comprehensive physico-chemical characterization of the acid–base system in the Baltic Sea and likely in other coastal seas. Another important limitation, especially for the biogeochemical modelling, is also an insufficient knowledge of the short- and long-term development of alkalinity loads from land caused by processes occurring in the catchment.
Competing interests. The authors declare that they have no con-flict of interest.
Acknowledgements. The study was completed thanks to fund-ing provided by the National Science Centre, Poland, grant nos. 2015/19/B/ST10/02120 and 2014/13/D/ST10/01885. Significant financial support was provided also by BONUS and the Polish Na-tional Centre for Research and Development – sponsors of BONUS PINBAL project (grant no. BONUS-INNO-2012-03/2014). The contribution of B. Schneider to this study was supported by the Foundation for Polish Science within the Alexander von Humboldt Polish Honorary Research Scholarship. This study comprises a part of the Baltic Earth – Earth System Science for the Baltic Sea Region. We thank both anonymous reviewers for insightful and constructive comments and suggestions.
Edited by: Marcus Reckermann Reviewed by: two anonymous referees
References
Bates, N. R., Astor, Y. M., Church, M. J., Currie, K., Dore, J. E., Gonzalez-Davila, M., Lorenzoni, L., Muller-Karger, F. E., Olafsson, J., and Santana-Casiano, J. M.: A time-series view of changing surface ocean chemistry due to ocean uptake of anthro-pogenic CO2 and ocean acidification, Oceanography, 27, 126– 141, 2014.
Beldowski, J., Loeffler, A., Schneider, B., and Joensuu, L.: Distribu-tion and biogeochemical control of total CO2and total alkalinity
in the Baltic Sea, J. Marine Syst., 81, 252–259, 2010.
Brenner, H., Braeckman, U., Le Guitton, M., and Meysman, F. J. R.: The impact of sedimentary alkalinity release on the water column CO2system in the North Sea, Biogeosciences, 13, 841–
863, https://doi.org/10.5194/bg-13-841-2016, 2016.
Brewer, P. G. and Goldman, J. C.: Alkalinity changes generated by phytoplankton growth, Limnol. Oceanogr., 21, 108–117, 1976. Buch, K.: Kolsyrejamvikten i Baltiska Havet, Fennia, 68, 5, 29–81,
1945.
Cai, W. J., Wang, Y. C., and Hodson, R. E.: Acid–base properties of dissolved organic matter in the estuarine waters of Georgia, USA, Geochim. Cosmochim. Ac., 62, 473–483, 1998.
Caldeira, K. and Wickett, M. E.: Anthropogenic carbon and ocean pH, Nature, 425, 365–365, 2003.
Carlson, C. A., Hansell, D. A., Nelson, N. B., Siegel, D. A., Sme-thie, W. M., Khatiwala, S., Meyers, M. M., and Halewood, E.: Dissolved organic carbon export and subsequent remineraliza-tion in the mesopelagic and bathypelagic realms of the North At-lantic basin, Deep-Sea Res. II, 57, 1433–1445, 2010.
Clegg, S. L. and Whitfield, M.: Chemical model of seawater in-cluding dissolved ammonia and the stoichiometric dissociation constant of ammonia in estuarine water and seawater from−2 to 40◦C, Geochem. Cosmochim. Ac., 59, 2403–2421, 1995. DelValls, T. A. and Dickson, A. G.: The pH of buffers based on
2-amino-2-hydroxymethyl-1,3-propanediol (‘tris’) in synthetic sea water, Deep-Sea Res. Part I, 45, 1541–1554, 1998.
Dickson, A. G.: An exact definition of total alkalinity and a proce-dure for the estimation of alkalinity and total inorganic carbon from titration data, Deep-Sea Res. I, 28, 609–623, 1981. Dickson, A. G.: pH scales and proton-transfer reactions in saline
media such as sea water, Geochim. Cosmochim. Ac., 48, 2299– 2308, 1984.
Dickson, A. G., Sabine, C. L., and Christian, J. R.: Guide to best practices for ocean CO2 measurements, PICES Special
Publi-cation 3, North Pacific Marine Science Organization, Sidney, British Columbia, 191 pp., 2007.
Edman, M. and Omstedt, A.: Modeling the dissolved CO2system
in the redox environment of the Baltic Sea, Limnol. Oceanogr., 58, 74–92, https://doi.org/10.4319/lo.2013.58.1.0074, 2013. Emerson, S. R. and Hedges, J. I. (Eds.): Chemical
Oceanogra-phy and the Marine Carbon Cycle, Cambridge University Press, Cambridge, 470 pp., 2008.
Gustafsson, E., Deutsch, B., Gustafsson, B. G., Humborg, C., and Morth, C. M.: Carbon cycling in the Baltic Sea – the fate of al-lochthonous organic carbon and its impact on air-sea CO2
ex-change, J. Marine Syst., 129, 289–302, 2014a.
Gustafsson, E., Wällstedt, T., Humborg, Ch., Mörth, C. M., and Gustafsson, B. G.: External total alkalinity loads versus internal generation: The influence of nonriverine alkalinity sources in the Baltic Sea, Global Biogeochem. Cy., 28, 1358–1370, 2014b. Gustafsson, E., Omstedt, A., and Gustafsson, B. G.: The air-water
CO2exchange of a coastal sea-A sensitivity study on factors that
influence the absorption and outgassing of CO2in the Baltic Sea,
J. Geophys. Res.-Ocean., 120, 5342–5357, 2015.
at environmental conditions in the Baltic Sea, Estuar. Coast. Shelf S., 146, 24–32, 2014.
Hammer, K., Schneider, B., Kuli´nski, K., and Schulz-Bull, D.: Acid-base properties of Baltic Sea dissolved organic matter, J. Marine Syst., 173, 114–121, 2017.
HELCOM: Eutrophication in the Baltic Sea, Balt, Sea Environ. Proc., 115 pp., 2009.
Hernandez-Ayon, J. M., Zirino, A., Dickson, A. G., Camiro-Vargas, T., and Valenzuela-Espinoza, E.: Estimating the contribution of organic bases from microalgae to the titration alkalinity in coastal seawaters, Limnol. Oceanogr.-Meth., 5, 225–232, 2007. Hjalmarsson, S., Wesslander, K., Anderson, L. G., Omstedt, A.,
Perttila, M., and Mintrop, L.: Distribution, long-term develop-ment and mass balance calculation of total alkalinity in the Baltic Sea, Cont. Shelf Res., 28, 593–601, 2008.
Hoikkala, L., Kortelainen, P., Soinne, H., and Kuosa, H.: Dissolved organic matter in the Baltic Sea, J. Marine Syst., 142, 47–61, 2015.
Hunt, C. W., Salisbury, J. E., and Vandemark, D.: Contribution of non-carbonate anions to total alkalinity and overestimation of pCO2 in New England and New Brunswick rivers,
Bio-geosciences, 8, 3069–3076, https://doi.org/10.5194/bg-8-3069-2011, 2011.
Johansson, O. and Wedborg, M.: The Ammonia-Ammonium equi-librium in sea water at temperatures between 5–25◦C, J. Solution Chem., 9, 37–44, 1980.
Koeve, W. and Oschlies, A.: Potential impact of DOM ac-cumulation on fCO2 and carbonate ion computations in ocean acidification experiments, Biogeosciences, 9, 3787–3798, https://doi.org/10.5194/bg-9-3787-2012, 2012.
Kremling, K.: Untersuchungen über die chemische Zusammenset-zung des Meerwassers aus der Ostsee II, Frühjahr 1967–Frühjahr 1968, Kiel Meeresforsch., 26, 1–20, 1970.
Kremling, K.: Untersuchungen über die chemische Zusammenset-zung des Meerwassers aus der Ostsee III, Frühjahr 1969–Herbst 1970, Kiel Meeresforsch., 27, 99–118, 1972.
Krumins, V., Gehlen, M., Arndt, S., Van Cappellen, P., and Reg-nier, P.: Dissolved inorganic carbon and alkalinity fluxes from coastal marine sediments: model estimates for different shelf en-vironments and sensitivity to global change, Biogeosciences, 10, 371–398, https://doi.org/10.5194/bg-10-371-2013, 2013. Kuli´nski, K. and Pempkowiak, J.: The carbon budget of the Baltic
Sea, Biogeosciences, 8, 3219-3230, https://doi.org/10.5194/bg-8-3219-2011, 2011.
Kuli´nski, K., She, J., and Pempkowiak, J.: Short and medium term dynamics of the carbon exchange between the Baltic Sea and the North Sea, Cont. Shelf Res., 31, 1611–1619, 2011.
Kuli´nski, K., Schneider, B., Hammer, K., Machulik, U., and Schulz-Bull, D.: The influence of dissolved organic matter on the acid-base system of the Baltic Sea, J. Marine Syst., 132, 106–115, 2014.
Kuli´nski, K., Hammer, K., Schneider, B., and Schulz-Bull, D.: Rem-ineralization of terrestrial dissolved organic carbon in the Baltic Sea, Mar. Chem., 181, 10–17, 2016.
Kuznetsov, I., Neumann, T., Schneider, B., and Yakushev, E.: Pro-cesses regulating pCO2in the surface waters of the central
east-ern Gotland Sea: A model study, Oceanologia, 53, 745–770, 2011.
Kuznetsov, I. and Neumann T.: Simulation of carbon dynamics in the Baltic Sea with a 3D model, J. Marine Syst., 111–112, 167– 174, 2013.
Lass, H.-U. and Matthäus, W.: General Oceanography of the Baltic Sea, in: State and Evolution of the Baltic Sea, 1952–2005: De-tailed 50-Year Survey of Meteorology and Climate, Physics, Chemistry, Biology and Marine Environment, edited by: Feis-tel, R., Nausch, G., and Wasmund, N., John Wiley & Sons, Inc., USA, 5–43, 2008.
Le Quéré, C., Andrew, R. M., Canadell, J. G., Sitch, S., Kors-bakken, J. I., Peters, G. P., Manning, A. C., Boden, T. A., Tans, P. P., Houghton, R. A., Keeling, R. F., Alin, S., Andrews, O. D., Anthoni, P., Barbero, L., Bopp, L., Chevallier, F., Chini, L. P., Ciais, P., Currie, K., Delire, Ch., Doney, S. C., Friedlingstein, P., Gkritzalis, T., Harris, I., Hauck, J., Haverd, V., Hoppema, M., Goldewijk, K. K., Jain, A. K., Kato, E., Körtzinger, A., Land-schützer, P., Lefèvre, N., Lenton, A., Lienert, S., Lombardozzi, D., Melton, J. R., Metzl, N., Millero, F., Monteiro, P. M. S., Munro, D. R., Nabel, J. E. M. S., Nakaoka, S., O’Brien, K., Olsen, A., Omar, A. M., Ono, T., Pierrot, D., Poulter, B., Rö-denbeck, Ch., Salisbury, J., Schuster, U., Schwinger, J., Séférian, R., Skjelvan, I., Stocker, B. D., Sutton, A. J., Takahashi, T., Tian, H., Tilbrook, B., van der Laan-Luijkx, I. T., van der Werf, G. R., Viovy, N., Walker, A. P., Wiltshire, A. J., and Zaehle S.: Global Carbon Budget 2016, Earth Syst. Sci. Data, 8, 605–649, https://doi.org/10.5194/essd-8-605-2016, 2016.
Lee, K., Kim, T. W., Byrne, R. H., Millero, F. J., Feely, R. A., and Liu, Y. M.: The universal ratio of boron to chlorinity for the North Pacific and North Atlantic oceans, Geochim. Cosmochim. Ac., 74, 1801–1811, 2010.
Lukawska-Matuszewska, K.: Contribution of non-carbonate inor-ganic and orinor-ganic alkalinity to total measured alkalinity in pore waters in marine sediments (Gulf of Gdansk, S-E Baltic Sea), Mar. Chem., 186, 211–220, 2016.
Millero, F. J.: Carbonate constants for estuarine waters, Mar. Fresh-water Res., 61, 139–142, 2010.
Millero, F. J., Plese, T., and Fernandez, M.: The dissociation of hy-drogen sulfide in seawater (Note), Limnol. Oceanogr., 33, 269– 274, 1988.
Millero, F. J., Graham, T. B., Huang, F., Bustos-Serrano, H., and Pierrot, L. D.: Dissociation constants of carbonic acid in seawater as a function of salinity and temperature, Mar. Chem., 100, 80– 94, 2006.
Mosley, L. M., Husheer, S. L. G., and Hunter, K. A., Spectropho-tometric pH measurement in estuaries using thymol blue and m-cresol purple, Mar. Chem., 91, 175–186, 2004.
MSFD: Directive 2008/56/EC of the European Parliament and of the Council (Marine Strategy Framework Directive), EUR-Lex – 32008L0056 – EN, available at: http://data.europa.eu/eli/dir/ 2008/56/oj, 2008.
Müller, J. D., Schneider, B., and Rehder, G.: Long-term alkalinity trends in the Baltic Sea and their implications for CO2-induced
acidification, Limnol. Oceanogr., 61, 1984–2002, 2016. Nausch, G., Nehring, D., and Nagel, K.: Nutrients Concentrations,
Nebbioso, A. and Piccolo, A.: Molecular characterization of dis-solved organic matter (DOM): a critical review, Anal. Bioanal. Chem, 405, 109–124, 2013.
Omstedt, A., Gustafsson, E., and Wesslander, K.: Modelling the up-take and release of carbon dioxide in the Baltic Sea surface water, Cont. Shelf Res., 29, 870–885, 2009.
Omstedt, A., Edman, M., Anderson, L. G., and Laudon H.: Factors influencing the acid–base (pH) balance in the Baltic Sea: a sen-sitivity analysis, Tellus B, 62, 280–295, 2010.
Omstedt, A., Edman, M., Claremar, B., Frodin, P., Gustafsson, E., Humborg, C., Hagg, H., Morth, M., Rutgersson, A., Schurgers, G., Smith, B., Wallstedt T., and Yurova, A.: Future changes in the Baltic Sea acid–base (pH) and oxygen balances, Tellus B, 64, 19586, https://doi.org/10.3402/tellusb.v64i0.19586, 2012. Omstedt, A., Edman, M., Claremar, B., Rutgersson, A., Modelling
the contributions to marine acidification from deposited SOx, NOx, and NHx in the Baltic Sea: Past and present situations, Cont. Shelf Res., 111, 234–249, 2015.
Orr, J. C., Epitalon, J.-M., and Gattuso, J.-P.: Comparison of ten packages that compute ocean carbonate chemistry, Biogeo-sciences, 12, 1483–1510, https://doi.org/10.5194/bg-12-1483-2015, 2015.
Redfield, A. C., Ketchum, B. H., and Richards, F. A.: The influence of organisms on the composition of sea water, in: The Sea, edited by: Hill, M. N., Interscience, New York, USA, 26–77, 1963. Reed, D. C., Gustafsson, B. G., and Slomp, C. P.: Shelf-to-basin
iron shuttling enhances vivianite formation in deep Baltic Sea sediments, Earth Planet. Sc. Lett., 434, 241–251, 2016. Riebesell, U., Fabry, V. J., Hansson, L., and Gattuso J.-P.: Guide
to best practices for ocean acidification research and data report-ing, 260 pp., Luxembourg, Publications Office of the European Union, 2010.
Roy, R. N., Roy, L. N., Vogel, K. M., Porter-Moore, C., Pearson, T., Good, C. E., Millero, F. J., and Campbell, D. M.: The dissociation constants of carbonic acid in seawater at salinities 5 to 45 and temperatures 0 to 45◦C, Mar. Chem., 44, 249–267, 1993. Schneider, B.: The CO2 system of the Baltic Sea :
biogeochemi-cal control and impact of anthropogenic CO2, in: Global change
and Baltic coastal zones, edited by Schernewski, G., Hofstede, J., and Neumann, T., Dordrecht: Springer Science+Business Media (Coastal research library), 33–49, 2011.
Schneider, B., Gülzow, W., Sadkowiak, B., and Rehder, G.: Detect-ing sinks and sources of CO2and CH4by ferrybox-based
mea-surements in the Baltic Sea: Three case studies, J. Marine Syst., 140, 13–25, 2014.
Schneider, B., Eilola, K., Lukkari, K., Muller-Karulis, B., and Neumann, T.: Environmental Imapacts – Marine Biogeochem-istry, in: BACC II Author Team, Second Assessment of Climate Change for the Baltic Sea Basin, Springer, Heidelberg, 337–361, 2015.
Schulz, H. D. and Zabel, M.: Marine geochemistry, Springer-Verlag Berlin Heidelberg, 574 pp., 2006.
Szymczycha, B., Maciejewska, A., Winogradow, A., and Pemp-kowiak, J.: Could submarine groundwater discharge be a signifi-cant carbon source to the southern Baltic Sea?, Oceanologia, 56, 327–347, 2014.
Thomas, H., Schiettecatte, L.-S., Suykens, K., Koné, Y. J. M., Shad-wick, E. H., Prowe, A. E. F., Bozec, Y., de Baar, H. J. W., and Borges, A. V.: Enhanced ocean carbon storage from anaerobic al-kalinity generation in coastal sediments, Biogeosciences, 6, 267– 274, https://doi.org/10.5194/bg-6-267-2009, 2009.
Tyrrell, T., Schneider, B., Charalampopoulou, A., and Riebe-sel, U.: Coccolithophores and calcite saturation state in the Baltic and Black Seas, Biogeosciences, 5, 485–494, https://doi.org/10.5194/bg-5-485-2008, 2008.
Ulfsbo, A., Hulth S., and Anderson, L. G.: pH and biogeochemical processes in the Gotland Basin of the Baltic Sea, Mar. Chem., 127, 20–30, 2011.
Ulfsbo, A., Kuli´nski, K., Anderson, L. G., and Turner, D. R.: Mod-elling organic alkalinity in the Baltic Sea using a Humic-Pitzer approach, Mar. Chem., 168, 18–26, 2015.
Uppström, L. R.: The boron/chlorinity ratio of deep-sea water from the Pacific Ocean, Deep-Sea Res., 21, 161–162, 1974.
Weiss, R. F.: Carbon dioxide in water and seawater: the solubility of a non-ideal gas, Mar. Chem., 2, 203–215, 1974.
Winsor, P., Rodhe, J., and Omstedt, A.: Baltic Sea ocean climate: an analysis of 100 yr of hydrographic data with focus on the fresh-water budget, Clim. Res., 18, 5–15, 2001.
Wolf-Gladrow, D. A., Zeebe, R. E., Klaas, C., Körtzinger, A., and Dickson, A. G.: Total alkalinity: The explicit conservative ex-pression and its application to biogeochemical processes, Mar. Chem., 106, 287–300, 2007.
Zeebe, R. E.: History of Seawater Carbonate Chemistry, Atmo-spheric CO2, and Ocean Acidification, Annu. Rev. Earth Pl. Sc.,