www.atmos-meas-tech.net/9/2223/2016/ doi:10.5194/amt-9-2223-2016
© Author(s) 2016. CC Attribution 3.0 License.
Comparison of XCO abundances from the Total Carbon Column
Observing Network and the Network for the Detection of
Atmospheric Composition Change measured in Karlsruhe
Matthäus Kiel1, Frank Hase1, Thomas Blumenstock1, and Oliver Kirner2
1Institute of Meteorology and Climate Research, Karlsruhe Institute of Technology, Karlsruhe, Germany 2Steinbuch Centre for Computing (SCC), Karlsruhe Institute of Technology, Karlsruhe, Germany Correspondence to: Matthäus Kiel ([email protected])
Received: 23 November 2015 – Published in Atmos. Meas. Tech. Discuss.: 18 January 2016 Revised: 31 March 2016 – Accepted: 16 April 2016 – Published: 20 May 2016
Abstract. We present a comparison of Karlsruhe XCO records (April 2010–December 2014) from the Total Carbon Column Observing Network (TCCON) and from the spec-tral region covered by the Network for the Detection of At-mospheric Composition Change (NDACC). The Karlsruhe TCCON Fourier transform infrared (FTIR) spectrometer al-lows us to record spectra in the mid-infrared (MIR) and near-infrared (NIR) spectral region simultaneously, which makes Karlsruhe a favourable FTIR site to directly compare mea-surements from both spectral regions. We compare XCO retrieved from the fundamental absorption band at 4.7 µm (as used by NDACC) and first overtone absorption band at 2.3 µm (TCCON-style measurements). We observe a bias of (4.47±0.17) ppb between both data sets with a standard de-viation of 2.39 ppb in seasonal variation. This corresponds to a relative bias of (4.76±0.18) % and a standard deviation of 2.28 %. We identify different sources which contribute to the observed bias (mass-independent correction factor, air-mass-dependent correction factor, isotopic identities, differ-ing a priori volume mixdiffer-ing ratio profiles) and quantify their contributions. We show that the seasonality in the residual of NDACC and TCCON XCO can be largely explained by the smoothing effect caused by differing averaging kernel sensi-tivities between the MIR and NIR spectral region. This study aims to improve the comparability of NDACC and TCCON XCO validation data sets as desired for potential future satel-lite missions and model studies.
1 Introduction
Carbon monoxide (CO) is an atmospheric trace gas which is of utmost importance for air quality studies. Natural sources of CO in the troposphere are soils, plants, oceans, natu-ral bush, and forest fires. In the stratosphere, the oxida-tion of methane (CH4) and other non-methane hydrocarbons (NMHC) is the key driver in the production of atmospheric CO (Daniel and Solomon, 1998). The main anthropogenic sources of emitted CO into the atmosphere are incomplete combustion of fossil fuels, biomass burning, and other in-dustrial processes. The significance of CO for the forma-tion of ozone (O3) directly influences the air quality in the troposphere and stratosphere (Seiler and Fishman, 1981). The primary sink of CO is the oxidation with the hydroxyl radical OH (Spivakovsky et al., 2000). Therefore, elevated global concentrations of CO implicitly affect global warm-ing (Daniel and Solomon, 1998) and are of interest in today’s environmental sciences.
ad-ditional mathematical methods as well as significant inter-pretive work (Rodgers and Connor, 2003).
Currently, two global ground-based networks operating Fourier transform infrared (FTIR) spectrometers, namely the Total Carbon Column Observing Network (TCCON, Wunch et al., 2011) and the Network for the Detection of Atmo-spheric Composition Change (NDACC, Kurylo, 1991), pro-vide primary validation data records of various atmospheric components including CO.
The TCCON approximates column-averaged abundances of several atmospheric gases which are subject to the usual restrictions of the remote-sensing technique, e.g. non-perfect averaging kernels and a priori knowledge. Currently, 23 glob-ally distributed TCCON instruments measure column abun-dances from solar absorption spectra in the near-infrared (NIR) spectral region. The TCCON retrieval results are tied to the World Meteorological Organization (WMO) scale via aircraft and AirCore profiles to account for systematic bi-ases that are consistent throughout the network (Washen-felder et al., 2006; Deutscher et al., 2010; Wunch et al., 2010; Messerschmidt et al., 2011; Geibel et al., 2012; Karion et al., 2010). Furthermore, the TCCON guidelines imply that instruments and retrieval strategies (including spectroscopic line lists, line shapes, etc.) are as similar as possible at each site. This improves the site-to-site precision and accuracy. TCCON CO retrievals are done from the 2.3 µm overtone ab-sorption band, the same band which is used for retrievals of data sets measured by e.g. the Scanning Imaging Absorption Spectrometer for Atmospheric Cartography (SCIAMACHY, Bovensmann et al., 1999).
The NDACC first started measuring in 1991 and is com-posed of more than 70 remote-sensing research stations. The network aims to observe and understand the chemical and physical conditions of the upper troposphere and strato-sphere. Within the NDACC, the Infrared Working Group (IRWG) consists of 22 sites spread worldwide that measure absorption spectra in the mid-infrared (MIR) using direct sunlight. Measurements are performed in spectral regions as low as 720 cm−1 and up to 4400 cm−1. NDACC CO re-trievals are done from the fundamental absorption band in the MIR at 4.7 µm. NDACC-IRWG data have been widely used for satellite validations and model studies (e.g. de Laat et al., 2010; Sussmann et al., 2005).
Recently, Borsdorff et al. (2016) identified a global bias of 4 ppb between NDACC and TCCON column-averaged dry-air mole fractions of CO (XCO) retrievals when vali-dating the SCIAMACHY XCO data product against both ground-based networks. This discrepancy is confirmed by di-rect comparison of XCO records at sites where both NDACC and TCCON data sets are generated. Data from the Karl-sruhe TCCON site provide a direct comparison of NDACC and TCCON data sets since the spectrometer is an extension over the standard TCCON set-up as a dichroic optic allows us to record solar spectra in the MIR and NIR spectral do-main simultaneously. Narrow filter bands in the MIR are
de-fined by optical filters as recommended by NDACC. Thus the Karlsruhe instrument makes observations in the MIR re-gion which are routinely done by NDACC stations, includ-ing measurements of CO in the fundamental absorption band. Therefore, the Karlsruhe instrument merges an NDACC and TCCON spectrometer in one device.
The identification and quantification of differences be-tween the NDACC and TCCON CO records (e.g. bias, sea-sonality) is of interest for the validation of future satellite missions like the Sentinel 5 Precursor to be launched in 2016 (Vidot et al., 2012). Furthermore, if an intercalibration pro-cedure between NDACC and TCCON long-term CO time se-ries can be established, a combined ground-based data record of both networks can improve the spatial and temporal cov-erage of CO data, which is desirable for model studies and validations.
In this paper, we describe the particular Karlsruhe FTIR set-up (Sect. 2) and present the different retrieval strate-gies for spectra recorded in the MIR and NIR (Sect. 3). We identify differences in the intercomparison of XCO from both networks and quantify their origins, which improves the comparability of XCO data records from both networks (Sect. 4). Finally, we summarize and conclude our findings in Sect. 5.
2 Karlsruhe FTIR instrumentation
The Karlsruhe FTIR instrument is located at the Karl-sruhe Institute of Technology (KIT), Campus North (49.1◦N, 8.4◦E, 110 m a.s.l.). Karlsruhe experiences a mild climate similar to most cities in the mid-western part of Europe. The flat terrain is a favourable scene for model studies and nadir-looking satellite overpasses. Since 2009, the FTIR spectrom-eter has been part of the TCCON. The TCCON retrieves total columns of CO2, CH4, CO, N2O, H2O, HF, and other atmo-spheric gases from solar spectra in the NIR. These spectra are recorded using a Bruker IFS 125 HR spectrometer (Bruker Optics GmbH, Germany). The Karlsruhe FTIR instrumen-tal set-up is an extension of the standard TCCON set-up (Washenfelder et al., 2006; Wunch et al., 2011) as a dichroic optic (cut-on at 5250 cm−1) allows measurements of solar spectra in the MIR and NIR spectral domains simultaneously. The dichroic reflects the MIR spectral domain and transmits the NIR spectral range such that measurements for TCCON and NDACC can be performed simultaneously. Spectral cov-erage from 1900 to 11 000 cm−1is achieved by simultaneous operation of an indium gallium arsenide (InGaAs: from 5250 to 11 000 cm−1) and indium antimonide (InSb: from 1900 to 5250 cm−1) detector.
NDACC stations in the MIR, e.g. NO, HCl, HCN, C2H2, C2H4, NO2, and C2H6. Additionally the fundamental absorp-tion band of CO lies in the covered spectral range. Although the Karlsruhe instrument conforms to almost all the NDACC criteria, it does not cover the full spectral range as recom-mended by NDACC (as low as 720 cm−1) due to the lack of a mercury cadmium telluride (MCT) detector. Therefore, re-trievals of e.g. ozone (O3) at 1000 cm−1are not performed in Karlsruhe.
Due to the simultaneous recording in the MIR and NIR, the total column of O2 retrieved from the 7885 cm−1 ab-sorption band in the NIR can be used to calculate column-averaged dry-air mole fractions (DMFs) for gases retrieved from MIR spectra. This is superior to standard NDACC in-struments, which in general do not have access to the oxy-gen absorption band located in the NIR. Dividing the to-tal column of the gas of interest by the toto-tal column of O2 minimizes measurement and instrumental errors which are common to both gases (e.g. solar tracker mis-pointing, in-strumental line shape errors, zero-level offsets) and improves the precision of the measurement (Washenfelder et al., 2006; Wunch et al., 2011).
For TCCON-style CO measurements the instrument is op-erated at a maximum optical path difference (OPDmax) of 45 cm, leading to a spectral resolution of 0.02 cm−1, while NDACC-style CO measurements are recorded at an OPDmax of 180 cm.
3 Retrieval strategies
Karlsruhe retrievals in the NIR are performed by an adjusted TCCON retrieval strategy which compensates for spectral baseline modulations introduced by the dichroic optic (Kiel et al., 2016). MIR retrievals are performed following the NDACC-IRWG retrieval parameter guidelines. The NDACC retrieval methodology relies on narrow spectral windows, typically up to several wave numbers wide. TCCON instead prefers wider spectral windows which might include an en-tire molecular absorption band of the gas of interest. Using whole absorption bands of molecules minimizes temperature sensitivities and this methodology reduces noise errors of re-trieved total columns. In the next sections, we present the retrieval strategies for CO in the MIR and NIR and we study the impact of different a priori information and spectroscopic parameters on retrieved column abundances.
3.1 NDACC retrieval strategy for CO
For the analysis of spectra recorded in the MIR, we use the retrieval algorithm PROFFIT (Hase et al., 2004), which is widely used within NDACC and for analyses of low-resolution spectra as recorded with EM27/SUN spectrom-eters (Bruker Optics GmbH, Germany; Gisi et al., 2012; Hase et al., 2015; Frey et al., 2015; Klappenbach et al.,
Figure 1. A priori VMR profiles used for the TCCON retrieval of NIR spectra (daily varying profile) and for the NDACC retrieval of MIR spectra (one fixed profile).
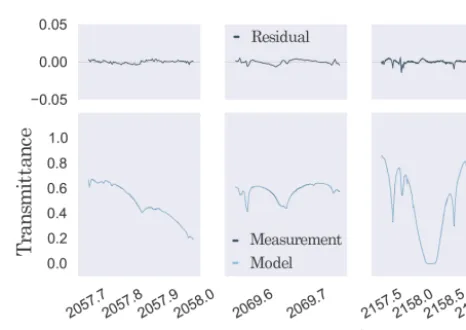
Figure 2. Spectral fits and residuals for CO for one particular Karl-sruhe spectrum recorded in the MIR for the three narrow band spec-tral windows.
Table 1. Retrieval strategies for CO for spectra recorded in the MIR and NIR spectral region.
NDACC retrieval TCCON retrieval
spectral windows h
cm−1 i
2057.5–2058.2 4208.7–4257.3 2069.4–2069.9 4262.0–4318.8 2157.5–2159.2
interfering gases CO2, OCS, O3, N2O, H2O CH4, H2O, HDO retrieval algorithm PROFFIT V9.6 GGG2014 (GFIT) line list HITRAN 2008, based on
HITRAN 2009 (H2O, HDO) HITRAN 2012
retrieval constraint Tikhonov–Phillips scaling of a priori VMR profile
L1regularization (DOF∗≈3.0)
a priori VMR profile WACCM V.6 (fixed) based on in situ measurements (daily)
∗degrees of freedom (DOF)
scale (Hase et al., 2004; Schneider et al., 2006). The signal-to-noise ratio is empirically obtained from the fit residual and the regularization strength is tuned such that approximately 3 degrees of freedom are reached. The a priori VMR profile is obtained from the Whole Atmospheric Chemistry Climate Model (WACCM; Garcia et al., 2007) as recommended by NDACC. We use one fixed a priori VMR profile for the entire temporal range of our study (April 2010–December 2014) which represents the average obtained from model runs from 1980 to 2020 for Karlsruhe (see Fig. 1). We use the High Resolution Transmission (HITRAN; Rothman et al., 2009) line list from 2008 in its original form for CO and interfer-ing species (see Table 1) except for H2O and HDO. For H2O and HDO we use the HITRAN 2009 line list update. Spectral fits and residuals (the difference between the computed and measured spectrum) for CO for one particular measurement in the MIR are depicted in Fig. 2. We use pressure and tem-perature profiles allowing for intra-day variability based on eight individual profiles for one measurement day. These pro-files are taken from measurements obtained from instruments installed at the Karlsruhe meteorological tall tower (200 m), which is located at KIT near the FTIR observatory, and the Modern-Era Retrospective analysis for Research and Appli-cations (MERRA; Rienecker et al., 2011) model data, which provide temperature and pressure profiles on a 1.25◦×1.25◦ grid, from 1000 to 0.1 hPa, eight times per day. For each of the eight time points, the solar position is calculated and the pressure and temperature along the unrefracted path of the solar radiation is retrieved from the model data (Gisi et al., 2012).
3.2 TCCON retrieval strategy for CO
For TCCON-style measurements in the NIR, the recorded in-terferograms are analysed with the GGG2014 Software Suite which includes GFIT, a nonlinear least-squares spectral fit-ting algorithm (Wunch et al., 2015). Total columns of CO
Figure 3. Spectral fits for one particular Karlsruhe spectrum recorded in the NIR; spectral fit and residual for CO in the 4208.7 to 4257.3 cm−1 (upper panel) and 4262.0 to 4328.8 cm−1(lower panel) spectral window.
band ranging from 4208.7 to 4257.3 cm−1and from 4262.0 to 4318.8 cm−1are fitted. Interfering species are CH4, H2O, and HDO. For TCCON-style CO retrievals, an adopted HI-TRAN 2012 line list (Rothman et al., 2013) is used. For H2O, many changes were applied to the original list throughout the 4000 to 6000 cm−1 region based on fits made to Kitt Peak laboratory spectra (Wunch et al., 2015). Spectral fits for CO for one particular measurement in the NIR are depicted in Fig. 3. Ten minute means of the ground pressure and surface temperature obtained from the Karlsruhe tall tower are used as auxiliary data for the Karlsruhe TCCON retrievals. A sum-mary of the CO retrieval strategies for MIR and NIR spectra is given in Table 1.
3.3 Calculation of DMFs
To calculate column-averaged DMFs of CO, namely XCO, the total column amount of CO (CCO) is divided by the total column of dry air (Cdryair):
XCO= CCO
Cdryair
. (1)
For TCCON, Cdryairis determined via the total column of O2 (CO2) retrieved from the 7885 cm
−1 absorption band in the NIR divided by an assumed dry-air mole fraction of O2 (0.2095):
Cdryair= CO2
0.2095. (2)
In general, standard NDACC instruments which only mea-sure in the MIR do not have access to the O2absorption band in the NIR. Instead, Cdryaircan be calculated on the basis of the ground pressurepgand the total column of water vapour (CH2O):
Cdryair= pg
g·mdryair
−CH2O·mH2O mdryair
. (3)
Here,g represents the gravitational acceleration whereas
mdryair andmH2O represent the molecular masses of dry air
and water vapour respectively.
Since the Karlsruhe FTIR set-up allows us to record spec-tra in the MIR and NIR simultaneously, we use Eq. (2) to calculate XCO from the fundamental absorption band in the MIR instead of Eq. (3). The advantage of calculating DMFs using Eq. (2) is that solar tracker problems lead-ing to mis-pointlead-ing and zero-level offsets can be minimized since both CCOand Cdryairare affected by the particular er-ror in the same way. Therefore, for NDACC FTIR sites it is worth considering extending the accessible spectral range to the 7885 cm−1O2absorption band to minimize such er-rors. For the retrieval of O2, both retrieval algorithms, GFIT and PROFFIT, scale an altitude-independent a priori VMR profile using the spectral window ranging from 7765.0 to 8005.0 cm−1. The corresponding spectral fits retrieved by GFIT and PROFFIT are depicted in Fig. 4.
The CO2 from the 7885 cm
−1 absorption band retrieved with GGG2014 and PROFFIT are in good agreement (see Fig. A1 in Appendix A). We identify a bias of (0.04±0.02) % with a standard deviation of 0.09 %. Using Eq. (3) to determine Cdryairfor MIR spectra (using PROFFIT for the H2O retrieval) indicates a bias of (−2.28±0.01) % with a standard deviation of 0.13 % (see Fig. A2 in Ap-pendix A) when compared with Cdryairobtained from Eq. (2) (using GGG2014). The small standard deviation indicates that the improvement achieved by dividing by CO2 does not
offer a significant improvement for a species of large natu-ral variability observed with state-of-the-art NDACC instru-mentations. The bias of−2.28 % is mainly due to spectro-scopic inadequacies attributed to oxygen line intensity errors and is in good agreement with a bias of−2.27 % observed by Washenfelder et al. (2006). However, despite the constant bias, the advantage of Eq. (2) is that errors in retrieved total columns of H2O as well as rare but still possible inadequacies in measurements of the ground pressure due to instrument failure do not contribute to the total dry-air column. More-over, errors that are common to CO and O2are minimized, e.g. mis-pointing of the solar tracker and zero-level offsets, and hence a direct comparison of XCO from the fundamental and the first overtone absorption band is improved.
TCCON measurements are tied to the WMO scale. Calcu-lated DMFs retrieved in the NIR are divided by a correction factor determined via in situ aircraft measurements flown over TCCON sites (Washenfelder et al., 2006; Deutscher et al., 2010; Wunch et al., 2010; Messerschmidt et al., 2011; Geibel et al., 2012). For TCCON XCO the correction fac-tor is 1.0672. For MIR retrievals, we do not apply a post-processing correction.
3.4 Impact of a priori choice
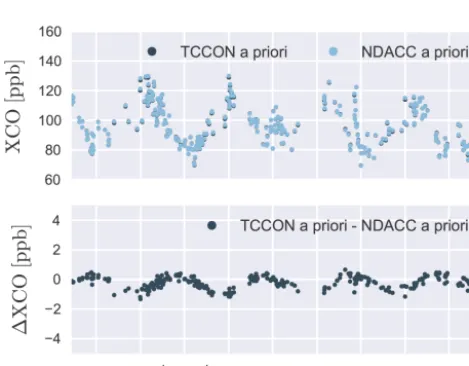
The choice of a priori information influences the retrieved column abundances and has to be taken into account for an intercomparison of different soundings (Rodgers and Con-nor, 2003). We follow the MIR and NIR retrieval strategies with (1) the standard a priori VMR profiles and (2) switched a priori profiles for both retrieval strategies. For the analy-sis we use data from April 2010 to December 2014 and cal-culate daily means for days with at least two measurements. The seasonal bias induced by the change of the a priori VMR profile for the NDACC XCO retrieval is shown in Fig. 5. We identify a bias of (−0.20±0.18) ppb in the absolute differ-ence time series and a seasonal cycle with a standard devia-tion of 0.39 ppb.
Figure 4. Spectral fits and residuals for one particular Karlsruhe spectrum recorded in the NIR for O2retrieved with PROFFIT (up-per panel) and GGG2014 (lower panel). Residuals in the NIR are smaller due to the adoption of H2O absorption line parameters in the line list used for the TCCON retrieval.
Figure 5. Upper panel: daily mean time series of XCO retrieved from MIR spectra using different a priori VMR profiles; lower panel: the absolute difference time series shows the impact of changing the a priori profiles.
in front of the InSb diode while simultaneously recording NIR spectra with the InGaAs diode. However, the narrow band filters in front of the InSb diode are shuffled in an order
Figure 6. Same as Fig. 5 for XCO retrieved from NIR spectra using the TCCON retrieval strategy with changed a priori VMR profiles.
that every other spectrum covers the CO first overtone band, leading to a larger number of TCCON-style CO measure-ments than NDACC-style measuremeasure-ments covering the funda-mental band. For the TCCON XCO time series we identify a significant bias of (0.30±0.12) ppb with a standard devi-ation of 1.15 ppb in the seasonal varidevi-ation. Using one fixed a priori VMR profile is a poor choice for a scaling retrieval since it depends on the shape of the VMR profile which, in general, changes over the year and seasons. Therefore, it is important to use variable daily VMR profiles when perform-ing a scalperform-ing retrieval. In general, it is better to use the same a priori VMR profile when comparing two different remote sounders. The retrieved profilexcan be expressed as x=A xtrue−xapriori
+xapriori+. (4)
Here,xtruerepresents the true atmospheric profile,xapriori the used a priori VMR profile,the random and systematic error term, and A the averaging kernel matrix. Therefore, us-ing a common a priori profile leads to the same value for the difference xtrue−xapriorifor both retrieval strategies and eliminates differences in a direct comparison of TCCON and NDACC data due to differing a priori VMR profiles. Never-theless, the term A xtrue−xapriori
in Eq. (4), here referred to as smoothing effect, still has to be taken into account for an intercomparison. Typically, A is different for different re-mote sounders and also influences a direct comparison (see Sect. 4.2).
3.5 Impact of line list choice
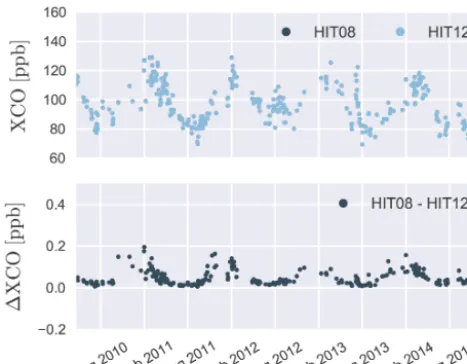
Figure 7. Upper panel: daily mean time series of XCO retrieved from MIR spectra following the NDACC retrieval methodology for the HITRAN 2008 (HIT08) and HITRAN 2012 (HIT12) spectro-scopic line lists; lower panel: the absolute difference time series shows the impact from the change of spectroscopic parameters.
(GFIT and PROFFIT) for the forward simulation. For CO retrievals, the TCCON uses spectroscopic parameters based on the HITRAN 2012 line list, whereas the NDACC uses the HITRAN 2008 compilation. We expect that an update from HITRAN 2008 to HITRAN 2012 has minimal impact on the NDACC CO retrieval in the MIR since major changes of the parameters in the 2012 version were primarily applied to the first overtone band in the NIR (Rothman et al., 2013). The NDACC CO time series retrieved with changed HITRAN line lists is depicted in Fig. 7. A bias of (0.05±0.17) ppb is induced with a standard deviation of 0.03 ppb in the sea-sonal variation. The observed peaks in 1XCO during win-ter are due to line list changes: HITRAN 2012 adds non-zero air-pressure-induced line shifts for the target lines of the NDACC CO retrieval, while the pressure broadening pa-rameters remain unchanged. Due to the fact that an observed spectral line is comprised of absorption contributions from different altitudes, this generates an additional smear of the absorption along the spectral abscissa. As a consequence, in the case of an optically thick line, a smaller number of molecules is required for generating the same attenuation of the solar radiation (spectrally integrated over the whole line) and thereby slightly reduces the retrieved column values.
Accordingly, this effect is revealed by depicting the CO slant column and its change for different line lists (see Fig. A3 in Appendix A).
Nevertheless, changes in the retrieved CO total columns are rather small using the updated HITRAN 2012 line list. Therefore, the different choice of spectroscopic parameters does not substantially affect the comparison of NDACC and TCCON CO data records.
Figure 8. Upper panel: daily mean time series of XCO retrieved from MIR and NIR spectra using the NDACC and TCCON retrieval strategy respectively; lower panel: scatter graph of NDACC and TC-CON daily means. The slope was obtained from a linear fit forced through zero.
4 Direct comparison
We compare the XCO time series as retrieved (see Fig. 8, upper panel) using the TCCON and NDACC retrieval as de-scribed in Table 1. Figure 8 (lower panel) shows a 1:1 plot of the NDACC and TCCON daily means from April 2010 to December 2014. The slope obtained from a linear fit forced through zero is significantly different from 1 (0.952244). This corresponds to a bias between both time series. The ab-solute difference time series (NDACC–TCCON) of the same data is shown in Fig. 9 (upper panel). We identify a bias of (4.47±0.17) ppb with a clear difference in seasonality (stan-dard deviation of 2.06 ppb). In the next sections we analyse the origin of the bias and seasonality when comparing TC-CON and NDACC XCO data.
4.1 Analysis of bias
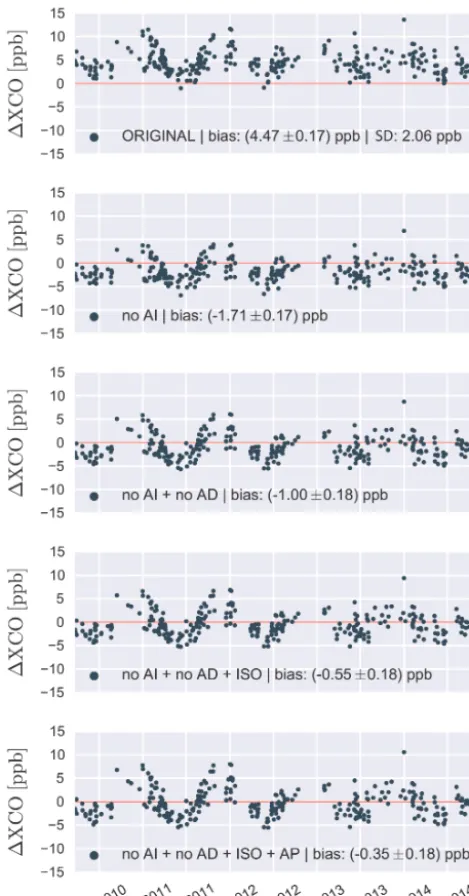
Figure 9. Daily mean absolute difference time series (NDACC– TCCON) of XCO for the standard retrievals (first panel, labelled as “ORIGINAL”), no air-mass-independent correction factor (AI) ap-plied (second panel), no air-mass-dependent correction factor (AD) applied (third panel), a modified treatment of isotopic identities ap-plied for the MIR retrieval (ISO, fourth panel), and used common a priori (AP) VMR profiles (fifth panel). Zero lines are marked red and are for eye-guidance only.
correction factor (AI) determined via in situ measure-ments over TCCON sites. For XCO this correction fac-tor is 1.0672. NDACC measurements are not tied to the WMO scale and no correction factor is applied in the post-processing routine. The absolute difference time series (NDACC–TCCON) without applying AI to TCCON XCO is shown in Fig. 9 (second panel). The mean offset is reduced
to (−1.71±0.17) ppb. Therefore, not applying AI reduces the bias and changes sign. For future studies, it would be favourable to determine an AI for the NDACC XCO data set in the same way as for TCCON. An in situ calibration for NDACC XCO data will most likely improve the consistency between both data sets and will tie the NDACC XCO product to the WMO scale. Since an aircraft overflight can be a very involved and expensive undertaking, a scaling of the NDACC XCO data set to the TCCON XCO data might be an alterna-tive to an aircraft overflight. NDACC XCO can be tied to the WMO scale via an intercalibration factor obtained from the intercomparison of NDACC and TCCON XCO. For Karl-sruhe we determine a factor of 1.048 with an corresponding error of 0.002. Therefore, for a joint use of Karlsruhe MIR and NIR XCO, we recommend dividing NDACC XCO by this intercalibration factor. Moreover, a global multi-station intercalibration factor for NDACC and TCCON XCO is de-sirable and will be subject of future studies.
TCCON data are also corrected for air-mass-dependent artefacts. The air-mass-dependent correction factor (AD) is applied to the column-averaged mole fractions of CO. AD is determined from the symmetric component of the diurnal variation. A detailed description of the method to determine the correction factor and its value is given in Wunch et al. (2011) and Wunch et al. (2015). Here we analyse the impact of applying AD in the post-processing routine of GGG2014 on TCCON measurement. XCO retrieved with and without AD with respect to the solar zenith angle (SZA) is depicted in Fig. A4 in Appendix A. If AD is applied, XCO is ele-vated for large SZA and a possible air-mass-dependence is corrected. The change in XCO due to AD and the difference between TCCON and NDACC XCO is shown in Fig. A5 in Appendix A.1XCO between NDACC and TCCON is closer to 0 for large SZA (>50◦) when no AD is applied, whereas applying AD reduces the SZA dependence, which leads to a constant offset between NDACC and TCCON XCO for all SZA. This behaviour is reflected in the difference time se-ries (see Fig. 9, third panel). The bias is further reduced to (−1.00±0.17) ppb when we do not apply AD to TCCON XCO at the expense of an air-mass dependence. For NDACC no clear air-mass dependence is observed and consequently no post-processing air-mass correction is required.
If atmospheric isotopic ratios deviate from the De Biévre et al. (1984) reference values, GGG2014 parameterizes the atmospheric fractionation using improved values. For the two most abundant isotopologues, 12C16O and 13C16O, GGG2014 uses an altitude-independentδ13C(CO)value (the ratio of the isotopologues 13C16O and 12C16O) of −27 ‰ (Wang et al., 2012). This parameter corrects for spectro-scopic inconsistencies and therefore mainly represents spec-troscopic biases between different isotopologues. This is not taken into account in the standard MIR retrieval. Thus, we apply the same isotopic treatment for12C16O and13C16O as used in the TCCON for the NDACC retrieval. We expect a reduction of the observed bias since two of the spectral win-dows in the MIR contain13C16O absorption lines. The dif-ference time series when the modified treatment of isotopic identities in the MIR is applied is shown in Fig. 9 (fourth panel). We identify a bias of (−0.55±0.18) ppb. In general, it might be better to use a CO retrieval strategy in the MIR with a modified treatment of different isotopic identities or as an alternative to use narrow spectral windows containing absorption lines without mixed isotopic identities.
In addition, to eliminate the impact of differing a priori VMR profiles, we follow the NDACC retrieval strategy using the TCCON daily a priori VMR profiles. From our findings in Sect. 3.4 we expect a rather small impact of the choice of the a priori VMR profile on the observed bias. The dif-ference time series using common a priori VMR profiles is depicted in Fig. 9 (fifth panel). The bias is further reduced to (−0.35±0.18) ppb.
Although we are able to quantify the largest proportions which contribute to the bias between NDACC and TCCON data, we still identify a remaining bias of about−0.35 ppb. Further differences might be induced by inconsistencies in spectroscopic parameters for MIR and NIR spectral ranges. Changes in HITRAN 2012 were mainly applied to the CO overtone absorption band in the NIR (e.g. line intensi-ties, self- and air-broadening parameters, temperature depen-dence, and air-induced line shifts) while line intensities, tem-perature dependence, etc. remained unchanged in the MIR spectral domain. Furthermore, TCCON uses a customized HITRAN 2012 CO line list in the NIR, whereas we use the HITRAN 2008 line list in its original form for CO NDACC retrievals. Furthermore, we can rule out that the remaining bias is induced by the calculation of XCO. Our findings in Sect. 3.3 revealed that the total column of O2retrieved from GGG2014 and PROFFIT is in good agreement and has neg-ligible impact on the observed bias. The same holds for our findings in Sect. 3.5, which have shown that the impact of different spectroscopic parameters on the bias is not signifi-cant.
4.2 Analysis of seasonality
Our comparison shows a clear seasonal variation with a stan-dard deviation of 2.06 ppb in the difference time series (see
Fig. 9, upper panel). This seasonality is related to differing averaging kernels (AVKs) in the MIR and NIR, which are a function of pressure, slant column, and solar zenith angle and therefore variable with season. To estimate the smoothing ef-fect in our comparison, we apply Eq. (4) for TCCON and NDACC AVKs assuming simulated model profiles as true at-mospheric profiles. We retrieve NDACC and TCCON XCO using common a priori VMR profiles (daily TCCON a priori VMR profiles) to eliminate the effect of differing prior infor-mation (see Sect. 3.4). We expect to see a similar seasonality (with a comparable amplitude and phase) in the residual of the smoothed model data as in the original NDACC and TC-CON XCO difference time series.
4.2.1 Applying averaging kernels
A smoothed profilexs can be computed when using e.g. a
simulated VMR profilexmodel as the true atmospheric pro-file. This leads to
xs=A xmodel−xapriori
+xapriori+. (5)
The difference1xsbetween smoothed profiles using
dif-fering MIR and NIR AVKs is given by
1xs=(AMIR−NIR) xmodel−xapriori. (6) Here, AMIRand ANIRrepresent the differing NDACC and TCCON AVKs (see Figs. 10 and 11). Note, Eq. (6) only holds when we use a common a priori VMR profile and de-scribes the impact from differing AVKs on the retrieved total columns when integrated over pressure layers, which is of major interest in our analysis.
4.2.2 ECHAM/MESSy Atmospheric Chemistry (EMAC) model data
Figure 10. Column averaging kernels for the NDACC retrieval us-ing MIR spectra. Different solar zenith angles (SZA) are colour coded (upper panel). For a better visualization, column averaging kernels are depicted for different CO slant columns (lower panel).
with the help of the submodels MECCA (Sander et al., 2005) and MSBM (Kirner et al., 2011). The gas-phase reaction rate coefficients for gas-phase reactions and absorption cross sec-tions for photolysis are taken from Atkinson et al. (2007) and Sander et al. (2011). A Newtonian relaxation technique for the prognostic variables temperature, vorticity, divergence, and the surface pressure is implemented in EMAC to re-produce realistic synoptic conditions. We apply this nudging technique in our simulations above the boundary layer and below 1 hPa using the ERA-Interim reanalysis (Dee et al., 2011) from the European Centre for Medium-range Weather Forecasts (ECMWF).
4.2.3 Estimation of smoothing effect
For our study, we apply NDACC and TCCON AVKs to one simulated CO profile (interpolated to the height levels used in our retrievals) per day at 12:00:00 UTC (see Fig. 12). Fig-ure 13 (upper panel) shows calculated XCO when we apply Eq. (4) using differing AVKs and when we assume the simu-lated CO EMAC profiles as true atmospheric VMR profiles.
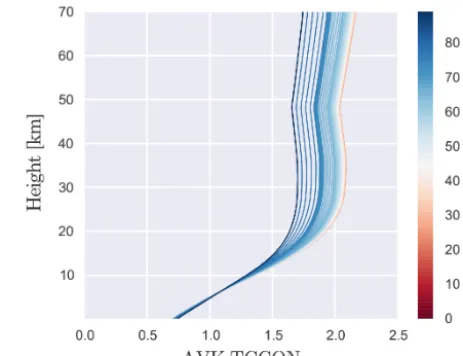
Figure 11. Column averaging kernels (mean of kernels from both NIR spectral windows) for the TCCON retrieval for different solar zenith angles (SZAs). Intermediate kernels are obtained from lin-early interpolated averaging kernels from one Karlsruhe measure-ment day covering a wide range of SZA.
Figure 12. Simulated EMAC CO VMR profiles used in this study.
Figure 13. Smoothed XCO time series using NDACC and TCCON averaging kernels and simulated EMAC VMR profiles as the true atmospheric profile (upper panel); the lower panel shows the differ-ence time series of both smoothed time series and is an estimate of the smoothing effect observed in the original time series, which rep-resents the difference of the unmodified standard retrievals as used for NDACC and TCCON (labelled as “ORIGINAL”). For a better comparison of the seasonality, we removed the induced bias in both time series.
into account when using NDACC and TCCON XCO as a joint validation data set for different seasons.
5 Conclusions
In this work we compare Karlsruhe NDACC and TCCON XCO retrievals (April 2010–December 2014) from the fun-damental absorption band (4.7 µm) in the MIR and the first overtone absorption band (2.3 µm) in the NIR. Karlsruhe is a good site for a direct comparison of NDACC and TCCON data records since the particular instrumental set-up allows to record spectra in the MIR and NIR simultaneously. We observe a bias of (4.47±0.17) ppb between XCO retrieved from NDACC and TCCON using different retrieval algo-rithms and retrieval strategies. We identify and quantify dif-ferent sources, which contribute to the observed bias. The air-mass-independent correction factor (1.0672) which is ap-plied to TCCON XCO in the post-processing routine is the main source of the observed difference. The bias is reduced to (−1.7±0.17) ppb when this factor is not applied. Further-more, the air-mass-dependent correction factor contributes 0.71 ppb to the overall bias whereas a TCCON compatible treatment of different isotopic identities in the MIR retrieval strategy reduces the bias by 0.45 ppb. The impact of different a priori VMR profiles (0.20 ppb) and the choice of different spectroscopic line lists (0.05 ppb) has minor influence on the overall bias. A remaining bias of (−0.35±0.18) ppb might be subject to imperfect knowledge of the spectroscopic
Appendix A: Additional Figures
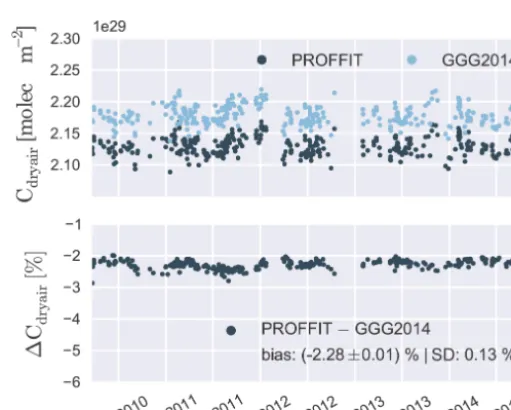
Figure A1. Upper panel: daily mean time series of Cdryairretrieved from the oxygen 7885 cm−1absorption band using the PROFFIT and GGG2014 retrieval algorithm; lower panel: relative difference time series (PROFFIT – GGG2014). The impact of the bias and standard deviation in the seasonal cycle is rather small and only slightly affects XCO from MIR and NIR retrievals.
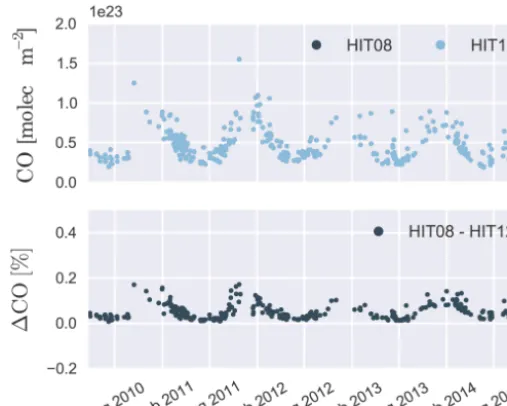
Figure A3. Upper panel: daily mean time series of CO slant columns retrieved from MIR spectra for HITRAN 2008 (HIT08) and HITRAN 2012 (HIT12); the lower panel shows the relative difference time series. The maxima in both time series are in phase.
Acknowledgements. The research leading to these results has received funding from the European Community’s Seventh Framework Programme (FP7/2007-2013) under grant agree-ment no. 284421 (NORS project). We thank Debra Wunch, Paul O. Wennberg (both California Institute of Technology, Pasadena), and Geoffrey C. Toon (Jet Propulsion Laboratory, Pasadena) for their helpful comments. We acknowledge Martin Kohler from the Institute for Meteorology and Climate Research – Troposphere Research (IMK-TRO) at the KIT for providing tall-tower meteorological data. We acknowledge support by Deutsche Forschungsgemeinschaft and Open Access Publishing Fund of the Karlsruhe Institute of Technology.
The article processing charges for this open-access publication were covered by a Research
Centre of the Helmholtz Association.
Edited by: H. Maring
References
Atkinson, R., Baulch, D. L., Cox, R. A., Crowley, J. N., Hampson, R. F., Hynes, R. G., Jenkin, M. E., Rossi, M. J., and Troe, J.: Eval-uated kinetic and photochemical data for atmospheric chemistry: Volume III – gas phase reactions of inorganic halogens, Atmos. Chem. Phys., 7, 981–1191, doi:10.5194/acp-7-981-2007, 2007. Borsdorff, T., Tol, P., Williams, J. E., de Laat, J., aan de Brugh,
J., Nédélec, P., Aben, I., and Landgraf, J.: Carbon monoxide to-tal columns from SCIAMACHY 2.3 µm atmospheric reflectance measurements: towards a full-mission data product (2003–2012), Atmos. Meas. Tech., 9, 227–248, doi:10.5194/amt-9-227-2016, 2016.
Bovensmann, H., Burrows, J. P., Buchwitz, M., Frerick, J., Noël, S., Rozanov, V. V., Chance, K. V., and Goede, A. P. H.: SCIAMACHY: Mission Objectives and Measure-ment Modes, J. Atmos. Sci., 56, 127–150, doi:10.1175/1520-0469(1999)056<0127:SMOAMM>2.0.CO;2, 1999.
Buchwitz, M., Khlystova, I., Bovensmann, H., and Burrows, J. P.: Three years of global carbon monoxide from SCIAMACHY: comparison with MOPITT and first results related to the detec-tion of enhanced CO over cities, Atmos. Chem. Phys., 7, 2399– 2411, doi:10.5194/acp-7-2399-2007, 2007.
Clerbaux, C., George, M., Turquety, S., Walker, K. A., Barret, B., Bernath, P., Boone, C., Borsdorff, T., Cammas, J. P., Catoire, V., Coffey, M., Coheur, P.-F., Deeter, M., De Mazière, M., Drum-mond, J., Duchatelet, P., Dupuy, E., de Zafra, R., Eddounia, F., Edwards, D. P., Emmons, L., Funke, B., Gille, J., Griffith, D. W. T., Hannigan, J., Hase, F., Höpfner, M., Jones, N., Ka-gawa, A., Kasai, Y., Kramer, I., Le Flochmoën, E., Livesey, N. J., López-Puertas, M., Luo, M., Mahieu, E., Murtagh, D., Nédélec, P., Pazmino, A., Pumphrey, H., Ricaud, P., Rinsland, C. P., Robert, C., Schneider, M., Senten, C., Stiller, G., Strandberg, A., Strong, K., Sussmann, R., Thouret, V., Urban, J., and Wiacek, A.: CO measurements from the ACE-FTS satellite instrument: data analysis and validation using ground-based, airborne and spaceborne observations, Atmos. Chem. Phys., 8, 2569–2594, doi:10.5194/acp-8-2569-2008, 2008.
Daniel, J. S. and Solomon, S.: On the climate forcing of car-bon monoxide, J. Geophys. Res.-Atmos., 103, 13249–13260, doi:10.1029/98JD00822, 1998.
De Biévre, P., Gallet, M., Holden, N. E., and Barnes, I. L.: Iso-topic Abundances and Atomic Weights of the Elements, J. Phys. Chem. Ref. Data, 13, 809–891, doi:10.1063/1.555720, 1984. de Laat, A. T. J., Gloudemans, A. M. S., Schrijver, H., Aben, I.,
Na-gahama, Y., Suzuki, K., Mahieu, E., Jones, N. B., Paton-Walsh, C., Deutscher, N. M., Griffith, D. W. T., De Mazière, M., Mitter-meier, R. L., Fast, H., Notholt, J., Palm, M., Hawat, T., Blumen-stock, T., Hase, F., Schneider, M., Rinsland, C., Dzhola, A. V., Grechko, E. I., Poberovskii, A. M., Makarova, M. V., Mellqvist, J., Strandberg, A., Sussmann, R., Borsdorff, T., and Rettinger, M.: Validation of five years (2003–2007) of SCIAMACHY CO total column measurements using ground-based spectrometer ob-servations, Atmos. Meas. Tech., 3, 1457–1471, doi:10.5194/amt-3-1457-2010, 2010.
Dee, D. P., Uppala, S. M., Simmons, A. J., Berrisford, P., Poli, P., Kobayashi, S., Andrae, U., Balmaseda, M. A., Balsamo, G., Bauer, P., Bechtold, P., Beljaars, A. C. M., van de Berg, L., Bid-lot, J., Bormann, N., Delsol, C., Dragani, R., Fuentes, M., Geer, A. J., Haimberger, L., Healy, S. B., Hersbach, H., Hólm, E. V., Isaksen, L., Kållberg, P., Köhler, M., Matricardi, M., McNally, A. P., Monge-Sanz, B. M., Morcrette, J.-J., Park, B.-K., Peubey, C., de Rosnay, P., Tavolato, C., Thépaut, J.-N., and Vitart, F.: The ERA-Interim reanalysis: configuration and performance of the data assimilation system, Q. J. Roy. Meteor. Soc., 137, 553–597, doi:10.1002/qj.828, 2011.
Deeter, M. N., Emmons, L. K., Francis, G. L., Edwards, D. P., Gille, J. C., Warner, J. X., Khattatov, B., Ziskin, D., Lamarque, J.-F., Ho, S.-P., Yudin, V., Attié, J.-L., Packman, D., Chen, J., Mao, D., and Drummond, J. R.: Operational carbon monoxide retrieval algorithm and selected results for the MOPITT instrument, J. Geophys. Res.-Atmos., 108, 4399, doi:10.1029/2002JD003186, 2003.
Deutscher, N. M., Griffith, D. W. T., Bryant, G. W., Wennberg, P. O., Toon, G. C., Washenfelder, R. A., Keppel-Aleks, G., Wunch, D., Yavin, Y., Allen, N. T., Blavier, J.-F., Jiménez, R., Daube, B. C., Bright, A. V., Matross, D. M., Wofsy, S. C., and Park, S.: Total column CO2measurements at Darwin, Australia – site de-scription and calibration against in situ aircraft profiles, Atmos. Meas. Tech., 3, 947–958, doi:10.5194/amt-3-947-2010, 2010. Frey, M., Hase, F., Blumenstock, T., Groß, J., Kiel, M., Mengistu
Tsidu, G., Schäfer, K., Sha, M. K., and Orphal, J.: Calibration and instrumental line shape characterization of a set of portable FTIR spectrometers for detecting greenhouse gas emissions, At-mos. Meas. Tech., 8, 3047–3057, doi:10.5194/amt-8-3047-2015, 2015.
Garcia, R. R., Marsh, D. R., Kinnison, D. E., Boville, B. A., and Sassi, F.: Simulation of secular trends in the mid-dle atmosphere, 1950–2003, J. Geophys. Res.-Atmos., 112, doi:10.1029/2006JD007485, d09301, 2007.
Gisi, M., Hase, F., Dohe, S., Blumenstock, T., Simon, A., and Keens, A.: XCO2-measurements with a tabletop FTS using so-lar absorption spectroscopy, Atmos. Meas. Tech., 5, 2969–2980, doi:10.5194/amt-5-2969-2012, 2012.
Hase, F., Hannigan, J., Coffey, M., Goldman, A., Höpfner, M., Jones, N., Rinsland, C., and Wood, S.: Intercomparison of re-trieval codes used for the analysis of high-resolution, ground-based FTIR measurements, J. Quant. Spectrosc. Ra., 87, 25–52, doi:10.1016/j.jqsrt.2003.12.008, 2004.
Hase, F., Frey, M., Blumenstock, T., Groß, J., Kiel, M., Kohlhepp, R., Mengistu Tsidu, G., Schäfer, K., Sha, M. K., and Orphal, J.: Application of portable FTIR spectrometers for detecting green-house gas emissions of the major city Berlin, Atmos. Meas. Tech., 8, 3059–3068, doi:10.5194/amt-8-3059-2015, 2015. Jöckel, P., Tost, H., Pozzer, A., Brühl, C., Buchholz, J., Ganzeveld,
L., Hoor, P., Kerkweg, A., Lawrence, M. G., Sander, R., Steil, B., Stiller, G., Tanarhte, M., Taraborrelli, D., van Aardenne, J., and Lelieveld, J.: The atmospheric chemistry general circulation model ECHAM5/MESSy1: consistent simulation of ozone from the surface to the mesosphere, Atmos. Chem. Phys., 6, 5067– 5104, doi:10.5194/acp-6-5067-2006, 2006.
Jöckel, P., Kerkweg, A., Pozzer, A., Sander, R., Tost, H., Riede, H., Baumgaertner, A., Gromov, S., and Kern, B.: Development cycle 2 of the Modular Earth Submodel System (MESSy2), Geosci. Model Dev., 3, 717–752, doi:10.5194/gmd-3-717-2010, 2010. Karion, A., Sweeney, C., Tans, P., and Newberger, T.: AirCore:
An Innovative Atmospheric Sampling System, J. Atmos. Ocean. Tech., 27, 1839–1853, doi:10.1175/2010JTECHA1448.1, 2010. Kiel, M., Wunch, D., Wennberg, P. O., Toon, G. C., Hase, F., and
Blumenstock, T.: Improved retrieval of gas abundances from near-infrared solar FTIR spectra measured at the Karlsruhe TC-CON station, Atmos. Meas. Tech., 9, 669–682, doi:10.5194/amt-9-669-2016, 2016.
Kirner, O., Ruhnke, R., Buchholz-Dietsch, J., Jöckel, P., Brühl, C., and Steil, B.: Simulation of polar stratospheric clouds in the chemistry-climate-model EMAC via the submodel PSC, Geosci. Model Dev., 4, 169–182, doi:10.5194/gmd-4-169-2011, 2011. Klappenbach, F., Bertleff, M., Kostinek, J., Hase, F., Blumenstock,
T., Agusti-Panareda, A., Razinger, M., and Butz, A.: Accurate mobile remote sensing of XCO2and XCH4latitudinal transects from aboard a research vessel, Atmos. Meas. Tech., 8, 5023– 5038, doi:10.5194/amt-8-5023-2015, 2015.
Kramer, I.: Time series of tropospheric trace gases derived from ground-based FTIR measurements, PhD thesis, Karlsruhe Insti-tute of Technology, 2007.
Kurylo, M. J.: Network for the detection of stratospheric change, Proc. SPIE, 1491, 168–174, doi:10.1117/12.46658, 1991. Messerschmidt, J., Geibel, M. C., Blumenstock, T., Chen, H.,
Deutscher, N. M., Engel, A., Feist, D. G., Gerbig, C., Gisi, M., Hase, F., Katrynski, K., Kolle, O., Lavric, J. V., Notholt, J., Palm, M., Ramonet, M., Rettinger, M., Schmidt, M., Suss-mann, R., Toon, G. C., Truong, F., Warneke, T., Wennberg, P. O., Wunch, D., and Xueref-Remy, I.: Calibration of TCCON column-averaged CO2: the first aircraft campaign over Euro-pean TCCON sites, Atmos. Chem. Phys., 11, 10765–10777, doi:10.5194/acp-11-10765-2011, 2011.
Rienecker, M. M., Suarez, M. J., Gelaro, R., Todling, R., Bacmeis-ter, J., Liu, E., Bosilovich, M. G., Schubert, S. D., Takacs, L., Kim, G.-K., Bloom, S., Chen, J., Collins, D., Conaty, A.,
da Silva, A., Gu, W., Joiner, J., Koster, R. D., Lucchesi, R., Molod, A., Owens, T., Pawson, S., Pegion, P., Redder, C. R., Re-ichle, R., Robertson, F. R., Ruddick, A. G., Sienkiewicz, M., and Woollen, J.: MERRA: NASA’s Modern-Era Retrospective Anal-ysis for Research and Applications, J. Climate, 24, 3624–3648, doi:10.1175/JCLI-D-11-00015.1, 2011.
Rodgers, C. D. and Connor, B. J.: Intercomparison of remote sound-ing instruments, J. Geophys. Res.-Atmos., 108, 4116–4229, doi:10.1029/2002JD002299, 2003.
Roeckner, E., Brokopf, R., Esch, M., Giorgetta, M., Hagemann, S., Kornblueh, L., Manzini, E., Schlese, U., and Schulzweida, U.: Sensitivity of Simulated Climate to Horizontal and Vertical Resolution in the ECHAM5 Atmosphere Model, J. Climate, 19, 3771–3791, doi:10.1175/JCLI3824.1, 2006.
Rothman, L., Gordon, I., Barbe, A., Benner, D., Bernath, P., Birk, M., Boudon, V., Brown, L., Campargue, A., Champion, J.-P., Chance, K., Coudert, L., Dana, V., Devi, V., Fally, S., Flaud, J.-M., Gamache, R., Goldman, A., Jacquemart, D., Kleiner, I., La-come, N., Lafferty, W., Mandin, J.-Y., Massie, S., Mikhailenko, S., Miller, C., Moazzen-Ahmadi, N., Naumenko, O., Nikitin, A., Orphal, J., Perevalov, V., Perrin, A., Predoi-Cross, A., Rinsland, C., Rotger, M., Šimeˇcková, M., Smith, M., Sung, K., Tashkun, S., Tennyson, J., Toth, R., Vandaele, A., and Auwera, J. V.: The HITRAN 2008 molecular spectroscopic database, J. Quant. Spectrosc. Ra., 110, 533–572, doi:10.1016/j.jqsrt.2009.02.013, hITRAN, 2009.
Rothman, L., Gordon, I., Babikov, Y., Barbe, A., Benner, D. C., Bernath, P., Birk, M., Bizzocchi, L., Boudon, V., Brown, L., Campargue, A., Chance, K., Cohen, E., Coudert, L., Devi, V., Drouin, B., Fayt, A., Flaud, J.-M., Gamache, R., Harrison, J., Hartmann, J.-M., Hill, C., Hodges, J., Jacquemart, D., Jolly, A., Lamouroux, J., Roy, R. L., Li, G., Long, D., Lyulin, O., Mackie, C., Massie, S., Mikhailenko, S., Müller, H., Naumenko, O., Nikitin, A., Orphal, J., Perevalov, V., Perrin, A., Polovtseva, E., Richard, C., Smith, M., Starikova, E., Sung, K., Tashkun, S., Tennyson, J., Toon, G., Tyuterev, V., and Wagner, G.: The HI-TRAN2012 molecular spectroscopic database, J. Quant. Spec-trosc. Ra., 130, 4–50, doi:10.1016/j.jqsrt.2013.07.002, 2013. Sander, R., Kerkweg, A., Jöckel, P., and Lelieveld, J.: Technical
note: The new comprehensive atmospheric chemistry module MECCA, Atmos. Chem. Phys., 5, 445–450, doi:10.5194/acp-5-445-2005, 2005.
Sander, S., Friedl, R., Barker, J., Golden, D., Rylo, M., Wine, P., Abbatt, J., Burkholder, J., Kolb, C. E., d Moortgat, G., Huie, R., and Orkin, V.: Chemical kinetics and photochemical data for use in atmospheric sudies: Evaluation No. 17, JPL Publication 10–6, Jet Propulsion Laboratory, Pasadena, USA, 2011.
Schneider, M., Hase, F., and Blumenstock, T.: Water vapour pro-files by ground-based FTIR spectroscopy: study for an optimised retrieval and its validation, Atmos. Chem. Phys., 6, 811–830, doi:10.5194/acp-6-811-2006, 2006.
Seiler, W. and Fishman, J.: The distribution of carbon monoxide and ozone in the free troposphere, J. Geophys. Res.-Oceans, 86, 7255–7265, doi:10.1029/JC086iC08p07255, 1981.
Update and evaluation, J. Geophys. Res., 105, 8931–8980, doi:10.1029/1999JD901006, 2000.
Sussmann, R., Stremme, W., Buchwitz, M., and de Beek, R.: Val-idation of ENVISAT/SCIAMACHY columnar methane by solar FTIR spectrometry at the Ground-Truthing Station Zugspitze, Atmos. Chem. Phys., 5, 2419–2429, doi:10.5194/acp-5-2419-2005, 2005.
Sussmann, R., Forster, F., Rettinger, M., and Jones, N.: Strategy for high-accuracy-and-precision retrieval of atmospheric methane from the mid-infrared FTIR network, Atmos. Meas. Tech., 4, 1943–1964, doi:10.5194/amt-4-1943-2011, 2011.
Toon, G. C.: The JPL MkIV interferometer, Opt. Photon. News, 2, 19–21, doi:10.1364/OPN.2.10.000019, 1991.
Vidot, J., Landgraf, J., Hasekamp, O., Butz, A., Galli, A., Tol, P., and Aben, I.: Carbon monoxide from shortwave infrared re-flectance measurements: A new retrieval approach for clear sky and partially cloudy atmospheres, Remote Sens. Environ., 120, 255–266, doi:10.1016/j.rse.2011.09.032, 2012.
Wang, Z., Chappellaz, J., Martinerie, P., Park, K., Petrenko, V., Witrant, E., Emmons, L. K., Blunier, T., Brenninkmeijer, C. A. M., and Mak, J. E.: The isotopic record of Northern Hemi-sphere atmospheric carbon monoxide since 1950: implications for the CO budget, Atmos. Chem. Phys., 12, 4365–4377, doi:10.5194/acp-12-4365-2012, 2012.
Washenfelder, R. A., Toon, G. C., Blavier, J.-F., Yang, Z., Allen, N. T., Wennberg, P. O., Vay, S. A., Matross, D. M., and Daube, B. C.: Carbon dioxide column abundances at the Wis-consin Tall Tower site, J. Geophys. Res.-Atmos., 111, D22305, doi:10.1029/2006JD007154, 2006.
Wofsy, S. C.: HIAPER Pole-to-Pole Observations (HIPPO): fine-grained, global-scale measurements of climatically important at-mospheric gases and aerosols, Philos. T. Roy. Soc. A, 369, 2073– 2086, doi:10.1098/rsta.2010.0313, 2011.
Wunch, D., Toon, G. C., Wennberg, P. O., Wofsy, S. C., Stephens, B. B., Fischer, M. L., Uchino, O., Abshire, J. B., Bernath, P., Bi-raud, S. C., Blavier, J.-F. L., Boone, C., Bowman, K. P., Browell, E. V., Campos, T., Connor, B. J., Daube, B. C., Deutscher, N. M., Diao, M., Elkins, J. W., Gerbig, C., Gottlieb, E., Griffith, D. W. T., Hurst, D. F., Jiménez, R., Keppel-Aleks, G., Kort, E. A., Macatangay, R., Machida, T., Matsueda, H., Moore, F., Morino, I., Park, S., Robinson, J., Roehl, C. M., Sawa, Y., Sherlock, V., Sweeney, C., Tanaka, T., and Zondlo, M. A.: Calibration of the Total Carbon Column Observing Network using aircraft pro-file data, Atmos. Meas. Tech., 3, 1351–1362, doi:10.5194/amt-3-1351-2010, 2010.
Wunch, D., Toon, G. C., Blavier, J.-F. L., Washenfelder, R. A., Notholt, J., Connor, B. J., Griffith, D. W. T., Sherlock, V., and Wennberg, P. O.: The Total Carbon Column Ob-serving Network, Philos. T. Roy. Soc. A, 369, 2087–2112, doi:10.1098/rsta.2010.0240, 2011.