SCHOOL - SITE ACCOUNTABILITY: THE LANGUAGE USED IN SCHOOLS Valbona Nathanaili
European University of Tirana, Blv. “Gjergj Fishta”, Nd. 70, H 1, Tirana, Albania
Abstract
This study examines the variety of ways in which teachers express their own accountability. Based on the language used by teachers, the study aims to explicate how school-site accountability is perceived by the teachers. Factors to be analyzed: the content of each answer, based on three dimensions: 1.individual conceptions of responsibility; 2.shared expectations among school participant and stakeholders 3.internal & external accountability mechanisms (formal or informal). Survey data were taken from a sample consisted of 91 teachers, who filled in a self-report and respond the same question: As a teacher, what are you accountable for? The open-ended answer was limited in no more that 5 sentences. The results show that there is a little cohesion among the teachers; the used language is very different and it converges in individual responsibility; the accountability is constructed, mostly, on personal values and beliefs.
Key words: school-site accountability, strategy, responsibility, teacher, language used
1. INTRODUCTION AND LITERATURE REVIEW
Recently, accountability has been the dominant feature of very reform efforts in schools (Elmore, 2007; Wagner, 1998). For Wagner (1989:16-8), the pressure for more accountability in education can be traced to two basic concerns: a. the over rising costs in public services and whether they are justified by educational outcomes; b. schools are failing for an unacceptable number of youths. The specific nature of an accountability policy, mechanism or tool depends on the answers to five questions: 1.What level of accountability is called for? 2. Who is expected to provide the account? 3. To whom is the account owed? 4. What is to be accounted for? 5. What are the consequences of providing an account? (Wagner, quoted in Leithwood, 2005). Elmore (2007: 133-8) differ internal accountability from the external one. In his work, Elmore (Ibid:138) explains that internal accountability (school – site accountability) has three main dimensions: 1.individual conceptions of responsibility; 2.shared expectations among school participant and stakeholders 3.internal & external accountability mechanisms (formal or informal). For Elmore, understanding these factors (Ibid, 192) is a major precondition to understanding how and why schools respond the way they do to external pressures for accountability.
2. THE PURPOSE OF THE RESEARCH AND HYPOTHESES
This study was inspired by one of the works of Richard Elmore, “When accountability knocks, will anyone answer” (Elmore, 2007: 133-200). The start point is that schools, in response to external systems of accountability, construct their own internal systems of accountability, or site-school accountability, which may be strong/ collective or weak/ atomized. The site-school accountability system is analyzed through the language used by teacher. From the five answers that define accountability policy is taken in consideration only the one, given to: What is to be accounted for? There was not part of the study a preliminary introduction/explanation of the accountability definition to the teachers. Based on the language used by teachers, the study aims to explicate: how much the individual conceptions of accountability are uniform, based on the same coded methodology of 16 items and measured through them. The hypothesis is that schools construct their own accountability, shaped more from the individual beliefs and values of teachers (individual conceptions of responsibility).
3. METHODOLOGY
The research has quantitative nature and is content analysis. Survey data were taken from a sample (ad libitum) consisted of 91 teachers, part of 3 school of Tirana city, who filled in a self-report questionnaire and responded the same question: As a teacher, what are you accountable for? The open-ended answer was limited in no more that 5 sentences. The type of three schools was the same: 9- years’ schools. The chosen schools were suggested by the Directory of Tirana City, upon request. Each of the schools, for ethical purpose, is named, respectively, 1, 2 and 3.
In order to distinguish, as much as possible, the fine variations of language used and to have a precise estimation of the degree of uniformity, all the answers of teachers was coded through 17 indicators (items):
1. Security of pupils in school environment 2. Pupils must feel good during instruction time 3. Achievement of pupils in “my” subject 4.Without answer 5. The quality of teaching 6. Citizenship education/ education proces 7. Class management 8. Relationship 9. Order in school 10. Be correct, as teacher, at school 11. Documentation 12. Program/ objective 13. Professional development 14. Care for child health 15. Pupils Wellbeing 16. For my pupils 17. Evaluation process.
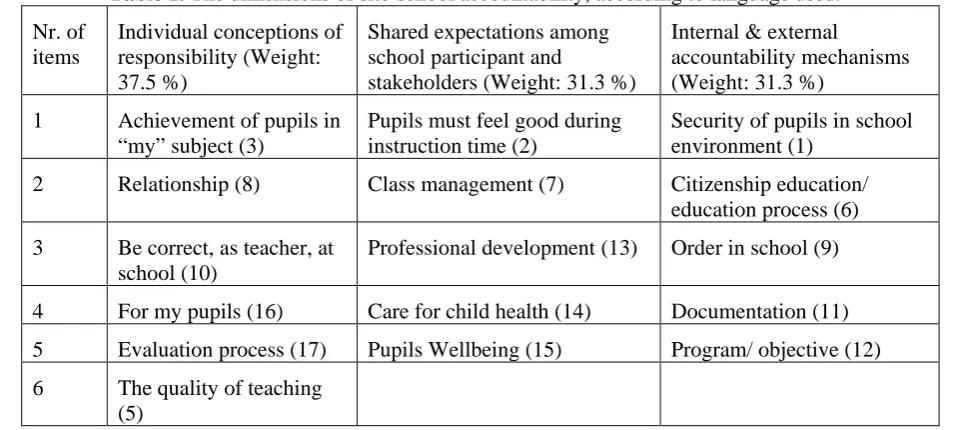
Each of the indicators (items) is clustered in one of three Elmore dimensions (aspects) of accountability. A very strong criterion for classifying an item in one or other dimension was the language used from teachers. For example, the all answers that have as part “the quality of teaching”, the language used was very personal, referring “the quality of teaching” as individual achievement, from the personal perspective and not as a expectations or pressure from outside.
Table 1. The dimensions of site-school accountability, according to language used. Nr. of
items
Individual conceptions of responsibility (Weight: 37.5 %)
Shared expectations among school participant and
stakeholders (Weight: 31.3 %)
Internal & external
accountability mechanisms (Weight: 31.3 %)
1 Achievement of pupils in “my” subject (3)
Pupils must feel good during instruction time (2)
Security of pupils in school environment (1)
2 Relationship (8) Class management (7) Citizenship education/ education process (6)
3 Be correct, as teacher, at school (10)
Professional development (13) Order in school (9)
4 For my pupils (16) Care for child health (14) Documentation (11)
5 Evaluation process (17) Pupils Wellbeing (15) Program/ objective (12)
6 The quality of teaching (5)
4. MEASURES
The data analyses are made on SSPS and are applied some simple statistical techniques. Each of these dimensions, was scored into a scale from 0-5 (0, the answer doesn’t contain any of the items; 1, the answer contains one item; 4 the answer contains four items).
Example a: The answer of teacher 1 from school 1 was: I am accountable for the security of pupils at school environment; they must for feel good during instruction time; for the realization of minimal curriculum objectives. This answer was coded as: security of pupils at school environment = accountability mechanisms; must for feel good during instruction time = shared expectations; realization of minimal curriculum objectives = Individual responsibility. After, this answer was scored
with 3 items and this scale: 1 (once) accountability mechanisms; 1 (once) shared expectations; 1 (once) Individual responsibility.
Example b: The answer of teacher 9 from school 1 was: I am accountable for the achievements of pupils in “my” subject, relationship at school and pupils must feel good during instruction time. This answer was coded as: the achievements of pupils in “my” subject = Individual responsibility; relationship at school = Individual responsibility; pupils must feel good during instruction time = shared expectations. This answer was scored with 2 items and this scale: 1 (once) shared expectations; 2 (twice) individual responsibility.
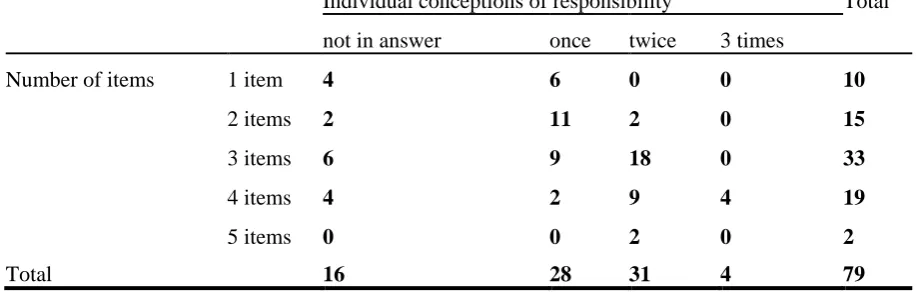
Table 2.1. Individual conceptions of responsibility, how often is used
Individual conceptions of responsibility Total
not in answer once twice 3 times
Number of items 1 item 4 6 0 0 10
2 items 2 11 2 0 15
3 items 6 9 18 0 33
4 items 4 2 9 4 19
5 items 0 0 2 0 2
Total 16 28 31 4 79
Individual conceptions of responsibility
Frequency Percent Valid Percent Cumulative Percent
Valid not in answer 16 17.6 20.3 20.3
once 28 30.8 35.4 55.7
twice 31 34.1 39.2 94.9
3 times 4 4.4 5.1 100.0
Total 79 86.8 100.0
Missing without answer 12 13.2
Total 91 100.0
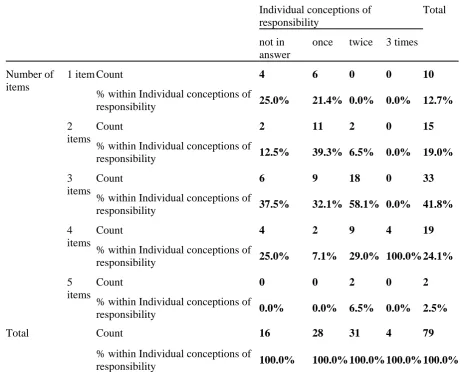
Individual conceptions of responsibility
Total
not in answer
once twice 3 times
Number of items
1 item Count 4 6 0 0 10
% within Individual conceptions of
responsibility 25.0% 21.4% 0.0% 0.0% 12.7%
2 items
Count 2 11 2 0 15
% within Individual conceptions of
responsibility 12.5% 39.3% 6.5% 0.0% 19.0%
3 items
Count 6 9 18 0 33
% within Individual conceptions of
responsibility 37.5% 32.1% 58.1% 0.0% 41.8%
4 items
Count 4 2 9 4 19
% within Individual conceptions of
responsibility 25.0% 7.1% 29.0% 100.0% 24.1%
5 items
Count 0 0 2 0 2
% within Individual conceptions of
responsibility 0.0% 0.0% 6.5% 0.0% 2.5%
Total Count 16 28 31 4 79
% within Individual conceptions of
responsibility 100.0% 100.0% 100.0% 100.0% 100.0%
Table 2.2. Shared expectations among teachers, how often is used
Shared expectations among teachers Total
not in answer once twice
Number of items 1 item 6 4 0 10
2 items 11 3 1 15
3 items 15 14 4 33
4 items 10 7 2 19
5 items 0 1 1 2
Total 42 29 8 79
Shared expectations among teachers
Frequency Percent Valid Percent Cumulative Percent
Valid not in answer 42 46.2 53.2 53.2
once 29 31.9 36.7 89.9
twice 8 8.8 10.1 100.0
Total 79 86.8 100.0
Missing Without answer 12 13.2
Total 91 100.0
Shared expectations among teachers
Total
not in answer once twice
Number of items
1 item Count 6 4 0 10
% within Shared expectations among
teachers 14.3% 13.8% 0.0% 12.7%
2 items Count 11 3 1 15
% within Shared expectations among
teachers 26.2% 10.3% 12.5% 19.0%
3 items Count 15 14 4 33
% within Shared expectations among
teachers 35.7% 48.3% 50.0% 41.8%
4 items Count 10 7 2 19
% within Shared expectations among
teachers 23.8% 24.1% 25.0% 24.1%
5 items Count 0 1 1 2
% within Shared expectations among
teachers 0.0% 3.4% 12.5% 2.5%
Total Count 42 29 8 79
% within Shared expectations among
teachers 100.0% 100.0% 100.0% 100.0%
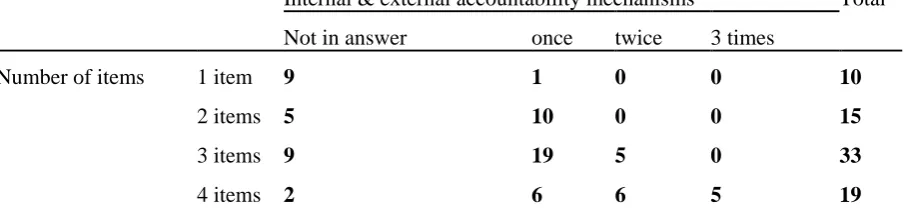
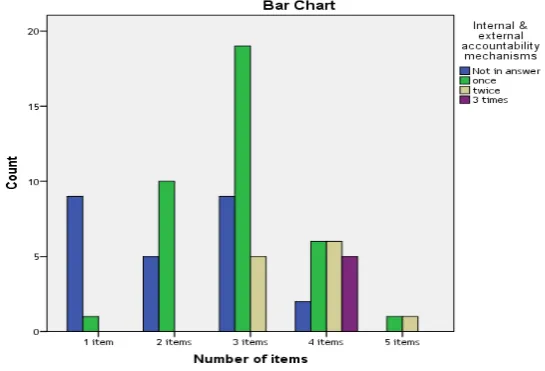
Table 2.3. Internal & external accountability mechanisms, how often is used
Internal & external accountability mechanisms Total
Not in answer once twice 3 times
Number of items 1 item 9 1 0 0 10
2 items 5 10 0 0 15
3 items 9 19 5 0 33
4 items 2 6 6 5 19
5 items 0 1 1 0 2
Total 25 37 12 5 79
Internal & external accountability mechanisms
Frequency Percent Valid Percent Cumulative Percent
Valid Not in answer 25 27.5 31.6 31.6
once 37 40.7 46.8 78.5
twice 12 13.2 15.2 93.7
3 times 5 5.5 6.3 100.0
Total 79 86.8 100.0
Missing without answer 12 13.2
Total 91 100.0
Internal & external accountability mechanisms
Total
Not in answer
once twice 3 times
Number of items
1 item Count 9 1 0 0 10
% within Internal & external
accountability mechanisms 36.0% 2.7% 0.0% 0.0% 12.7% 2
items
Count 5 10 0 0 15
% within Internal & external
accountability mechanisms 20.0% 27.0% 0.0% 0.0% 19.0% 3
items
Count 9 19 5 0 33
% within Internal & external
accountability mechanisms 36.0% 51.4% 41.7% 0.0% 41.8% 4
items
Count 2 6 6 5 19
% within Internal & external
accountability mechanisms 8.0% 16.2% 50.0% 100.0% 24.1% 5
items
Count 0 1 1 0 2
% within Internal & external
accountability mechanisms 0.0% 2.7% 8.3% 0.0% 2.5%
Total Count 25 37 12 5 79
% within Internal & external
accountability mechanisms 100.0% 100.0% 100.0% 100.0% 100.0%
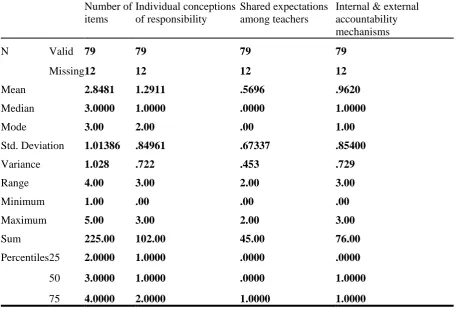
Table 3. Mean, median, mode, std. Deviation, variance, Range, Minimum, Maximum, Sum, Percentiles.
Number of items
Individual conceptions of responsibility
Shared expectations among teachers
Internal & external accountability mechanisms
N Valid 79 79 79 79
Missing 12 12 12 12
Mean 2.8481 1.2911 .5696 .9620
Median 3.0000 1.0000 .0000 1.0000
Mode 3.00 2.00 .00 1.00
Std. Deviation 1.01386 .84961 .67337 .85400
Variance 1.028 .722 .453 .729
Range 4.00 3.00 2.00 3.00
Minimum 1.00 .00 .00 .00
Maximum 5.00 3.00 2.00 3.00
Sum 225.00 102.00 45.00 76.00
Percentiles 25 2.0000 1.0000 .0000 .0000
50 3.0000 1.0000 .0000 1.0000
75 4.0000 2.0000 1.0000 1.0000
Figure 1. The distribution of items for any answer
Figure 2. The Individual conception of responsibility – the distribution for any answer
Figure 3. The shared expectations among teachers – the distribution for any answer
Figure 4. Internal &external accountability mechanism – the distribution for any answer
5. RESULTS
The examination of mean values revealed that number of items containing in each answer is significantly higher than those of each dimension of accountability. So, the language is not uniform. Further, comparing the mean for each of the dimension, Individual conceptions of responsibility has the highest values. Applying Estimated Distribution Parameters we have, respectfully: normal distribution of “Individual conceptions of responsibility” has a location of 1.2911 and scale of .84961; normal distribution of “Shared expectations among teachers” has a location of .5696 and scale of .67337; normal distribution of “Internal & external accountability mechanisms” has a location of .9620 and scale of .85400.
6. DISCUSSION AND CONCLUSIONS
The purpose of the present study was to assess how much the individual conceptions of accountability constructed at school, based on the language used by teacher are uniform. The results show that there is a little cohesion among the teachers; the used language is very different and it converges in individual responsibility; the accountability is constructed, mostly, on personal values and beliefs.
REFERENCES
Elmore, Richard F. (2007) School Reform from the Inside Out. Policy, Practice, and Performance. Cambridge, MA: Harvard Education Press.
Leithwood, K. (2005). Educational Accountability: Issues and Alternatives. OISE, University of Toronto. Retrieved from http://www.saskschoolboards.ca/research/governance/05-01.pdf.
Wagner, Robert B. (1989). Accountability in Education: A Philosophical Inquiry. London: Routledge.