R E S E A R C H A R T I C L E
Open Access
Determinants of excessive daytime
sleepiness in two First Nation communities
Ina van der Spuy
1, Chandima P. Karunanayake
2, James A. Dosman
2,3, Kathleen McMullin
4, Gaungming Zhao
2,
Sylvia Abonyi
5, Donna C. Rennie
2,6, Joshua Lawson
2,3, Shelley Kirychuk
2,3, Judith MacDonald
7, Laurie Jimmy
8,
Niels Koehncke
2,3, Vivian R. Ramsden
9, Mark Fenton
10, Gregory P. Marchildon
11, Malcolm King
12and Punam Pahwa
2,5*Abstract
Background:
Excessive daytime sleepiness may be determined by a number of factors including personal
characteristics, co-morbidities and socio-economic conditions. In this study we identified factors associated with
excessive daytime sleepiness in 2 First Nation communities in rural Saskatchewan.
Methods:
Data for this study were from a 2012
–
13 baseline assessment of the First Nations Lung Health Project,
in collaboration between two Cree First Nation reserve communities in Saskatchewan and researchers at the
University of Saskatchewan. Community research assistants conducted the assessments in two stages. In the first
stage, brochures describing the purpose and nature of the project were distributed on a house by house basis.
In the second stage, all individuals age 17 years and older not attending school in the participating communities
were invited to the local health care center to participate in interviewer-administered questionnaires and clinical
assessments. Excessive daytime sleepiness was defined as Epworth Sleepiness Scale score > 10.
Results:
Of 874 persons studied, 829 had valid Epworth Sleepiness Scale scores. Of these, 91(11.0%) had excessive
daytime sleepiness; 12.4% in women and 9.6% in men. Multivariate logistic regression analysis indicated that
respiratory comorbidities, environmental exposures and loud snoring were significantly associated with excessive
daytime sleepiness.
Conclusions:
Excessive daytime sleepiness in First Nations peoples living on reserves in rural Saskatchewan is
associated with factors related to respiratory co-morbidities, conditions of poverty, and loud snoring.
Keywords:
First Nations, Indigenous, Sleepiness, Epworth sleepiness scale, Co-morbidities, Poverty, Snoring
Background
Excessive daytime sleepiness (EDS) is a common problem
in various populations [1
–
5]. It has been associated with
age [3, 5], sex [5
–
7], body mass index (BMI) [8
–
10], shift
work [11], snoring [12
–
14], comorbidities [15], social
con-ditions [5, 16] and obstructive sleep apnea [2, 17, 18].
Deleterious outcomes of EDS include poor work
perform-ance [19], motor vehicles accidents [20, 21], and work
in-juries [22, 23]. We have recently observed EDS prevalence
of 15.9% to 20.8% in Caucasian populations in rural
Saskatchewan [5, 24]. High rates of EDS have been
docu-mented in New Zealand Maori Indigenous populations
(21.3%) compared to New Zealand non-Maori populations
(13.9%) [25]. Knowledge is limited for First Nations
populations.
First Nations people in Canada characteristically have
high rates of respiratory morbidities, including asthma
and chronic obstructive pulmonary disease (COPD)
[26
–
30]. Among First Nations people living on reserves in
Canada, 59% engaged in non-traditional use of tobacco
(smoking) [31]. Age standardized hospital separation rates
in Western Canada for Indigenous people for all
respira-tory diseases in 2000 were high at 3040/100,000 compared
to 920/100,000 in the general population [27].
* Correspondence:pup165@mail.usask.ca
2Canadian Centre for Health and Safety in Agriculture, University of
Saskatchewan, 104 Clinic Place, Saskatoon, SK S7N 2Z4, Canada
5Department of Community Health and Epidemiology, College of Medicine,
University of Saskatchewan, 107 Wiggins Road, Saskatoon, SK S7N 5E5, Canada
Full list of author information is available at the end of the article
First Nations populations in Canada are characterized
by disadvantaged socio-economic status [32]. The
aver-age annual income in 2010 was $18,586 for on-reserve
First Nations people compared to $41,052 for other
Ca-nadians [32]. Twenty-eight percent of on-reserve First
Nations persons live in crowded housing conditions of
more than one person per room, compared to 4% of
non-Indigenous persons in Canada [33]. Forty-three
per-cent of persons living on-reserves had homes in need of
major repairs [33]. Poor housing conditions are
associ-ated with dampness and mold which may be associassoci-ated
with deleterious respiratory outcomes [27].
In Canada, the term commonly used to refer to people
registered under the Indian Act is
“First Nations”
[34].
There is limited information on EDS among First
Na-tions people in Canada [35]. In 2011, of the 1,033,381
persons in Saskatchewan, 103,205 were First Nations
[36]. The objective of this study was to identify the
prevalence of EDS and to investigate factors contributing
to EDS among adult First Nations people living in two
reserve communities in rural Saskatchewan.
Methods
Study sample
The data for this study are from a 2012–13 baseline
as-sessment of the First Nations Lung Health Project which
was conducted as part of a research collaboration
be-tween two Cree First Nation communities in
Saskatch-ewan and researchers at the University of SaskatchSaskatch-ewan
[37]. The sampling frame was all currently residing
com-munity members based on 321 households with 810
adults in Community A, and 259 households with 760
adults in Community B [37]. Baseline data from 432
adults living in 173 households (53.9% household
par-ticipation rate) in Community A and 442 adults living in
233 households (89.9% household participation rate) in
Community B were obtained. Of 874 persons studied,
829 had valid Epworth Sleepiness Scale scores obtained
from participants aged 17 years and older.
Data acquisition
The study coordinator (KM) is from the LaRonge Cree
First Nation. The clinical aspects of the study were
con-ducted primarily by students from the communities who
were attending post-secondary institutions and who
were available during the summer holiday period. The
students were attending nursing, education and social
work training courses during the school year, and were
trained in the techniques involved at the base laboratory
of the Canadian Centre for Health in Agriculture prior
to the commencement of the study. They were
super-vised by the project coordinator and other research staff.
The baseline assessment was conducted in two stages.
The rationale and purpose of the study were determined
with representatives of the communities including Elders,
community leadership, health provider personnel and
stu-dents. The first stage consisted of introducing the project
to the community by meetings and brochures. In the
sec-ond stage, all individuals age 17 years and older not
at-tending school were invited to the community health care
center for interviewer-administered questionnaires and
participation in clinical assessments. The degree of
sleepi-ness in individuals was based on their response to
Epworth Sleepiness Scale (ESS) questionnaire [38–41].
ESS shows good reliability and validity [39, 41]. We used
an ESS score of 11 to 24 as indicating high ESS score [40]
which we considered the principal outcome. Independent
variables of interest were self-reported age, sex, height,
weight, (BMI, kg/m
2) (overweight BMI = 25–29.9; obese
BMI
≥
30), education level (completed post-secondary,
completed university, completed high school, less than
high school) marital status, non-traditional use of tobacco
(smoking) (current, former, never) and alcohol use.
“Doc-tor ever diagnosed”
conditions included sinus trouble,
heart problem, tuberculosis, attack of bronchitis,
emphy-sema, chronic bronchitis, COPD and asthma. Other
fac-tors elicited by the questionnaire included chronic cough/
chronic phlegm and shortness of breath (SOB), loud
snor-ing, money at end of month, annual household income
level, state of house repairs, and number of persons per
room as an index of crowding. For the analysis, we used
the term
“chronic lung disease”
to include one or more of
emphysema, chronic bronchitis, chronic cough/chronic
phlegm and COPD.
Statistical analysis
Statistical analysis was conducted using SAS version
9.4© (SAS Institute Inc., Cary, NC, USA).
Logistic regression models were used to assess
relation-ships between ESS and covariates. A multilevel logistic
re-gression model by generalized estimating equations
approach was used to fit the model with individuals (first
level) clustering within households (second level). The
sig-nificant contribution of potential risk factors, confounders
and interactive effects was determined by fitting a series of
multilevel models. Variables with
p
< 0.20 in univariate
analysis became candidates for the multivariable model.
The variables retained in the final multivariable model
in-cluded those that were statistically significant (i.e.
p
< 0.05)
as well as sex, non-traditional use of tobacco, and BMI.
Odds ratios (ORs) and 95% confidence intervals (CIs)
were used to present the strength of associations.
Results
35% were obese. Non-traditional use of tobacco (current
smoking) was present in 78.3%, ex-smoking in 12.2%,
and never smoking in 9.5% persons. Loud snoring was
reported by 17.0% men and 14.8% women. There were
91 (11.0%) adults with an ESS score > 10. More women
(12.4%) than men (9.6%) had ESS scores >10.
As shown in Table 1, unadjusted univariate analysis
showed that older age [>55 years of age, OR 4.46 (95%
CI 2.34 to 8.52)] was significantly associated with high
ESS score. With regard to doctor diagnosed conditions
significantly associated with the risk of having high ESS
scores included: sinus trouble [OR 2.24 (95% CI 1.42 to
3.54)], heart problems [OR 2.55 (95% CI 1.47 to 4.41)],
tuberculosis [OR 2.71 (95% CI 1.30 to 5.63)], attack of
bronchitis [OR 2.22 (95% CI 1.38 to 3.56)], chronic lung
disease [OR 2.35 (95% CI 1.51 to 3.64)], and SOB [OR
3.15 (95% CI 1.92 to 5.18)]. Loud snoring [OR 1.68 (95%
CI 1.02 to 2.77)] was also associated with high ESS
scores. House in need of repairs and crowding (more
than one person per room) were significant at
p
< 0.2
and hence included in the multivariate model as
poten-tial confounders.
Multivariable logistic regression analysis (Table 2)
indi-cated a trend towards statistical significance for age
greater than 55 years [OR 2.27 (95% CI 0.94 to 5.52);
p
= 0.07]. Doctor ever diagnosed tuberculosis [OR 3.02
(95% CI 1.32 to 6.87)] was significantly related to high
ESS. Chronic lung disease [OR 2.01 (95% CI 1.15 to
3.50)] and SOB [OR 2.76 (95% CI 1.52 to 4.99)] were
significantly related to high ESS scores. Loud snoring
[OR 2.21 (95% CI 1.13 to 4.33)] continued to be an
asso-ciated condition. Socio-economic factors of low income
[OR 2.59 (95% CI 1.20 to 5.60)], house in need of repairs
[OR 2.40 (95% CI 1.18 to 4.87)] and more than one
person per room [OR 2.07 (95% CI 1.16 to 3.69)] were
significantly associated with high ESS scores. There were
no associations for BMI and smoking with high ESS
scores.
Discussion
The findings from this study highlight the strong
associ-ations of certain respiratory co-morbidities, indicators of
poverty and snoring with EDS among people living on
two on-reserve First Nation communities in the
Prov-ince of Saskatchewan in Canada.
In addition, annual household income (less than
$10,000 per year), houses in need of repairs, and
over-crowding, all indicators of social determinants of health
consistent with poverty [42–44] were associated with high
ESS scores. The relationship of poverty to sleep
disturb-ance has been described for non-Indigenous populations
[45–47]. Social determinants of health of which low
socio-economic status is one, are associated with co-morbidities
[48–50]. Respiratory co-morbidities associated with EDS
in the present study were doctor ever diagnosed
tubercu-losis, reported chronic lung disease, and SOB. The
signifi-cant relationship between SOB and EDS in our study is
consistent with the observations of Kaneita et al. [51] The
association between EDS and chronic lung disease in our
study is consistent with the findings of Karachaliou et al.
[52] and Koutsourelakis et al. [53] We did not find reports
linking past tuberculosis with high ESS score. However,
chronic lung disease has been observed in former
tubercu-losis patients [54], and it is possible that the apparent
rela-tionship between past tuberculosis and high ESS score in
our study is as a result of chronic lung disease in former
tuberculosis patients.
In the univariate analysis, older age (
≥
55 years of age)
was associated with high ESS score. In the multivariate
analysis borderline significance for age persisted.
In-creasing age is recognized as being associated with
in-creased risk for EDS [3, 5]. The prevalence of high ESS
scores in this fairly young population (men 33.7 years,
women 35.9 years) that we studied was 11.0%. The
prevalence of high ESS score (25.9%) in the oldest
(>55 year) age group was higher than in the
non-Indigenous population (18.5%) of rural Saskatchewan
de-scribed by Gjevre et al. [5], and more like that dede-scribed
by Paine et al. for the Maori population (21.3%) in New
Zealand [25].
Obesity has been identified as an independent
pre-dictor of EDS in both men and women.
9,[55, 56]
How-ever, in our study the effect of overweight and obesity on
high ESS scores was not statistically significant, likely
due to lack of variability with 64% of the population
be-ing either overweight or obese. Followbe-ing discussion
with the communities, the high percentage of obesity
can be addressed in future by the introduction of
health-ier eating and exercise programs.
The significance of EDS for the health of the
popula-tions participated is important to consider. EDS is a
hallmark feature of obstructive sleep apnea [2, 17, 18].
Among those with high ESS scores in the populations that
we studied, there may be a high prevalence of
undiag-nosed and untreated sleep disordered breathing with all of
the implications for cardiovascular outcomes [57, 58] and
accidents [22, 59, 60].
Table 1
Univariate associations between ESS score > 10 and independent variables of interest
aVariables ESS Score,n(%) Univariate OR
(95% CI) Normal (n= 738) Abnormal (n= 91)
Demographics
Sex
Female (reference) 369 (87.6) 52 (12.4) 1.00
Male 369 (90.4) 39 (9.6) 0.76 (0.48–1.20)
Age, in years
17–25 (reference) 266 (92.7) 21 (7.3) 1.00
26–35 180 (88.2) 24 (11.8) 1.71 (0.90–3.26)
36–45 119 (89.5) 14 (10.5) 1.45 (0.69–3.03)
46–55 113 (91.1) 11 (8.9) 1.30 (0.58–2.90)
> 55 60 (74.1) 21 (25.9) 4.46 (2.34–8.52)
Educational level
Completed postsecondary education (reference) 103 (88.8) 13 (11.2) 1.00
Completed university 89 (88.1) 12 (11.9) 1.02 (0.41–2.53)
Completed high school 191 (92.7) 15 (7.3) 0.61 (0.26–1.43)
Less than high school 354 (87.6) 50 (12.4) 1.12 (0.56–2.25)
Marital status
Widowed/divorced/separated/single (reference) 430 (88.5) 56 (11.5) 1.00
Married/common in law 288 (89.4) 34 (10.6) 0.88 (0.56–1.38)
Body mass index, kg/m2
Normal (<25) (reference) 251 (90.0) 28 (10.0) 1.00
Overweight (25–29.9) 213 (88.4) 28 (11.6) 1.14 (0.64–2.05)
Obese (≥30) 258 (88.4) 34 (11.6) 1.15 (0.68–1.95)
Smoke status
Non-smoker (reference) 68 (86.1) 11 (13.9) 1.00
Ex-smoker 85 (84.2) 16 (15.8) 1.27 (0.51–3.16)
Current smoker 585 (90.1) 64 (9.9) 0.72 (0.36–1.42)
In past 12 months, had≥5 drinks on one occasion
No (reference) 156 (88.1) 21 (11.9) 1.00
Yes 579 (89.6) 67 (10.4) 0.84 (0.50–1.41)
Employment status
Yes (reference) 388 (89.2) 47 (10.8) 1.00
No 346 (88.7) 44 (11.3) 1.05 (0.67–1.64)
Doctor ever diagnosed:
Sinus trouble
No (reference) 470 (91.8) 42 (8.2) 1.00
Yes 189 (83.3) 38 (16.7) 2.24 (1.42–3.54)
Heart problem
No (reference) 674 (90.2) 73 (9.8) 1.00
Yes 62 (78.5) 17 (21.5) 2.55 (1.47–4.41)
Tuberculosis
No (reference) 597 (90.5) 63 (9.5) 1.00
exposure associated with dampness in these homes could
result in upper airway inflammation [66, 67] thus acting
by a similar mechanism. Cigarette smoking may enhance
OSA [68] with consequent increased EDS. But like our
finding for BMI, smoking was not a significant contributor
to EDS, likely because smoking was highly prevalent in
the population (78.3% current smokers; 12.2% ex-smokers).
The high prevalence of non-traditional use of tobacco
(smoking) is being address by a community-chosen
inter-vention called the
“Green Light Program”. The Green Light
Program is an evidence-informed, community-level
inter-vention which identifies and celebrates homes that are
smoke-free. Currently, in excess of 50% of the homes in
both communities are smoke-free.
Certain strengths and limitations apply to our study.
Strengths include the size of the populations studied,
and the consistently strong of associations with
respira-tory co-morbidities, indices of social determinants of
health, and snoring. This study adds to a small but
growing body of knowledge on sleep issues affecting
Table 1
Univariate associations between ESS score > 10 and independent variables of interest
a(Continued)
Variables ESS Score,n(%) Univariate OR
(95% CI) Normal (n= 738) Abnormal (n= 91)
Attack of bronchitis
No (reference) 466 (91.6) 43 (8.4) 1.00
Yes 180 (82.9) 37 (17.1) 2.22 (1.38–3.56)
Ever had asthma
No (reference) 616 (89.3) 74 (10.7) 1.00
Yes 122 (87.8) 17 (12.2) 1.12 (0.64–1.95)
Questionnaire ascertained conditions
Chronic Lung Diseaseb
No (reference) 554 (91.6) 51 (8.4) 1.00
Yes 184 (82.1) 40 (17.9) 2.35 (1.51–3.64)
SOB
No (reference) 367 (94.3) 22 (5.7) 1.00
Yes 365 (84.1) 69 (15.9) 3.15 (1.92–5.18)
Loud snoring
No (reference) 626 (89.9) 70 (10.1) 1.00
Yes 110 (84.0) 21 (16.0) 1.68 (1.02–2.77)
Socio-economic Status
Money left over at end of the month
Some (reference) 188 (86.2) 30 (13.8) 1.00
Just enough 171 (90.5) 18 (9.5) 0.64 (0.34–1.22)
Not enough 340 (90.2) 37 (9.8) 0.65 (0.37–1.15)
Annual household income
$20,000 and over (reference) 199 (91.7) 18 (8.3) 1.00
$10,000–$19,999 106 (86.9) 16 (13.1) 1.58 (0.76–3.27)
Less than $10,000 188 (85.8) 31 (14.2) 1.75 (0.88–3.47)
Refusal/not stated 245 (90.4) 26 (9.6) 1.09 (0.54–2.19)
Home need repairing
No (reference) 205 (89.5) 24 (10.5) 1.00
Minor 188 (85.1) 33 (14.9) 1.51 (0.82–2.80)
Major 188 (85.1) 28 (8.7) 0.81 (0.46–1.43)
Home crowded status (person per room)
one or less person per room (reference) 188 (85.1) 52 (9.7) 1.00
More than one person per room 215 (86.3) 34 (13.7) 1.44 (0.88-2.36)
a
Row percentages are presented
b“
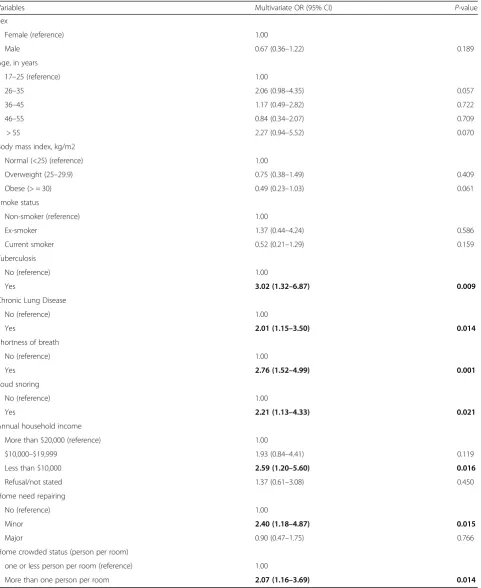
Table 2
Multivariable logistic regression of the association between ESS score > 10 and independent variables of interest
Variables Multivariate OR (95% CI) P-value
Sex
Female (reference) 1.00
Male 0.67 (0.36–1.22) 0.189
Age, in years
17–25 (reference) 1.00
26–35 2.06 (0.98–4.35) 0.057
36–45 1.17 (0.49–2.82) 0.722
46–55 0.84 (0.34–2.07) 0.709
> 55 2.27 (0.94–5.52) 0.070
Body mass index, kg/m2
Normal (<25) (reference) 1.00
Overweight (25–29.9) 0.75 (0.38–1.49) 0.409
Obese (> = 30) 0.49 (0.23–1.03) 0.061
Smoke status
Non-smoker (reference) 1.00
Ex-smoker 1.37 (0.44–4.24) 0.586
Current smoker 0.52 (0.21–1.29) 0.159
Tuberculosis
No (reference) 1.00
Yes 3.02 (1.32–6.87) 0.009
Chronic Lung Disease
No (reference) 1.00
Yes 2.01 (1.15–3.50) 0.014
Shortness of breath
No (reference) 1.00
Yes 2.76 (1.52–4.99) 0.001
Loud snoring
No (reference) 1.00
Yes 2.21 (1.13–4.33) 0.021
Annual household income
More than $20,000 (reference) 1.00
$10,000–$19,999 1.93 (0.84–4.41) 0.119
Less than $10,000 2.59 (1.20–5.60) 0.016
Refusal/not stated 1.37 (0.61–3.08) 0.450
Home need repairing
No (reference) 1.00
Minor 2.40 (1.18–4.87) 0.015
Major 0.90 (0.47–1.75) 0.766
Home crowded status (person per room)
one or less person per room (reference) 1.00
Indigenous populations. A major limitation is the
recall-bias of medical history due to the cross-sectional
nature of the study. One of other limitations is
infor-mation bias due to conducting the study in First Nation
communities. That is, we hired local people to conduct
the interviews and closeness among community
mem-bers could lead to information bias. Response rates for
household surveys and individual surveys in
Commu-nity A were lower compared to CommuCommu-nity B.
Com-pared to Community B, Community A is spread over a
much wider area of land resulting in lower response
rates due to difficulties in access to the health clinic
[37]. Other potential limitation of the study is the lack
of validation of the ESS in First Nations people. While
all the younger people in this study spoke English, on
site interpretation was required for some of the older
participants. It is possible that the ESS may be a
cultur-ally sensitive tool [69], with potential observer bias
when used in non-Caucasian cultures.
Conclusions
This study demonstrates relationships between
respira-tory co-morbidities and environmental exposures, and
EDS in two First Nation communities. It is imperative to
validate the use of the ESS in and with First Nations
people. An important priority is to work with the
com-munities involved to elucidate the burden of sleep
disor-ders among First Nations people living on reserves so
that the tools can be shared and used in and with other
First Nation communities in Canada.
Abbreviations
BMI:Body Mass Index; COPD: Chronic Obstructive Pulmonary Disease; EDS: Excessive Daytime Sleepiness; ESS: Epworth Sleepiness Scale; SOB: Shortness of Breath
Acknowledgements
We are grateful for the contributions of Elders, community leaders that facilitated the engagement necessary for the study, and all individuals who donated their time to participate. The First Nations Lung Health Project was funded by a grant from the Canadian Institutes of Health Research“Assess, Redress, Re-assess: Addressing Disparities in Respiratory Health among First Nations People”, CIHR MOP-246983-ABH-CCAA-11829. The team consists of: James Dosman, MD (Designated Principal Investigator, University of Saskatch-ewan, Saskatoon, SK Canada); Punam Pahwa, PhD (Co-Principal Investigator, University of Saskatchewan, Saskatoon SK Canada); Late Jo-Ann Episkenew, PhD (Co-Principal Investigator), Former Director of Indigenous People’s Health Research Centre, University of Regina, SK Canada), Sylvia Abonyi, PhD (Co-Principal Investigator, University of Saskatchewan, Saskatoon, SK Canada); Co-Investigators: Mark Fenton, MD, Bonnie Janzen, PhD, Chandima Karuna-nayake, PhD, Malcolm King, PhD, Shelly Kirychuk, PhD, Niels Koehncke, MD, Joshua Lawson, PhD, Greg Marchildon, PhD, Lesley McBain, PhD, Donna Rennie, PhD, Vivian R Ramsden, RN, PhD, Ambikaipakan Senthilselvan, PhD; Collaborators: Amy Zarzeczny, BA, LLM; Louise Hagel, MSc, Breanna Davis, MD, John Dosman, MD, Roland Dyck, MD, Thomas Smith-Windsor, MD, Wil-liam Albritton, MD, PhD; External Advisor: Janet Smylie, MD, MPH; Project Manager: Kathleen McMullin, MEd; Community Partners: Jeremy Seeseequa-sis, BA; Laurie Jimmy, RN; Judith Macdonald, RN, BScN; Arnold Naytowhow.
Funding
The First Nations Lung Health Project was funded by a grant from the Canadian Institutes of Health Research -“Assess, Redress, Re-assess:
Addressing Disparities in Respiratory Health among First Nations People,” Canadian Institutes of Health Research MOP-246983-ABH-CCAA-11829. Princi-pal Investigator: James A Dosman; Co-PrinciPrinci-pal Investigators: Punam Pahwa, Sylvia Abonyi, Jo-Ann Episkenew.
Availability of data and materials
The datasets generated and/or analyzed during the current study are not publicly available.
Authors contributions
JAD, SA, DCR, JL, SK contributed substantially to the study design, acquisition of data and interpretation, and the writing of the manuscript. PP and CPK contributed substantially to the study design, acquisition of data, data analysis and interpretation, and the writing of the manuscript. KM, JM, LJ contributed to acquisition of data and manuscript preparation. IvdS and GZ contributed to data analysis, interpretation and manuscript preparation. VRR contributed to interpretation of data and manuscript preparation. NK, MF, GPM and MK contributed to study design, interpretation and manuscript preparation. All authors have read and approved the final manuscript.
Ethics approval and consent to participate
The study was approved by the Biomedical Research Ethics Board of the University of Saskatchewan (Certificate No. Bio #12–89) and adhered to Chapter 9 criteria of the Canadian Tri-Council requirements for conducting research with Indigenous people. Written consent was obtained from all participants.
Consent for publication
Not applicable.
Competing interests
The authors declare that they have no competing interests.
Publisher
’
s Note
Springer Nature remains neutral with regard to jurisdictional claims in published maps and institutional affiliations.
Author details
1School of Physical Therapy, University of Saskatchewan, 104 Clinic Place,
Saskatoon, SK S7N 2Z4, Canada.2Canadian Centre for Health and Safety in Agriculture, University of Saskatchewan, 104 Clinic Place, Saskatoon, SK S7N 2Z4, Canada.3Department of Medicine, College of Medicine, University of Saskatchewan, 103 Hospital Drive, Saskatoon, SK S7N 0W8, Canada.4First
Nations University of Canada, Prince Albert Campus, 1301 Central Avenue, Prince Albert, SK S6V 4W1, Canada.5Department of Community Health and
Epidemiology, College of Medicine, University of Saskatchewan, 107 Wiggins Road, Saskatoon, SK S7N 5E5, Canada.6College of Nursing, University of
Saskatchewan, 104 Clinic Place, Saskatoon, SK S7N 2Z4, Canada.7Community A, Duck Lake, Saskatoon, SK, Canada.8Community B, Montreal Lake,
Saskatoon, SK, Canada.9Department of Academic Family Medicine, University of Saskatchewan, West Winds Primary Health Centre, 3311 Fairlight Drive, Saskatoon, SK S7M 3Y5, Canada.10Division of Respirology, Critical Care and Sleep Medicine, Department of Medicine, College of Medicine, University of Saskatchewan, 103 Hospital Drive, Saskatoon, SK S7N 0W8, Canada.11Institute of Health Policy, Management and Evaluation, University of Toronto, Suite 425, 155 College Street, Toronto, ON M5T 3M6, Canada.12Faculty of Health Sciences, Simon Fraser University, 8888 University Drive, Burnaby, BC V5A 1S6, Canada.
Received: 10 July 2017 Accepted: 29 November 2017
References
1. Ford ES, Cunningham TJ, Giles WH, Croft JB. Trends in insomnia and excessive daytime sleepiness among U.S. adults from 2002 to 2012. Sleep Med. 2015;16(3):372–8.
3. Joo S, Baik I, Yi H, Jung K, Kim J, Shin C. Prevalence of excessive daytime sleepiness and associated factors in the adult population of Korea. Sleep Med. 2009;10(2):182–8.
4. Nugent AM, Gleadhill I, McCrum E, Patterson CC, Evans A, MacMahon J. Sleep complaints and risk factors for excessive daytime sleepiness in adult males in Northern Ireland. J Sleep Res. 2001;10(1):69–74.
5. Gjevre JA, Pahwa P, Karunanayake C, et al. Excessive daytime sleepiness among rural residents in Saskatchewan. Can Respir J. 2014;21(4):227–33. 6. Vashum KP, McEvoy MA, Hancock SJ, et al. Prevalence of and associations
with excessive daytime sleepiness in an Australian older population. Asia Pac J Public Health. 2015;27(2):NP2275–84.
7. Larsson LG, Lindberg A, Franklin KA, Lundbäck B. Gender differences in symptoms related to sleep apnea in a general population and in relation to referral to sleep clinic. Chest. 2003;124(1):204–11.
8. Dagan Y, Doljansky JT, Green A, Weiner A. Body mass index (BMI) as a first-line screening criterion for detection of excessive daytime sleepiness among professional drivers. Traffic Inj Prev. 2006;7(1):44–8.
9. Mokhber S, Ravanbakhsh PZ, Jesmi F, Pishgahroudsari M, Jolfaei AG, Pazouki A. Comparing the excessive daytime sleepiness of obese and non-obese patients. Iran Red Crescent Med J. 2016;18(7):e21964.
10. Hayley AC, Williams LJ, Kennedy GA, Berk M, Brennan SL, Pasco JA. Excessive daytime sleepiness and body composition: a population-based study of adults. PLoS One. 2014;9(11):e112238.
11. Fanfulla F, Grassi M, Marandola P, Taino G, Fulgoni P, Imbrani M. Excessive daytime sleepiness works together with other sleep disorders in
determining sleepiness-related events in shift workers. G Ital Med Lav Ergon. 2013;35(3):151–6.
12. Kalchiem-Dekel O, Westreich R, Regev A, Novack V, Goldberg M, Maimon N. Snoring intensity and excessive daytime sleepiness in subjects without obstructive sleep apnea. Laryngoscope. 2016;126(7):1696–701. 13. Theorell-Haglöw J, Akerstedt T, Schwarz J, Lindberg E. Predictors for
development of excessive daytime sleepiness in women: a population-based 10-year follow-up. Sleep. 2015;38(12):1995–2003.
14. Svensson M, Franklin KA, Theorell-Haglöw J, Lindberg E. Daytime sleepiness relates to snoring independent of the apnea-hypopnea index in women from the general population. Chest. 2008;134(5):919–24.
15. Klobučníková K,Šiarnik P,Čarnická Z, Kollár B, Turčáni P. Causes of excessive daytime sleepiness in patients with acute stroke - a polysomnographic study. J stroke. Cerebrovascular Dis. 2016;25(1):83–6.
16. Gander PH, Marshall NS, Harris R, Reid P. The Epworth sleepiness scale: influence of age, ethnicity, and socioeconomic deprivation. Epworth sleepiness scores of adults in New Zealand. Sleep. 2005;28(2):249–53. 17. Cai S, Chen R, Zhang Y, et al. Correlation of Epworth sleepiness scale with
multiple sleep latency test and its diagnostic accuracy in assessing excessive daytime sleepiness in patients with obstructive sleep apnea hypopnea syndrome. Chin Med J. 2013;126(17):3245–50.
18. Ramar K, Guilleminault C. Excessive daytime sleepiness and obstructive sleep apnea syndrome. Sleep Med Clin. 2006;1:63–78.
19. Ulfberg J, Carter N, Talback M, Edling C. Excessive daytime sleepiness at work and subjective work performance in the general population and among heavy snorers and patients with obstructive sleep apnea. Chest. 1996;110(3):659–63.
20. Zwahlen D, Jackowski C, Pfäffli M. Sleepiness, driving, and motor vehicle accidents: a questionnaire-based survey. J Forensic Legal Med. 2016;44:183–7. 21. Ward KL, Hillman DR, James A, et al. Excessive daytime sleepiness increases the risk of motor vehicle crash in obstructive sleep apnea. J Clin Sleep Med. 2013;9(10):1013–21.
22. King N, Pickett W, Hagel L, Lawson J, Trask C, Dosman JA. Impact of excessive daytime sleepiness on the safety and health of farmers in Saskatchewan. Can Respir J. 2014;21(6):363–9.
23. Uehli K, Mehta AJ, Miedinger D, et al. Sleep problems and work injuries: a systematic review and meta-analysis. Sleep Med Rev. 2014;18:61–73. 24. Pahwa P, Karunanayake CP, Hagel L, et al. Prevalence of high Epworth
sleepiness scale scores in a rural population. Can Respir J. 2012;19(2):e10–4. 25. Paine SJ, Gander PH, Harris RB, Reid P. Prevalence and consequences of
insomnia in New Zealand: disparities between Maori and non-Maori. Aust N Z J Public Health. 2005;29(1):22–8.
26. Sin DD, Wells H, Svenson LW, Man SFP. Asthma and COPD among aboriginals in Alberta. Canada Chest. 2002;121(6):1841–6.
27. Health Canada. A Statistical Profile on the Health of First Nations in Canada: Health Services Utilization in Western Canada, 2000. Health
Canada: Ottawa, ON 2009. http://www.hc-sc.gc.ca/fniah-spnia/alt_ formats/fnihb-dgspni/pdf/pubs/aborig-autoch/2009-stats-profil-vol2-eng.pdf.
28. Canada H. A statistical profile on the health of First Nations in Canada: determinants of health 1999–2003. Report no.: 3555. Ottawa, ON: Health Canada; 2009. Available from: http://www.hc-sc.gc.ca/fniah-spnia/alt_ formats/fnihb-dgspni/pdf/pubs/aborig-autoch/2009-stats-profil-eng.pdf 29. Reading CL, Wien E. Health inequalities and social determinants of
aboriginal peoples’health. Prince George, BC, Canada: National
Collaborating Centre for Aboriginal Health; 2009. https://www.ccnsa-nccah. ca/docs/determinants/RPT-HealthInequalities-Reading-Wien-EN.pdf 30. Ellis E, Gallant V, Miron M, Phypers M, Scholten D. Special report of
the Canadian Tuberculosis Committee. Tuberculosis among the Aboriginal People of Canada, 2000 to 2004. In tuberculosis in Canada. Public Health Agency of Canada: Ottawa, ON, 2007. Available from: http://publications.gc.ca/collections/collection_2008/phac-aspc/HP37-5-2004E.pdf.
31. Haché T. Commercial Tobacco in First Nations & Inuit Communities. Toronto: Non-Smokers’Rights Association/ Smoking and Health Action Foundation, 2009. Available from: https://nsra-adnf.ca/wp-content/uploads/2016/08/ Commercial_Tobacco_in_First_Nations_and_Inuit_Communities.pdf. 32. The National Aboriginal Economic Development Board. The aboriginal
economic progress report 2015. 2015. Available from: http:// cfarsociety.ca/wp-content/uploads/2015/04/NAEDB-progress-report-june-2015.pdf
33. Kelly-Scott K, Smith K. Aboriginal peoples: fact sheet for Canada. Ottawa, ON: Statistics Canada; 2015. Available from: http://www.statcan.gc.ca/pub/ 89-656-x/89-656-x2015001-eng.htm#a5
34. Indigenous and northern affairs Canada. Indigenous peoples and communities. Terminology. 2012. Available from: https://www.aadnc-aandc. gc.ca/eng/1100100013785/1304467449155.
35. Froese CL, Butt A, Mulgrew A, et al. Depression and sleep-related symptoms in an adult, indigenous, north American population. J Clin Sleep Med. 2008; 4(4):356–61.
36. Government of Saskatchewan. Saskatchewan Aboriginal Peoples. 2011. Available from: http://www.stats.gov.sk.ca/stats/pop/
2011Aboriginal%20People.pdf.
37. Pahwa P, Abonyi S, Karunanayake C, et al. A community-based participatory research methodology to address, redress, and reassess disparities in respiratory health among First Nations. BMC Res Notes. 2015;8:199. 38. Johns MWA. New method for measuring daytime sleepiness: the Epworth
sleepiness scale. Sleep. 1991;14(6):540–5.
39. Johns MW. Reliability and factor analysis of the Epworth sleepiness scale. Sleep. 1992;15(4):376–81.
40. Johns MW. Daytime sleepiness, snoring, and obstructive sleep apnea. The Epworth sleepiness scale. Chest. 1993;103(1):30–6.
41. Johns MW. Sleepiness in different situations measured by the Epworth sleepiness scale. Sleep. 1994;17(8):703–10.
42. Chaudry A, Wimer C. Poverty is not just an indicator: the relationship between income, poverty, and child well-being. Acad Pediatr. 2016;16(3 Suppl):S23–9. 43. Kovesi T. Respiratory disease in Canadian first nations and Inuit children.
Paediatr Child Health. 2012;17(7):376–80.
44. Levy H. Income, poverty, and material hardship among older Americans. RSF. 2015;1(1):55–77.
45. Grandner MA, Patel NP, Gehrman PR, et al. Who gets the best sleep? Ethnic and socioeconomic factors related to sleep complaints. Sleep Med. 2010; 11(5):470–8.
46. Umlauf MG, Bolland AC, Bolland KA, Tomek S, Bolland JM. The effects of age, gender, hopelessness, and exposure to violence on sleep disorder symptoms and daytime sleepiness among adolescents in impoverished neighborhoods. J youth. Adolescence. 2015;44(2):518–42.
47. Grandner MA, Williams NJ, Knutson KL, Roberts D, Jean-Louis G. Sleep disparity, race/ethnicity, and socioeconomic position. Sleep Med. 2016;18:7–18. 48. Leone T, Coast E, Narayanan S, de Graft Aikins A. Diabetes and depression
comorbidity and socio-economic status in low and middle income countries (LMICs): a mapping of the evidence. Glob Health. 2012;8:39. 49. Leigh JP, Are DJ. Low wages risk factors for hypertension? Eur J Pub Health.
2012;22(6):854–9.
51. Kaneita Y, Ohida T, Uchiyama M, et al. Excessive daytime sleepiness among the Japanese general population. J Epidemiol. 2005;15(1):1–8.
52. Karachaliou F, Kostikas K, Pastaka C, Bagiatis V, Gourgoulianis KI. Prevalence of sleep-related symptoms in a primary care population - their relation to asthma and COPD. Prim Care Respir J. 2007;16(4):222–8.
53. Koutsourelakis I, Perraki E, Bonakis A, Vagiakis E, Roussos C, Zakynthinos S. Determinants of subjective sleepiness in suspected obstructive sleep apnoea. J Sleep Res. 2008;17(4):437–43.
54. Lee JH, Han DH, Song JW, Chung HS. Diagnostic and therapeutic problems of pulmonary tuberculosis in elderly patients. J Korean Med Sci. 2005;20(5):784–9.
55. Slater G, Pengo MF, Kosky C, Steier J. Obesity as an independent predictor of subjective excessive daytime sleepiness. Respir Med. 2013;107(2):305–9. 56. Fernandez-Mendoza J, Vgontzas AN, Kritikou I, et al. Natural history of
excessive daytime sleepiness: role of obesity, weight loss, depression, and sleep propensity. Sleep. 2015;38(3):351–60.
57. Newman AB, Spiekerman CF, Enright P, et al. Daytime sleepiness predicts mortality and cardiovascular disease in older adults. J Am Geriatr Soc. 2000; 48(2):115–23.
58. Shahar E, Whitney CW, Redline S, et al. Sleep-disordered breathing and cardiovascular disease. Cross-sectional results of the sleep heart health study. Am J Respir Crit Care Med. 2001;163(1):19–25.
59. Irwin ED, Reicks P, Beal A, Byrnes M, Matticks C, Beilman GA. Prospective study of the role of sleep related disordered breathing as a risk factor for motor vehicle crashes and the development of systemic complications in non-commercial drivers. World J Emerg Surg. 2014;9:2.
60. Johnson KD, Patel SR, Baur DM, et al. Association of sleep habits with accidents and near misses in United States transportation operators. J Occup Environ Med. 2014 May;56(5):510–5.
61. Janzen B, Karunanayake C, Pahwa P, et al. Exploring diversity in socioeconomic inequalities in health among rural dwelling Canadians. J Rural Health. 2015;31(2):186–98.
62. Kapur VK, Redline S, Nieto FJ, Young T, Newman AB, Henderson JA. The relationship between chronically disrupted sleep and healthcare use. Sleep. 2002;25(3):289–96.
63. Leung RST, Comondore VR, Ryan CM, Stevens D. Mechanisms of sleep-disordered breathing: causes and consequences. Pflugers Arch - Eur J Physiol. 2012;463:213–30.
64. Guilleminault C, Lopes MC, Hagen CC, de Rosa A. The cyclic alternating pattern demonstrates increased sleep instability and correlates with fatigue and sleepiness in adults with upper airway resistance syndrome. Sleep. 2007;30(5):641–7.
65. Zanobetti A, Redline S, Schwartz J, et al. Associations of PM10with sleep and sleep-disordered breathing in adults from seven U.S. urban areas. Am J Respir Crit Care Med. 2010;182(6):819–25.
66. Park JH, Gold DR, Spiegelman DL, Burge HA, Milton DK. House dust endotoxin and wheeze in the first year of life. Am J Respir Crit Care Med. 2001;163(2):322–8.
67. Michel O, Kips J, Duchateau J, et al. Severity of asthma is related to endotoxin in house dust. Am J Respir Crit Care Med. 1996;154(6 Pt 1):1641–6.
68. Lin Y, Li Q, Zhang X. Interaction between smoking and obstructive sleep apnea: not just participants. Chin Med J. 2012;125(17):3150–6. 69. Rosales-Mayor E, de Castro JR, Huayanay L, Zagaceta K. Validation and
modification of the Epworth sleepiness scale in Peruvian population. Sleep Breath. 2012;16(1):59–69.
• We accept pre-submission inquiries
• Our selector tool helps you to find the most relevant journal • We provide round the clock customer support
• Convenient online submission • Thorough peer review
• Inclusion in PubMed and all major indexing services • Maximum visibility for your research
Submit your manuscript at www.biomedcentral.com/submit