T E C H N I C A L A D V A N C E
Open Access
The Generalized Data Model for clinical
research
Mark D. Danese
*, Marc Halperin, Jennifer Duryea and Ryan Duryea
Abstract
Background:Most healthcare data sources store information within their own unique schemas, making reliable and reproducible research challenging. Consequently, researchers have adopted various data models to improve the efficiency of research. Transforming and loading data into these models is a labor-intensive process that can alter the semantics of the original data. Therefore, we created a data model with a hierarchical structure that simplifies the transformation process and minimizes data alteration.
Methods:There were two design goals in constructing the tables and table relationships for the Generalized Data Model (GDM). The first was to focus on clinical codes in their original vocabularies to retain the original semantic representation of the data. The second was to retain hierarchical information present in the original data while retaining provenance. The model was tested by transforming synthetic Medicare data; Surveillance, Epidemiology, and End Results data linked to Medicare claims; and electronic health records from the Clinical Practice Research Datalink. We also tested a subsequent transformation from the GDM into the Sentinel data model.
Results:The resulting data model contains 19 tables, with the Clinical Codes, Contexts, and Collections tables serving as the core of the model, and containing most of the clinical, provenance, and hierarchical information. In addition, a Mapping table allows users to apply an arbitrarily complex set of relationships among vocabulary elements to facilitate automated analyses.
Conclusions:The GDM offers researchers a simpler process for transforming data, clear data provenance, and a path for users to transform their data into other data models. The GDM is designed to retain hierarchical
relationships among data elements as well as the original semantic representation of the data, ensuring consistency in protocol implementation as part of a complete data pipeline for researchers.
Keywords:Data model, Claims data, Electronic health records
Background
Healthcare data contains useful information for clinical researchers across a wide range of disciplines, including pharmacovigilance, epidemiology, and health services research. However, most data sources throughout the world store information within their own unique schemas, making it difficult to develop software tools that ensure reliable and reproducible research. One solution to this problem is to create data models that standardize the storage of both the data and the relationships among data elements [1].
In healthcare, several commonly used data models in-clude those supported by the following organizations: Informatics for Integrating Biology and the Bedside (i2b2) [2–4], Observational Health Data Sciences and In-formatics (OHDSI, managing the OMOP [Observational
Outcomes Medical Partnership] data model) [5–7],
Sen-tinel [8–10], and PCORnet (Patient Centered Outcomes
Research Network) [11, 12], among others. The first,
and biggest, challenge with any data model is the process of migrating the raw (source) data into the data model, referred to as the “extract, transform, and load” (ETL) process. The ETL process is particularly burdensome when one has to support multiple, large data sources, and to update them regularly [13].
© The Author(s). 2019Open AccessThis article is distributed under the terms of the Creative Commons Attribution 4.0 International License (http://creativecommons.org/licenses/by/4.0/), which permits unrestricted use, distribution, and reproduction in any medium, provided you give appropriate credit to the original author(s) and the source, provide a link to the Creative Commons license, and indicate if changes were made. The Creative Commons Public Domain Dedication waiver (http://creativecommons.org/publicdomain/zero/1.0/) applies to the data made available in this article, unless otherwise stated. * Correspondence:[email protected]
Some aspects of transforming raw data into a particu-lar data model are straight-forward, including reorganiz-ing variables and standardizreorganiz-ing their names. However, the most challenging aspect is standardizing the relationships among data elements without changing their meaning. Since different healthcare data sources encode relationships in different ways, the ETL process can lose information, or create inaccurate information. The best example is the process of creating a visit, a construct which, in most data models, is used to link information (e.g., diagnoses and procedures) on a per patient basis.
Visits are challenging because administrative claims allow facilities and practitioners to invoice separately for their portions of the same medical encounter, and allow practitioners to bill for multiple interactions on a single invoice [14]. Within the practitioner bills, individual pro-cedures are linked to diagnosis codes, procedure modi-fiers, and costs. Consequently, a visit should link both the facility and the practitioner information without changing the existing practitioner-specified relationships between procedures, modifiers, diagnoses, and costs. Even electronic medical records can be challenging when each interaction with a different provider (e.g., nurse, physician, pharmacist, etc.) is recorded separately, requiring decisions to be made about defining a visit.
To minimize the need to encode specific relationships that may not exist in the source data, we created a data model with a hierarchical structure that minimizes changes to the meaning of the original data. This data model can serve both as a stand-alone data model for clinical researchers using observational data, as well as a storage model for later conversion into other data models.
Methods
In designing the Generalized Data Model (GDM) the primary use case was to allow clinical researchers using commonly available observational datasets to conduct research efficiently using a common frame-work. In particular, the GDM was designed to allow researchers to reuse an extensive, published body of existing algorithms for identifying clinical research constructs, including visits, that are expressed in the native vocabularies of the raw data. These algorithms require code sets, and may also require temporal logic (e.g., before, after, during, etc.), sequencing in-formation (e.g., first, last, etc.), and provenance infor-mation (e.g., inpatient, outpatient, etc.). The GDM specifically considered both oncology research, which has its own specific vocabularies, and health services research. However, the model was designed so that these specific focus areas would not limit the design or use of the model.
Design goals
We initiated development of the GDM to make ETL specification and implementation easier for users who work with data models. There were two primary goals in defining the standard tables and table relationships for the GDM, described below.
Focus on clinical codes in their original vocabularies
For clinical research, transparency and reproducibility are critically important. Therefore, the model is fo-cused on the original (source) vocabularies to prevent the loss of the original semantic expression of the underlying clinical information. We also wanted all clinical codes (e.g., International Classification of
Diseases [ICD], Current Procedural Terminology,
National Drug Codes, etc.) to be easy to load into the data model and easy to query, because they represent the majority of electronic clinical information. Hence, the key organizing structure of the GDM is the
place-ment of all clinical codes in a central “fact” table.
This is not unlike the i2b2 data model that uses a
fact table to store all “observations” from a source
data set; however, the GDM was not designed as a star schema despite the similar idea of locating the most important data at the center of the data model.
We also considered interoperability as part of the de-sign, but it was of secondary importance. Interoperabil-ity, like the construction of visits, requires establishing
new connections (“mappings”) between the source
vo-cabularies and a standard vocabulary such that a single query can operate across all data sources regardless of the source vocabulary. For international studies using different vocabularies, this might be a useful tool.
However, given that every code isn’t yet mapped to a
standard (e.g., OMOP has little in the way of procedure code mappings), and the maintenance required to support and update mappings, we designed the GDM to incorporate reliable cross-vocabulary mappings where they exist.
Retain hierarchical information with provenance
The second goal was to capture important hierarch-ical relationships among data elements within a
rela-tional data structure. Based on the review of
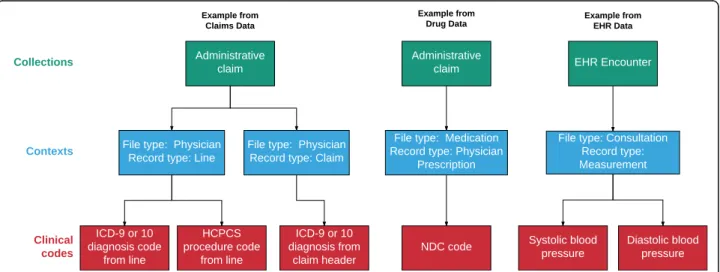
grouped together (Collections table) based on clinical
reporting or billing considerations. See Results for
table definitions, and Fig. 1 for a visual depiction of
the hierarchical structure of the Contexts and Collec-tions tables.
Our review of data sources suggested that the data model needed to support relatively few relationship types. The primary relationship represents data that is reported together or collected at the same time. One example of this includes a“line”, which occurs in claims data when one or more diagnosis codes, a procedure code, and a cost are all reported together. Another example includes laboratory values assessed at the same time (e.g., systolic and diastolic blood pressure) which could be considered to be co-reported. Also, a set of prescription refills could represent a linked set of re-cords. Even records that contain pre-coordinated expres-sions (i.e., a linked set of codes used to provide clinical information akin to an English sentence) could also be stored in order by associating the codes with a single Context record.
We also included the provenance for each clinical code as part of Contexts, recording not only the type of relationship among elements within a Context as discussed above, but also the source file from which the data was abstracted. To minimize the loss of information when converting from the GDM to a data model that uses visits for organizing and consoli-dating most data relationships, the GDM does not require explicit visits (see Results). This is important because visits are not consistently defined among other data models, particularly for administrative
claims data (see Discussion).
Other considerations
There are several other considerations made in building this data model, some of which were borrowed or adapted from other data models. For example, in addition to the cost table, we borrowed the OMOP idea to store all codes as“concept ids”(unique numeric iden-tifiers for each code in each vocabulary to avoid conflicts between different vocabularies that use the same code).
We also expanded upon the idea of OMOP “
type_con-cept_ids” to track provenance within our data model.
Finally, we allow flexibility in storing enrollment information in the Information Periods table using a
“type_concept_id” so that the data can be used for
different purposes (e.g., if a protocol does not require drug data, then enrollment in a drug plan should not be required). We also wanted to facilitate a straightforward, subsequent ETL process to other data models, including OMOP, Sentinel, and PCORnet.
We adapted the Payer Reimbursements table from the OMOP version 5.2 Cost table because it was the only data model with a cost table, and because we contrib-uted substantially to its design. However, unlike the single OMOP cost table, we created two tables to ac-commodate both reimbursement-specific information, which has a well-defined structure, and all other kinds of economic information, which requires a very flexible structure. (The OMOP version 5.31 Cost table was rede-signed to be more flexible, coincidentally resembling the GDM Costs table.)
Test data
We tested the data model on three very different types of commonly available data used by clinical researchers:
administrative claims data, EHR data, and cancer registry data. Claims in the United States are generally submitted electronically by the provider to the insurer using the American National Standards Institute (ANSI) 837P and 837I file specifications, which correspond to the CMS-1500 and UB04 paper forms [15]. Remittance information is sent from the insurer to the provider using the 835P and 835I specifications. However, actual claims data used for research is provided in a much simpler format. Based on experience developing and supporting software for submitting claims to insurers as well as creating ETL specifications for multiple commer-cial claims and EHR datasets using the OMOP data model, we determined that Medicare data is the most stringent test for transforming claims data because it contains the most information from the 837 and 835 files. For EHR data, we used the Clinical Practice Re-search Datalink (CPRD) data, because it is widely used for clinical research [16]. Finally, as part of our focus on oncology research, we included Surveillance, Epidemi-ology, and End Results (SEER) data [17] because SEER provides some of the most detailed cancer registry data available globally to clinical researchers which is challen-ging to incorporate into data models.
More specifically, we implemented a complete ETL process for the Medicare Synthetic Public Use Files (SynPUF). The SynPUF data are created from a 2.1-million-patient sample of Medicare beneficiaries from 2008 who were followed for three years, created to fa-cilitate software development using Medicare data
[18, 19]. We also implemented an ETL for SEER data
linked to Medicare claims data [20] for 20,000 pa-tients with small cell lung cancer, as part of an ongoing research project to describe patterns of care in that population. Finally, we developed a complete ETL for 140,000 CPRD patients for an ongoing re-search project evaluating outcomes associated with adherence to lipid-lowering medications. We also tested the feasibility of an ETL process to move Syn-PUF data from the GDM to the Sentinel data model (version 6.0) to ensure that the model did not contain any structural irregularities that would make it diffi-cult to move data into other data model structures.
Finally, we conducted a test of information loss in the context of applying quality control to a study of meso-thelioma patients. We conducted two analyses by separ-ate people based on a written specification document using SEER Medicare data. The first was conducted using the source data and a combination of SAS and R code, and the second was conducted using the GDM version of the data and proprietary software. The ana-lysis required the use of several SEER-specific fields, in-cluding the tumor sequence (first primary), histology, reporting type (microscopic confirmation), reporting
source (not at death or autopsy), and tumor location data.
ETL software
Our ETL process focused on the extraction of the source data and the transformation to the GDM data model, and saved tables as .csv files (i.e., it focused primarily on the E and T parts of the ETL). The ETL processes were built using R (version 3.4.4) and the data.table package (version 1.11.6) [21]. R was selected because it is an open-source, cross-platform software package; because of its flexibility for composing ETL functions; and be-cause of the availability of the data.table package as an in-memory database written in C for speed. The package itself is modular, and allows users to compose arbitrary ETL functions. Although the approach is different, the process is conceptually related to the dynamic ETL described by Ong, et al. [22]
Results
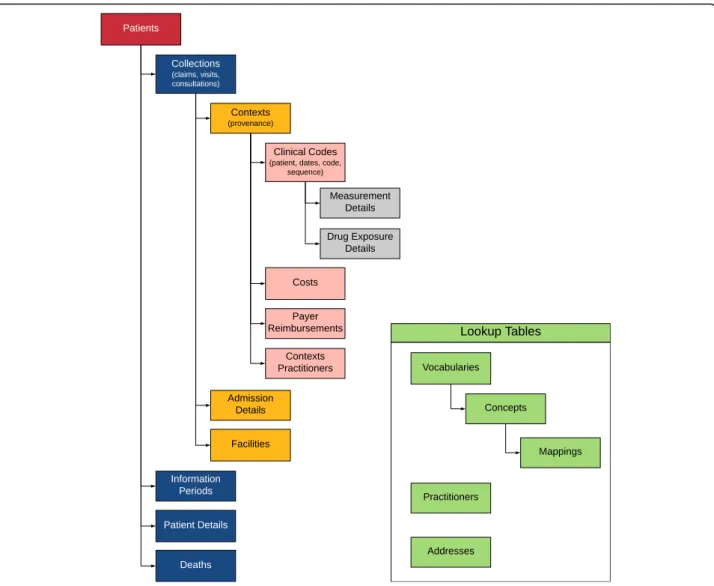
The resulting data model contains 19 tables (see hier-archical view in Fig.2). Details of the tables are provided in Additional file 1, and the most up-to-date version is available on a GitHub repository [23]. This repository will also contain links to any publicly available ETL specifications that we develop.
Tables Clinical data
The Clinical Codes, Contexts, and Collections tables
make up the core of the GDM (as shown in Fig. 1). All
clinical codes are stored in the Clinical Codes table. Each row of the Clinical Codes table contains a single code from the source data. In addition, each row also contains a patient id, the associated start and end dates for the record, a provenance concept id, and a sequence number. The sequence number allows codes to retain their order from the source data, as necessary. The most obvious example from billing data is diagnosis codes that are stored in numbered fields (e.g., diagnosis 1, diagnosis 2, etc.). But any set of ordered records could be stored this way, including groups of codes in a pre-coordinated expression. Grouping together ordered records in the Clinical Codes table is accomplished by associating them with the same id from the Contexts table. The proven-ance id allows for the specification of the type of record (e.g., admitting diagnosis, problem list diagnosis, etc.).
some kind from electronic health record or laboratory data (e.g., systolic and diastolic blood pressure, or a la-boratory panel). In addition, the table stores the file name from the source data, the Center for Medicare and Medicaid Services place of service values [27] (used for physician records since facility records to not have a place of service in claims data), and foreign keys to the care site and facility tables. The Contexts table also contains a patient id and both start and stop dates which could be different from the start and stop dates of the individual records from other tables to which the Contexts record is linked (e.g., a hospitalization may have different start and stop dates than the individual records within the hospitalization, as might occur with an in-hospital procedure performed on a single day of a multi-day hospitalization).
The Collections table represents a higher level of hierarchy for records in the Contexts table. That is, records in the Collections table represent groups of records from the Contexts table. This kind of
group-ing occurs when multiple billable units (“lines” or
“details”) are combined into invoices (“claims”). It also occurs when prescriptions, laboratory measures, diag-noses and/or procedures are all recorded at a single office visit. In short, a Collection is typically a “claim”
or a “visit” depending on whether the source data is
administrative billing or electronic health record data. By using a hierarchical structure, the model avoids the requirement to construct “visits” from claims data which often leads to inaccuracy, loss of information, and complicated ETL processing. In the simplest pos-sible case, it is pospos-sible to have a single record in the
Clinical Codes table which is associated with a single Context record, which is associated with a single
Col-lection record, as shown in Fig. 1 for a drug record.
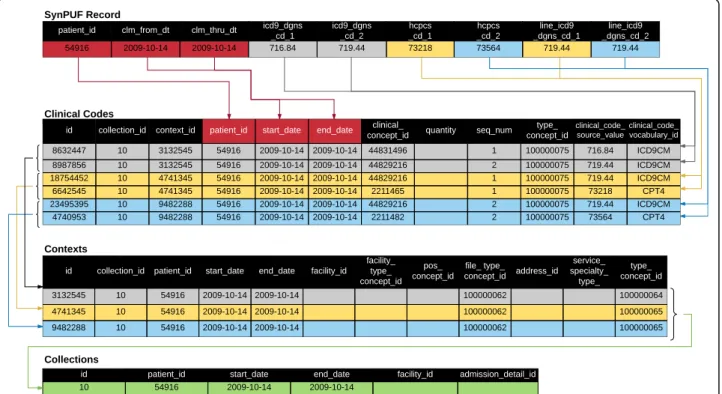
The critical part of the ETL process, moving data into the Clinical Codes, Contexts, and Collections
ta-bles, is described in Fig. 3 for the SynPUF data.
The Details tables capture domain-specific information related to hospitalizations, drugs, and measurements. The Admissions Details table stores admissions and
emergency department information that doesn’t fit in
the Clinical Codes, Contexts, or Collections tables. It is designed to hold one admission per row. Each record in the Collections table for an inpatient admission links to this table. The Drug Exposure De-tails and Measurement DeDe-tails contain information about medications and measurements (e.g., laboratory values). The Clinical Codes table contains foreign keys to these tables. We should also note that these two tables could be combined with the Clinical Codes table to make one larger table and improve query times on some database platforms. While this might require some minor modifications to the query, it
wouldn’t change the underlying logic of the data
model.
Patient data
The Patients table includes information about birth date, sex, race, ethnicity, address (via the Addresses table) and primary care provider (via Practitioners table). The Pa-tient Details table allows a more flexible structure for timeless information like family history or simple genetic information. The Information Periods table captures pe-riods of time during which the information in each table is relevant. This can include multiple records for each patient, including records for different enrollment types (e.g., Medicare Part A, Medicare Part B, or Medicare Managed Care) or this can be something as simple as a single date range of “up-to-standard” data as provided by the Clinical Practice Research Datalink. This table in-cludes one row per patient for each unique combination of information type and date range.
The Deaths table captures mortality information at the patient level, including date and cause(s) of death. This is typically populated from beneficiary or similar administrative data associated with the medical record. However, it is useful to check discharge status in the Admissions Details table as part of ETL process to ensure completeness. There are also diagnosis codes that indicate death. Deaths that are indicated by diagnosis
codes should be in the Clinical Codes table and not be moved to the Deaths table. If needed, these codes can be identified using an appropriate algorithm (e.g., a set of ICD-9 codes, possibly with associated provenance speci-fications) to identify death as part of the identification of outcomes in an analysis.
There are two tables that store cost, charge, or pay-ment data of some kind. The Payer Reimbursepay-ments table stores information from administrative claims data, with separate columns for each commonly used reim-bursement element. All other financial information is stored in the Costs table, which is designed to support arbitrary cost types, and uses a “value_type_concept_id” to indicate the specific type. Costs may be present at a Context (line-item) or Collection (invoice) level. There-fore, this led us to align costs with the Contexts table. By evaluating the type of the context record, users can determine whether a cost is an aggregated construct or not. In administrative claims data, this means that each “line” (diagnosis and procedure) can have a cost record. For records that have costs only at the claim/header level (e.g., inpatient hospitalizations), only Contexts that
refer to “claims” (i.e., a record_type_concept_id for
“claim”) will have costs. For data with costs at both the line and claim/header level, costs can be distinguished by the Context type. In our experience, the sum of the line costs does not always equal the total cost, so de-pending on the research question, the researcher will need to determine whether claim, line, or both should be used. It is possible that each Clinical Code record sharing a single Contexts record could have a different cost; therefore, the two cost-related tables include a col-umn to indicate the specific Clinical Code record to which the cost belongs. This might occur, for example, if multiple laboratory tests have different costs, but are share a common provenance (i.e., Contexts record).
Facility and practitioner data
The Facilities table contains unique records for each fa-cility where a patient is seen. The fafa-cility_type_concept_ id should be used to describe the whole facility (e.g., Academic Medical Center or Community Medical Center). Specific departments in the facility should be entered in the Contexts table using the care_site_type_ concept_id field. The Addresses table captures address information for practitioners and facilities, as well as patients.
The Contexts Practitioners table links one or more practitioners with a record in the Contexts table. Each record represents an encounter between a patient and a practitioner in a specific context. This role_type_concept_id in the table captures the role, if any, the practitioner played on the context (e.g., attending physician).
Vocabulary data
The Concepts table provides a unique numeric identifier (“concept_id”) for each source code in each vocabulary used in the data (see Table 1). Since queries against the GDM are intended to use the source codes, the Vocabu-lary table functions as a lookup table; therefore, the Concepts table does not have to be consistent across da-tabases. However, there may be efficiencies in using a consistent set of identifiers for all entries from com-monly used vocabularies. The specific vocabularies used in the data are provided in the Vocabularies table. The idea of having both Concepts and Vocabularies tables was adapted from the OMOP data models. As mentioned in Methods, the Mappings table allows for the expression of consistent concepts across databases.
The Mappings table is designed to express relation-ships among data elements. It can also be used to facili-tate translation into other data models (see Table2). In a few very simple cases like sex and race/ethnicity, we rec-ommend concept mappings to a core set of values to make it easier for users of a protocol implementation software to filter patients by age, gender, and race/ethni-city using a simpler representation of the underlying information. The Mappings table also permits an arbitrarily complex set of relationships, along the lines of the approach taken with the OMOP model and the use of standard concepts for all data elements. By using a Mappings table, we reduce the need to map and re-load the entire dataset when new mappings become available. Regardless of how the Mappings table is used, the GDM still retains the original codes from the raw dataset.
ETL results
CPRD data included approximately 140,000 patients and took approximately 2 h. For the Test file which contains laboratory values and related measurements, we used Read codes in the Clinical Codes table; however,
one could add the “entity types” (numeric values for
laboratory values and other clinical measurements and assessments) to the Clinical Codes table as well, with both the Read code and the entity type associated with the same Context record and the same Measurement Details record. We used the entity types for all records in the CPRD Additional Clinical Details table. In all cases, the Mapping table allows for alternative relation-ships to be added to the data.
Information loss
After reconciling differences in interpretation and resolving coding errors, we identified the identical cohort of patients when using the source data compared to using the same data in the GDM.
ETL from the GDM to sentinel
We conducted an exploratory transformation from the GDM to Sentinel to ensure that it was feasible. The process of moving the data was conducted as follows. The transformations from the GDM Patients, Deaths,
and Information Periods tables to Sentinel’s
Demo-graphic, Death, and Enrollment tables required renaming variables and mapping a source data vocabulary to a Sentinel vocabulary (e.g., SynPUF sex coding to Sentinel sex coding). The Sentinel Diagnosis, Procedure, and Dis-pensing tables were populated by splitting the GDM Clinical Codes table by clinical_code_source_vocabulary (e.g., ICD-9 codes were moved to the Sentinel Diagnosis table).
Populating the Sentinel Encounter table required records to be rolled up into a visit. To do this, the
Contexts table was transformed into a “pre-Encounter”
table with an encounter identifier set to the Contexts
table identifier, with a similar process used for the Senti-nel Procedure and Diagnosis tables. The“pre-Encounter” table was created with all of the specified columns and correctly mapped data, but had not yet grouped the re-cords into visits. We applied logic based primarily on provenance information in the Contexts table to roll-up records into visits, and we created a new identifier in the Encounter table. Finally, the Diagnosis and Procedure ta-bles were updated with new Encounter table identifier.
The remaining processing from the GDM to Sentinel involved vocabulary transformation since Sentinel has specific ways of representing concepts like sex which, in the GDM, are based on the source (e.g., male = 1 and fe-male = 2) using a unique concept id in the Vocabulary table. We created records in the Mappings table from
the SynPUF concepts to the Sentinel concepts (Table 2)
to accomplish all needed mappings. Our ETL process then used those mappings to insert the correctly trans-formed variables from the GDM into the Sentinel tables during the ETL.
Discussion
The GDM is designed to allow clinical researchers to identify the clinical, resource utilization, and cost con-structs needed for a wide range of epidemiological and health services research areas without altering the data’s original semantics by creating visits or domains, or per-forming substantial vocabulary mapping. This provides flexibility for researchers to study not only clinical en-counters like outpatient visits, hospitalizations, emer-gency room visits, and episodes of care, but also more basic constructs like conditions or medication use. Its main goal is to simplify the location of the most import-ant information for creating analysis data sets, which has the benefit of making ETL easier. It does this by using a hierarchical structure instead of visits. It tracks the provenance of the original data elements to enhance the reproducibility of studies. It includes a table to store
Table 1Example concepts table for variables in the SEER data
id vocabulary_id concept_code concept_text
100010943 naaccr_grade 1 Grade I; grade i; grade 1; well differentiated; differentiated, NOS
100010944 naaccr_grade 2 Grade II; grade ii; grade 2; moderately differentiated; moderately well differentiated; intermediate differentiation
100010945 naaccr_grade 3 Grade III; grade iii; grade 3; poorly differentiated; differentiated
100010946 naaccr_grade 4 Grade IV; grade iv; grade 4; undifferentiated; anaplastic
100010947 naaccr_grade 5 T-cell; T-precursor
100010948 naaccr_grade 6 B-cell; Pre-B; B-Precursor
100010949 naaccr_grade 7 Null cell; Non T-non B;
100010950 naaccr_grade 8 N K cell (natural killer cell)
100010951 naaccr_grade 9 cell type not determined, not stated or not applicable
relationships among data elements for standardized ana-lyses. And it allows for a subsequent ETL process to other data models to provide researchers access to the analytical tools and frameworks associated with those models.
Because other data models (e.g., OMOP, Sentinel, PCORnet, and i2b2) use visits to connect
patient-related information within the data model, our
emphasis on avoiding visits deserves comment. Visits are seldom required for clinical research, unless the enumeration of explicit visits is the research topic it-self. However, for most research projects, protocols require retrieval of the dates of specific, clinically relevant codes, perhaps with provenance or temporal constraints. Satisfying these criteria does not require knowledge of a visit, per se. It is a research project in and of itself to define visits, and their definitions are specific to the health services research question being
investigated [14]. For example, a study of “emergency
department” visits would need to consider at least
four options to define a visit [24]. Data models that pre-define visits do not allow such flexibility.
The challenges with visits can best be seen by inspect-ing the guidelines for creatinspect-ing visits from each data model. In the Sentinel version 6 data model [10], a visit is defined as a unique combination of patient, start date, provider and visit type. Visit types are defined as Ambu-latory, Emergency Department, Inpatient Hospital,
Non-acute Institutional, and Other. Furthermore, “Multiple
visits to the same provider on the same day should be considered one visit and should include all diagnoses and procedures that were recorded during those visits. Visits to different providers on the same day, such as a physician appointment that leads to a hospitalization, should be considered multiple encounters.”
PCORnet version 4.1 is similar to Sentinel [12]. However, PCORnet allows more visit types compared to PCORnet version 3, OMOP, and Sentinel. It includes Emergency Department Admit to Inpatient Stay, Obser-vation Stay, and Institutional Professional Consult.
In the OMOP version 5.31 data model, a visit is de-fined for each “visit to a healthcare facility.” According to the specifications [6], in any single day, there can be more than one visit. One visit may involve multiple pro-viders, in which case the ETL must either specify how a single provider is selected or leave it null. One visit may involve multiple care sites, in which case the ETL must either specify how a single site is selected or leave it null. Visits must be given one of the following visit types: Inpatient Visit, Outpatient Visit, Emergency Room Visit, Long Term Care Visit and Combined ER and Inpatient Visit. OMOP added an optional Visit Detail table in version 5.3, recognizing the two-level hierarchy common in US claims data [6].
For i2b2, the specifications state a visit“.. . can involve a patient directly, such as a visit to a doctor’s office, or it can involve the patient indirectly, as in when several tests are run on a tube of the patient’s blood. More than one observation can be made during a visit. All visits must have a start date / time associated with them, but they may or may not have an end date. The visit record also contains specifics about the location of the session, such as the hospital or clinic the session occurred and whether the patient was an inpatient or an outpatient at the time of the visit.” There are no specified visit types,
and the data model allows for an “unlimited number of
optional columns but their data types and coding systems are specific to the local implementation”[4].
Clearly, each data model has different perspectives on the definition of a visit. Such ambiguity can lead to dif-ferences in how tables are created in the ETL process. As a result, inconsistencies within or across data models can lead to differences in results, as has already been
demonstrated [25, 26]. Laboratory records could be
visits as with i2b2, or could be associated with visits as with other data models. Similarly, prescription, refill, and pharmacy dispensing records could be considered visits, or associated with visits. And other information, like family history, might not require a visit at all. In short, the most important structural component of other data models cannot be accurately and consistently de-fined, which affects the consistency of analyses across the data models, and makes translation among data models problematic. This also undermines provenance since each data model might answer the question of “where did this record come from” using different visit types. However, we note that these are semantic consid-erations and not technical limitations for record re-trieval. For example, the i2b2 query platform recently has been extended to permit querying of OMOP and PCORnet data [28].
One important consideration in using data models is their stability. It can be labor-intensive to keep data up-dated, and if both the data and the data model are chan-ging, maintenance may be prohibitively time-consuming [13]. One of our intentions is that the GDM should re-main stable over time; therefore, we incorporated separ-ate Vocabulary and the Mappings tables which can be updated without running the ETL from the beginning. Hence, the GDM may be a useful, harmonized approach for data providers, compared to their various proprietary solutions. This contrasts with the OMOP data model which requires re-running the ETL when the vocabulary and domain mappings are updated.
mapping the entire vocabulary into a single domain, or mapping each individual code into a single domain. Pla-cing codes in domain-specific tables can be particularly challenging when vocabularies cross domains (e.g., Read) or when individual codes are ambiguous (e.g., family his-tory information). The GDM does not require domains or vocabulary mappings to be fully functional. The GDM only requires that users assign a unique number (concept id) to all unique source codes in a given dataset to ensure consistency in the data type for the codes. The vocabulary table is simply a look-up table for the codes and concept ids. Because of this, all codes in all vocabu-laries (e.g., ICD-9, HCPCS [29], etc.) in the source data will be retained unless there is an explicit decision to ex-clude a code. However, if needed, the GDM could sup-port domains as an additional field in the Vocabulary table.
It is important to clarify the role of analyses in the eco-system of data models. Neither the GDM nor any other data model is designed to support direct analyses of any sophistication on the entire database (excluding summary analyses to characterize the entire dataset). The role of the data model is to ease the extraction and organization of analysis data sets to address specific clinical research ques-tions. The required analysis dataset structure depends on the specific analyses (e.g., prevalence, incidence, time to event, repeated measures, etc.) and is typically performed using R (OHDSI) or SAS (Sentinel). By starting with the GDM, researchers can develop tools to extract data dir-ectly, or implement the necessary transformations to mi-grate their data to other data models and make use of the tools for extraction and analysis offered by those models. While this requires another ETL process, or a database view to be created on the GDM, it facilitates access to existing analytical tools. Hence, the GDM can be used as a standardized waypoint in a data pipeline because the ne-cessary information for other data models can be con-tained within the GDM as we found in our test of a GDM to Sentinel conversion.
We should also note that our approach to incorporat-ing relationships into the data (i.e., our Mappincorporat-ings table) is not unique. Others have designed approaches that rely on semantic mappings to organize and extract data [30]. There are even methods to eliminate the need for both database reorganization and semantic mapping [31]. While these approaches may be more flexible and avoid cumbersome ETL and/or mapping processes, it is un-clear how they fare with respect to the sensitivity and specificity of their exposure and outcome definitions making it challenging to understand or assess bias in their results [32,33].
Information loss and data quality assessment are challenging subjects. We designed the GDM to minimize information loss in the sense that any codes in the source
data can be incorporated by creating entries in the Con-cepts, Vocabularies, and Clinical Codes tables. We also retained database specific provenance information by indi-cating the source file from which each data element is de-rived as well as the type of information that was dede-rived. While we tested information loss in the context of a co-hort study and found no problems, this is not a guarantee that all necessary information is, or can be, retained. A more robust assessment of data quality will be the subject of future research. However, our use of the SEER data is il-lustrative because detailed oncology data does not fit nat-urally into any of the other data models mentioned. Cancer registry data relies heavily on very specific vocabu-laries for location, histology, grade, staging, behavior, reporting source, microscopic confirmation and many other factors. Many of these don’t fit easily into the exist-ing domain-based tables. The OMOP data model has a further complication in that the International Classifica-tion of Diseases for Oncology version 3 (ICD-O-3) which covers location, histology, grade, and behavior is not a standard vocabulary. Therefore, while the OMOP data model stores the concatenated source codes, work re-mains to be done to map all combinations to the proper standard vocabulary based on SNOMED. (This work is ongoing at the time of this writing).
There are other limitations to the GDM. While we have tested it against data that is typically used by health ser-vices researchers and epidemiologists, there are likely to be specific data sets that will require modifications or im-provements. The GDM does not yet include tables for pa-tient reported outcomes, genomic data, or free text notes which are becoming more widely available for researchers. If other data models add support for these or other fields, this might require changes to the GDM to retain compati-bility. For example, more detailed location information may need to be added for those with access to additional data (which is often limited due to privacy issues). While we have considered data from Japan and the United King-dom, there are many data sources to which we did not have access that might require changes in the data model. Finally, while we have developed tools to extract analysis data sets from the GDM based on a protocol, they are not yet available publicly. (However, the ConceptQL language on which the tools are based is open-source [34]).
Conclusion
of data in a defined structure and may make it easier for users to transform their data into other data models.
Additional file
Additional file 1:The Generalized Data Model Table Specifications. (DOCX 75 kb)
Abbreviations
ANSI:American National Standards Institute; CMS: Centers for Medicare and Medicaid Services; CPRD: Clinical Practice Research Data link; EHR: Electronic Health Records; ETL: Extract Transform and Load; GDM: Generalized Data Model; i2b2: Informatics for Integrating Biology and the Bedside; ICD: International Classification of Diseases; NAACCR: North American Association of Central Cancer Registries; OHDSI: Observational Health Data Science and Informatics; OMOP: Observational Outcomes Medical Partnership; PCORnet: Patient Centered Outcomes Research Network; SEER: Surveillance Epidemiology and End Results; SynPUF: Synthetic Public Use Files
Acknowledgements
We gratefully acknowledge the influence of the open-source OMOP model specifications on our thinking in creating our data model. In addition, we acknowledge the influence of Sentinel, PCORnet, and i2b2 on our approach, although most of our data model was designed prior to reviewing these models in detail. We also thank Chris Adamson for helpful discussions about organizing the data model in different ways. At the time of writing, all references to the concepts table refer to the OMOP version 5.20 vocabulary table maintained by OHDSI. However, there is no reason that a user could not create their own system of codes with unique identifiers across vocabularies, or use the codes from the National Library of Medicine Metathesaurus [35].
Authors’contributions
MD, MH, RD, and JD contributed to the design of the data model. MH wrote the software code for data transformations. All authors have read and approved the manuscript.
Authors’information
MD is an epidemiologist who has worked with a wide variety of clinical data sources across therapeutic areas. JD and RD have extensive experience designing software for providers to submit medical bills to insurers. JD has constructed and/or substantially revised OMOP ETL specifications for many commercially available data sources. MD, JD, and RD are collaborators in the Observational Data Health Sciences and Informatics organization.
Funding
This research was self-funded.
Availability of data and materials
The data model is publicly available. The raw data is not available due to privacy reasons, except for the Medicare Synthetic Public Use data. SeeEthics approval and consent to participatefor details on SEER Medicare and CPRD data acquisition, andReferencesfor a specific hyperlink to the Synthetic Public Use data.
Ethics approval and consent to participate
A study protocol, an institutional review board exemption determination (Quorum IRB exemption determination #31309), and a data use agreement were required to access SEER-Medicare data. CPRD receives ethics approval to supply patient data for all protocols. Because of this, and the fact that all data are de-identified, no IRB approval or exemption are required. Our study protocol to access the CPRD data was reviewed by the CPRD Independent Scientific Advisory Committee. Provision of the CPRD data required a data use agreement. All transformations of the raw data were completed as part of the process of creating analysis data sets for approved study protocols. No clinical data was analyzed or reported for this study.
Consent for publication Not applicable.
Competing interests
Outcomes Insights provides consulting services and license software for implementing research protocols using observational data.
Received: 12 November 2017 Accepted: 10 June 2019
References
1. Kahn MG, Batson D, Schilling LM. Data model considerations for clinical effectiveness researchers. Med Care. 2012;50:S60–7.
2. Klann JG, Abend A, Raghavan VA, Mandl KD, Murphy SN. Data interchange using i2b2. J Am Med Informatics Assoc. 2016;23:909–15.
3. Murphy SN, Weber G, Mendis M, Gainer V, Chueh HC, Churchill S, et al. Serving the enterprise and beyond with informatics for integrating biology and the bedside (i2b2). J Am Med Informatics Assoc. 2010;17:124–30. 4. i2b2 Common Data Model.https://i2b2.org/software/files/PDF/current/CRC_
Design.pdf. Accessed 20 Apr 2017.
5. Overhage JM, Ryan PB, Reich CG, Hartzema AG, Stang PE. Validation of a common data model for active safety surveillance research. J Am Med Inform Assoc. 2012;19:54–60.
6. OHDSI. OMOP Common Data Model.http://www.ohdsi.org/web/wiki/doku. php?id=documentation:overview. Accessed 20 Apr 2017.
7. Voss EA, Makadia R, Matcho A, Ma Q, Knoll C, Schuemie M, et al. Feasibility and utility of applications of the common data model to multiple, disparate observational health databases. J Am Med Informatics Assoc. 2015;22:553–64. 8. Psaty BM, Breckenridge AM. Mini-sentinel and regulatory science--big data
rendered fit and functional. N Engl J Med. 2014;370:2165.
9. Curtis LH, Weiner MG, Boudreau DM, Cooper WO, Daniel GW, Nair VP, et al. Design considerations, architecture, and use of the mini-sentinel distributed data system. Pharmacoepidemiol Drug Saf. 2012;21(SUPPL. 1):23–31. 10. Sentinel Common Data Model.https://www.sentinelinitiative.org/sentinel/
data/distributed-database-common-data-model. Accessed 20 Apr 2017. 11. Fleurence RL, Curtis LH, Califf RM, Platt R, Selby JV, Brown JS. Launching PCORnet, a national patient-centered clinical research network. J Am Med Inform Assoc. 2014;21:578–82.
12. PCORnet Common Data Model v 4.1. https://pcornet.org/data-driven-common-model/. Accessed 28 Sept 2018.
13. Bourke A, Bate A, Sauer BC, Brown JS, Hall GC. Evidence generation from healthcare databases: recommendations for managing change. Pharmacoepidemiol Drug Saf. 2016;25:749–54.
14. Tyree PT, Lind BK, Lafferty WE. Challenges of using medical insurance claims data for utilization analysis. Am J Med Qual. 2006;21:269–75.
15. Centers for Medicare and Medicaid Services. Medicare fee-for-service companion guides.https://www.cms.gov/Medicare/Billing/
ElectronicBillingEDITrans/CompanionGuides.html. Accessed 24 Oct 2017. 16. Herrett E, Gallagher AM, Bhaskaran K, Forbes H, Mathur R, van Staa T, et al.
Data resource profile: clinical practice research datalink (CPRD). Int J Epidemiol. 2015;44:827–36.
17. Park HS, Lloyd S, Decker RH, Wilson LD, Yu JB. Overview of the surveillance, epidemiology, and end results database: evolution, data variables, and quality assurance. Curr Probl Cancer. 36:183–90.
18. Danese MD, Voss EA, Duryea J, Gleeson M, Duryea R, Matcho A, et al. Feasibility of converting the Medicare synthetic public use data into a standardized data model for clinical research informatics. In: AMIA 2015 annual symposium. San Francisco; 2015.
19. Centers for Medicare and Medicaid Services. Synthetic public use file.
https://www.cms.gov/research-statistics-data-and-systems/downloadable-public-use-files/synpufs/. Accessed 20 Apr 2017.
20. Warren JL, Klabunde CN, Schrag D, Bach PB, Riley GF. Overview of the SEER-Medicare data: content, research applications, and generalizability to the United States elderly population. Med Care. 2002;40(8 Suppl):IV–3-18. 21. Comprehensive R. Archive network. R. .
22. Ong TC, Kahn MG, Kwan BM, Yamashita T, Brandt E, Hosokawa P, et al. Dynamic-ETL: a hybrid approach for health data extraction, transformation and loading. BMC Med Inform Decis Mak. 2017;17:134.
24. Venkatesh AK, Mei H, Kocher KE, Granovsky M, Obermeyer Z, Spatz ES, et al. Identification of emergency department visits in Medicare administrative claims: approaches and implications. Acad Emerg Med. 2017;24:422–31. 25. Xu Y, Zhou X, Suehs BT, Hartzema AG, Kahn MG, Moride Y, et al. A
comparative assessment of observational medical outcomes partnership and mini-sentinel common data models and analytics: implications for active drug safety surveillance. Drug Saf. 2015;38:749–65.
26. Zhou X, Murugesan S, Bhullar H, Liu Q, Cai B, Wentworth C, et al. An evaluation of the THIN database in the OMOP common data model for active drug safety surveillance. Drug Saf. 2013;36:119–34.
27. Centers for Medicare and Medicaid Services. Place of service code set.
https://www.cms.gov/Medicare/Coding/place-of-service-codes/Place_of_ Service_Code_Set.html. Accessed 20 Sep 2018.
28. Klann JG, Phillips LC, Herrick C, Joss MAH, Wagholikar KB, Murphy SN. Web services for data warehouses: OMOP and PCORnet on i2b2. J Am Med Inform Assoc. 2018;25(10):1331–8.
29. Centers for Medicare and Medicaid Services. HCPCS.
30. Bradshaw RL, Matney S, Livne OE, Bray BE, Mitchell JA, Narus SP. Architecture of a federated query engine for heterogeneous resources. AMIA . Annu Symp proceedings AMIA Symp. 2009;2009:70–4. 31. Rajkomar A, Oren E, Chen K, Dai AM, Hajaj N, Liu PJ, et al. Scalable and
accurate deep learning for electronic health records. npj Digit Med. 2018; January:1–10.
32. Lash TL, Fox MP, Cooney D, Lu Y, Forshee RA. Quantitative Bias analysis in regulatory settings. Am J Public Health. 2016;106:1227–30.
33. Duan R, Cao M, Wu Y, Huang J, Denny JC, Xu H, et al. An empirical study for impacts of measurement errors on EHR based association studies. AMIA Annu Symp proceedings AMIA Symp. 2016;2016:1764–73.
34. Outcomes Insights Inc. ConceptQL.https://github.com/outcomesinsights/ conceptql. Accessed 30 Sep 2018.
35. Bodenreider O. The unified medical language system (UMLS): integrating biomedical terminology. Nucleic Acids Res. 2004;32(suppl 1):D267–70.
Publisher’s Note