86
EVA BASED PERFORMANCE MEASUREMENT: A COMPARATIVE
STUDY OF WITH PROFITABILITY AND LEVERAGE OF INDIAN
CORPORATES
Dr. Priya Jain
Assistant Professor, J. R.N. Rajasthan Vidyapeeth University, Udaipur-313001, Rajasthan-India
Mob: 9929215641, email: priyajain2183@gmail.com
ABSTRACT
Performance measurement is the current corporate standard in recent years used to measure shareholder’s wealth. Traditional financial performance measures are based upon the companies’ profitability and ratios only, but for driving shareholder value these methods were not found suitable while EVA has revealed its reign on these traditional measures. Some other researchers have disproved the claim of EVA by supplying data in support of company’s profitability and leverage based traditional accounting indicators such as NOPAT, Capital Employed and Weighted Average Cost of Capital. Under this study financial performance measurement of Indian corporate working in various sectors were analyze. This has done by taking a healthy and representative sample of financial data of 5 year period form 2008-2012 of total 20 companies which have been selected from different industries like Information technology, Telecommunication, Pharmaceutical, Banking, FMCG, Oil-minerals and Automobiles. The data were analyzed with the help of multiple regression and ANOVA. The results of the study indicated that no significant co-relation between the EVA with Profitability and also exhibits in significant relation with traditional measures based on the variables of Leverage of the company.
Keywords: EVA, Net operating profit after tax (NOPAT), Leverage, Capital Employed, Weighted Average Cost of Capital (WACC) and Traditional measures.
INTRODUCTION
The empirical studies highlight that single accounting measure cannot be used for measuring shareholders wealth. Financial measures used in measuring firm’s performance must be highly correlated with wealth of shareholders. Traditional performance evaluation standard only considers the quantity of profit; however, in order to specify the real value of a company, the quality of profit must also be taken into account (Stewart, 1991). The measurement of true profit must integrate full cost of capital thereby accounting income is not a consistent predictor of firm value and cannot be used for measuring corporate performance. EVA is the new innovation created for measuring Value based performance measurement.
87
important criterion which holds the most powerful connection with the stock's price in comparison to the traditional standards for performance evaluation (Stewart, 1991).
A business consultant firm Stern Stewart and company prepared and encouraged EVA, by arguing that EVA can be used instead of earnings or cash from operations as measures of both internal and external performance (Stewart 1991). Further they argued that EVA is a better than other performance measures. Stewart (1994) quoted that it stands well out from the crowd as the single best measures of value creation. EVA’s conceptual foundations originate from a well-established microeconomic literature regarding the link between firm earnings and wealth creation.
Chen& Dodd (1997) found that, while EVA provides significant information value, other accounting profit measures also provide significant information and should not be discarded in favor of EVA alone. It provides significant information beyond traditional accounting measures of EPS, ROA and ROE (Chen & Dodd, 1997), while Chandra (2001) identifies that EVA is a better measure than EPS, PAT and ROCE. Brewer, at al. (1999) suggested that EVA provides Better goal congruence than ROI.
Calculation of EVA
EVA is based on the concept that a successful firm should earn at least its cost of capital. Firms that earn higher returns than financing costs benefit shareholders and account for increased shareholder value. In its simplest form, EVA can be expressed as the following way:
EVA = NOPAT- WACC × CAPITAL EMPLOYED
__________(1)
Where,
CE = Total capital employed
WACC= Weighted average cost of capital NOPAT = Net operating profit after tax; and
The total capital employed does not include investments outside the business and operating items like dividend/interest on securities invested outside the business, non-operating expenses etc. will not be considered for calculation of NOPAT. Cost of equity is measured on the basis of capital asset pricing method for calculating and WACC Cost of debt is taken as after tax cost. Under Capital Asset Pricing Model, cost of equity (Ke) is calculated as:
Ke = Rf + β (Rm- Rf)
_____________________(2)
Where,
Rm = Market rate of return; β = Risk coefficient and Rf = Risk free return.
88
On the other hand the traditional measures used to denominate the leverage of the company will not provide the clear picture of wealth creation of thee organisation and thus these variables may not be considered as measures of value creation. Various authors have tried through his Empirical analysis that there is a relationship between the profitability and leverage of the companies and the EVA. This paper is an attempt of author to identify this relation in Indian companies.
1. OBJECTIVES
The objectives of this study were as follows:
i. To measure the relationship between the EVA and profitability.
ii.To measure the relationship between the EVA and leverage based Performance drivers.
2. REVIEW OF LITERATURE
Khan, Shagufta, Chouhan,V., Chandra,B., Goswami, S. (2012) in their research paper empirically examined whether Economic Value Added of the companies listed in BSE securities market creating value for shareholders. For this purpose a sample from BSE-30 companies is taken. The statistical test will be done with multiple correlation and multivariable linear regression model. The company's NOPAT with other variables influence on EVA is checked. The paper concludes with the positive relation and advice at the end in order to increase the company's economic value.
Kaur, Mandeep and Sweety Narang, (2010) in their research paper conducted an empirical study from 2004 to 2008 data by analyzing the annual reports of India’s largest 500 companies. They analyses the Economic Value Added (EVA) reporting practices prevalent in Indian corporate sector revealed that just 7.4 percent companies(37 companies from the sample) specifically mentioned the use of EVA metric in their public disclosures. The study also identified the preferred medium of EVA disclosure, areas of EVA applications and extent of EVA-related computations made and disclosed by the EVA reporting companies. the result indicated that the EVA usage and disclosure choice of Indian companies is influenced by their size, profitability, leverage and sales efficiency.
Brewer et al (1999) recommend using other performance measures along with EVA and suggest the balanced scorecard system. Other researchers have noted that EVA does not correlate as strongly with stock returns as its proponents claim. Chen & Dodd (1997) found that, while EVA provides significant information value, other accounting profit measures also provide significant information and should not be discarded in favor of EVA alone. Biddle, Brown & Wallace (1997) found only marginal information content beyond earnings and suggest a greater association of earnings with returns and firm values than EVA, residual income, or cash flow from operations.
Tortella et al (2003) interpreted in the sense that the EVA methodology provides incentives to managers to increment firm investment activity, not with the objective to increase firm capital structure (that sometimes generate important inefficiencies), but in order to improve firm economic value and future perspectives.
89
employing EVA. Prospector firms are defined as firms that apply a differentiation strategy while defender firms focus on being cost-leaders. The results indicate that firms using EVA exhibit a higher percentage of institutional ownership and a less percentage of insider ownership than non-adopters.
Kousenidis, Negakis and Floropoulos (2000) examined the size and B/M factors in the relationship between average stock returns and the average book returns for the ASE. They provided evidence suggesting that ROI is associated to stock returns especially when portfolios are formed based on B/M ratio. Theriou et al. (2005) provided evidence on the role of size and B/M ratio on average stock returns in the ASE for the period 1993-2001. They reported a statistically significant positive relationship between size, profitability and average stock returns.
Banerjee (2000) revealed that invested capital denotes the size or growth. If a company has negative profitability, growth in size would reduce EVA, while the growth in firm size would indicate higher EVA. Issham et al. (2006) have made an Empirical analysis of firm’s size and EVA. They found Negative relationship between the size of the companies and the EVA.
Toni, et al. (2001) investigated leading 200 Italian firms of the mechanical industry and the leading 200 Italian firms of the electro-mechanical and electronic industries. They found that the size of the firm is justified above a certain dimensional threshold. In addition, the amplitude of the performance parameters required by the competition and the complexity of the management/evaluation of the activities, proportional to the size of the business, favour - for the first investigation on the subject - medium to large sized firms.
Wilson(1997) As might be expected, higher EVAs are better than lower EVAs and therefore trends in forecast EVA, or even current EVA, are usually compared with historical data. For comparisons between companies or against market data, EVA is of no use as it is affected by leverage and consequently comparisons are generally made on the basis of return (NOPAT).
Easton, P. Harris, T. and Ohlson, J (1992) observed that EVA is an increasingly popular corporate performance measure one that is often used by companies not only for evaluating performance, but also as a basis for determining incentive pay. Like other performance measures, EVA attempts to cope with the basic tension that exists between the need to come up with a performance measure that is highly co-related with shareholders wealth, but at the same time somewhat less subject to the random fluctuations in stock prices. This is a difficult tension to resolve and it explains the relatively low correlation of all accounting based performance measures with stock returns at least on a year to year basis.
Stewart (III), and Bennett, G. (1994) observed that EVA is a powerful new management tool that serves as the centerpiece of a completely integrated frame-work of financial management and incentive compensation. It is a way both to legitimize and to institutionalize the running of a business in accordance with basic microeconomics and corporate finance principles. An EVA system, by providing such an integrated decision making framework, can refocus energies and redirect resources to create sustainable value for company’s customers, employees, shareholders and for management.
90
investment produces return that exceeds our cost of capital and they do believe that EVA approach enables us to directly align management and shareholders interest”.
Thenmozhi, M. (2000) found to indicate the true return on capital employed, by Comparing EVA with other traditional performance measures their study indicated that all the companies depict a rosy picture in terms of EPS, RONA and ROCE for all the three years. The study shows that the traditional measures do not reflect the real value of shareholders and EVA has to be measured to have an idea about the shareholders’ value.
Ramana, Reddy, M. Rajesh & Narayana, (2011) revealed that Profit maximization as a concept is age-old, wealth maximization is matured and value maximization is today’s wisdom. EVA is one such innovation that attempts to measure the value that firms create or destroy by subtracting a capital charge from the cash returns they generate on invested capital. Besides the measures like Return on Equity (ROE), Return on Net worth (RONW), Return on Capital Employed (ROCE) and Earnings per Share (EPS), EVA is a new measure available to the corporate managers (Goswami, Chandra & Chouhan, 2012; Chouhan & Gorana, 2014). It combines factors such as economy, accounting and market information in its assessment. Comparison between EVA and other measures has been made and it was found that that EVA is the best appropriate measure for measuring the value of shareholders.
Joshi, Sanjay Satyanarayan (2011) showed a relationship between EVA, MVA and other accounting measures of fertilizer companies in India. He examined that value creations for shareholders of fertilizer companies in India through EVA and MVA. The objectives of the study are to examine the relationship between EVA, MVA and other accounting measures like Return on Investment (ROI), Return on Equity (ROE), Earnings per Share (EPS) and Return on Net worth (RONW) through correlation analysis and also ANOVA is used to compare the mean value of EVA and MVA for studied fertilizer companies.
Kanthakrishnan, R. and S. Jeyaraj (2011) selected few companies in India with intent to provide an insight into the role of Economic Value Added concept as a performance measurement/ management tool in the Indian context. In this study, it is found that there has been a remarkable turnaround of the Indian corporate sector over the past few years. The article focused on the importance of EVA as an improved measure of corporate performance over the traditional performance indicators like PAT, ROI, ROCE, EPS, etc.
Vijayakumar, A. (2011) revealed that among the set of popular value based management, EVA is the most prominent. They evaluated the power of EVA to get a better predictive power of selected automobile companies in India. In order to disclose the factors contribute much towards shareholders wealth maximization, factor analysis has been done (Naghshbandi et.al, 2016; Chouhan et.al, 2016, Chouhan, V., & Naghshbandi, N. 2015). The results of the study showed that out of the eight variables, three factors have been extracted and these three factors put together explain 69.902 per cent of the total variance. Further, sales and profit after tax are found to have a stronger relationship with EVA.
91
reason behind this is that the financial performance of a business organization is measured from the shareholders’ value point of view.
Mittal, R.K., Neena Sinha, Archana Singh (2008), presented the process of implementation of an economic value added (EVA) framework in Godrej Consumer Products Limited (GCPL), a leading fast moving consumer goods (FMCG) company in India, and the challenges faced by the company. It covers in detail the reasons for implementing the EVA framework in GCPL and the benefits derived by the company from it in the form of the SWOT analysis. It is shown that there is a positive link between the implementation of an EVA framework and improvement in the financial performance of a company. It ends with a debate on the effectiveness of EVA.
Shil, Nikhil Chandra (2009) concluded that EVA is a value based performance measure that gives importance on value creation by the management for the owners. Profit maximization as a concept is age-old, wealth maximization is matured and value maximization is today’s wisdom. EVA is required to be tailored in line with accounting system, management philosophy and the degree of demand of such a system (Chouhan & Verma, 2014:a; Chouhan. & Verma 2014:b; Chouhan, 2013). In this paper, an earnest effort has been made to explain theoretical foundation of EVA with its origination, definition, ways to make it tailored, adjustments required, scope and some other related issues(Khan et.al, 2012; Chandra et.al, 2012; Chandra et.al, 2012).
Kaur, Mandeep and Sweety Narang, (2010) by analysing the annual reports of India’s largest 500 companies over a period of five years (from 2004 to2008) conducted that by taking a sample of 37 companies (7.4 per cent of the sample) that preferred medium of disclosure is now EVA disclosure, areas of EVA applications and extent of EVA-related computations made and disclosed by the EVA reporting companies.
3. SAMPLE COMPANIES
92 Table-1: Sample Characteristics
Sector Company Name Year of incorp -oration
Market capital-isation
NOPAT Share Capital
Capital Employed
Information Technology
Infoysis Limited 1981 169290 6,835 286 25,976
Tata Consultancy Limited (TCS)
1968 232 7,569.99 295.72 24,504.81
Telecommu nication
Bharti Airtel 1995 6826186 7,716.90 1,898.8 48,766.80
Pharmac -eutical
Cipla Limited 1935 29700 960.39 160.58 6,666.13
Lupin Limited 1968 4273.31 809.98 89.24 3,281.08
Sun Pharma 1983 10037.88 1,907.37 103.56 9,483.32
Dr Reddy’s Laboratory. 1984 542445 893.4 84.6 4,031.80
Banking HDFC Bank 1977 44745.29 8,640.27 465.23 25,586.06
ICICI Bank 1994 61661.69 8,004.66 1,151.8 55,302.49
Kotak Mahindra Bank 1985 16204.1 1,569.24 368.44 10,999.87
FMCG Sector
Dabur Limited. 1884 8697.55 568.89 174.07 1,391.1
Marico Industries Ltd. 1987 7330.19 291.94 61.44 915.48
Britainia Limited 1892 979.49 134.2 23.89 326.03
Hindustan Uniliver Ltd. 1933 54324.97 2,153.00 215.95 2,633.92
Oil-minerals IOC 1959 83278.75 8,085.62 2,427.9 57,575.21
HPCL 1976 13252.16 1,700.48 339.01 13,281.68
ONGC 1955 276641.8 22,824.9 4,277.7 115,327.25
Auto-mobile
Hero Motor Corporation 1984 31739 1,927.90 39.94 3989
Kinetic Limited 1972 70.88 1.48 83.4 25.37
TVS Limited 1978 1678.24 194.58 47.51 999.41
4. RESEARCH METHODOLOGY AND HYPOTHESIS
4.1 Collection of Data:
The data for this research is collected from secondary source mainly by the annual report of the companies. For these purpose annual reports of companies, articles, Database Such AS CMIE, Stock Markets, Securities Companies and journals etc., have also been used as. A healthy sample of 20 companies of 7 industries and 5 year period have been taken.Thus, the study is largely empirical in approach.
4.2 Data analysis Tool:
To identify the dependence of financial performance measures on Profitability and Leverage with modern measure as EVA, testing of hypotheses were done with SPSS-19 software, by applying correlation, multiple regressions and ANOVA. Variables were selected as measurement of Profitability and leverage while EVA is taken as modern measure of performance.
4.3 Hypothesis
To analyze the above hypothesis the following sub hypothesis is drawn in this stage:
H1= The attributes configuring modern financial performance measures (EVA) have
93
H2= The attributes configuring modern financial performance measures (EVA) have
significant influence with the Leverage.
EVA AND PROFITABILITY ANALYSIS
As per the objective of the study the financial performance measures related to profitability used to be compared with the EVA.
To analyze the first hypothesis and the co-relation between the EVA and profitability multiple regression analysis is being used. The results of this analysis were enlisted in following table 2 while the ANOVA has been shown in table-3.
Table 2: Multiple Regression Analysis EVA and profitability Descriptive Statistics
Mean Std. Deviation N
EVA 4233.9312 10475.57614 100
Net Operating Profit after Taxes (NOPAT) 3286.9025 4736.34387 100
Correlations
EVA
Net Operating Profit after Taxes
(NOPAT) Pearson
Correlation
EVA 1.000 .167
Net Operating Profit after Taxes (NOPAT) .167 1.000 Sig.
(1-tailed)
EVA . .048
Net Operating Profit after Taxes (NOPAT) .048 .
Model Summary
Model R
R Square
Adjusted R Square
Std. Error of the Estimate
Change Statistics R
Square Change
F
Change df1 df2
Sig. F Change
1 .167a .028 .018 10380.36569 .028 2.824 1 98 .096
a. Predictors: (Constant), Net Operating Profit after Taxes (NOPAT)
Table 3: ANOVA analysis of EVA and Profitability
Model
Sum of
Squares df Mean Square F Sig.
1 Regression 3.043 1 3.043E8 2.824 .096a
Residual 1.056 98 1.078E8
Total 1.086 99
a. Predictors: (Constant), Net Operating Profit after Taxes (NOPAT) b. Dependent Variable: EVA
94
EVA can be calculated as ± 20345.5167524 (1.96 X .73520).The regression coefficients, plus the constraints are insignificant at 0.05 levels.
ANOVA Analysis:
The ANOVA analysis provides the statistical test for overall model fit in terms of F Ratio. The total sum of squares (3.043) is the squared error that would accrue if the mean of EVA has been used to predict the dependent variable. Using the values of NOPAT this errors can be reduced by 280.202 % (3.043/1.086). This reduction is not statistically significant with the F ratio of 2.824 and significance at level of 0.096.
With the above analysis it can be concluded that null hypothesis is selected and we can say that the financial performance measures (EVA) Exhibits no correlation with the Profitability.
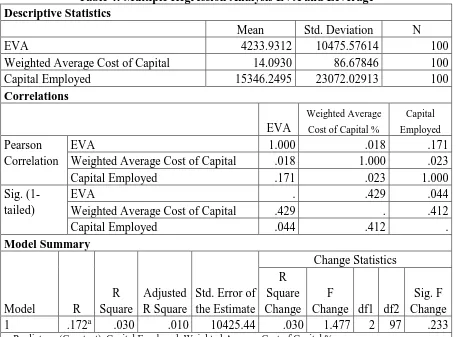
EVA AND LEVERAGE ANALYSIS
As per the objective of the study the financial performance measures related to leverage used to be compared with the EVA.
To analyze the first hypothesis and the co-relation between the EVA and leverage multiple regression analysis is being used. The results of this analysis were enlisted in following table 2 while the ANOVA has been shown in table-4.
Table 4: Multiple Regression Analysis EVA and Leverage Descriptive Statistics
Mean Std. Deviation N
EVA 4233.9312 10475.57614 100
Weighted Average Cost of Capital 14.0930 86.67846 100
Capital Employed 15346.2495 23072.02913 100
Correlations
EVA
Weighted Average
Cost of Capital %
Capital
Employed
Pearson Correlation
EVA 1.000 .018 .171
Weighted Average Cost of Capital .018 1.000 .023
Capital Employed .171 .023 1.000
Sig. (1-tailed)
EVA . .429 .044
Weighted Average Cost of Capital .429 . .412
Capital Employed .044 .412 .
Model Summary
Model R
R Square
Adjusted R Square
Std. Error of the Estimate
Change Statistics R
Square Change
F
Change df1 df2
Sig. F Change
1 .172a .030 .010 10425.44 .030 1.477 2 97 .233
95
Table 5: ANOVA analysis of EVA and leverage
Model Sum of Squares df Mean Square F Sig.
1 Regression 3.211 2 1.606E8 1.477 .0233a
Residual 1.054 97 1.087E8
Total 1.086 99
a. Predictors: (Constant), Capital Employed, Weighted Average Cost of Capital b. Dependent Variable: EVA
The final Regression model with 2 independent variables (Capital Employed, Weighted Average Cost of Capital) explains only 1% of the variance of EVA. Also, the standard errors of the estimate has been reduced to 10425.44, which means that at 95% level, the margin of errors for any predicted value of EVA can be calculated as ± 20433.8624 (1.96 X 10425.44). The impact of multi colinerarity in the selected variable is substantial. It has the tolerance value less than 0.551, indicating that over 44.9% of the variance is accounted for by the other variables in the equation.
ANOVA Analysis:
Analysis of variance (ANOVA) is an analysis tool used in statistics that splits the aggregate variability found inside a data set into two parts: systematic factors and random factors. The systematic factors have a statistical influence on the given data set, but the random factors do not. Analysts use the analysis of the variance test to determine the result independent variables have on the dependent variable amid a regression study.
ANOVA provides a statistical test of whether or not the means of several groups are equal, and therefore generalizes the t-test to more than two groups. ANOVAs are useful for comparing (testing) three or more means (groups or variables) for statistical significance. It is conceptually similar to multiple two-sample t-tests, but is more conservative (results in less type I error) and is therefore suited to a wide range of practical problems. The test allows comparison of more than two groups at the same time to determine whether a relationship exists between them. The test analyzes multiple groups to determine the types between and within samples.
In this test, the ANOVA analysis provides the statistical test for overall model fit in terms of F Ratio. The total sum of squares (1.086) is the squared error that would accrue if the mean of EVA has been used to predict the dependent variable. Using the values of CE and WACC this errors cannot be reduced (3.211/1.086). This reduction is deemed statistically insignificant with the F ratio of 1.477 and significance at level of 0.0233.
With the above analysis it can be concluded that null hypothesis is rejected and we can say that the financial performance measures (EVA) Exhibits significant correlation with the Leverage as per its selected variables of Weighted Average Cost of Capital.
96
EVA is now recognized as an important tool of performance measurement and management all over the world, particularly in advance economies by adopting it as corporate strategy. Still there are mixed evidences about the superiority of EVA over traditional performance measurement tools (Sharma & Kumar, 2010). India specific evidences are also not clear when EVA is compared with profit or leverage of companies’ metrics. With the above analysis Although the traditional financial performance measures have significant correlation with other variables of profit or leverage butthe attributes configuring modern financial performance measures (EVA) have not influenced by dependent variables of profitability or leverage in selected companies.
REFERENCES
Baek, H Young, Joung W Kim, (2002) Incentive-Based Compensation and Economic Value Added, Journal of Accounting and Finance Research, Vol. 10, Issue.1, spring.
Banerjee, Ashok (2000). Linkage between Economic Value Added and Market Value:An Analysis, Vikalp, Vol. 25, No. 3, July-September 2000
Biddle, G.C., 1998, Economic Value Added: Some Empirical EVAdence, Managerial Finance, 24, 11: 60-70.
Brewer, P.C., Chandra, G., & Hock, C.A.. (1999). Economic value added (EVA): Its uses and limitations. S.A.M. Advanced Management Journal; Spring 1999; 64, 2. Retrieved April 14, 2007, from http://www.lib.uwo.ca/ business/ Brewer EVA.pdf.
Brewer, Peter; Gyan Chandra; and Clayton A. Hock, “Economic Value Added (EVA): Its Uses and Limitations,” SAM Advanced Management Journal, Spring 1999, pp. 4-11.
Chandra, B., Chouhan, V., and Goswami, S.,(2012:a) Analyzing Trends and Profitability vis-à-vis Working Capital Organizations of India Management (WCM) – A Study of Select Information Technology (IT), Indian Journal of Finance, ISSN: 0973-8711, Vol.6, No. 7, July, PP 13-26.
Chandra, B., Goswami, S. and Chouhan, V., (2012: b) Investigating Attitude towards On-Line Advertising on Social Media – An Empirical Study, Management Insight, SMS Varanasi, ISSN: 0973-936X, Vol. VIII, No. 1, June, PP 1-14.
Chen, S. & Dodd, J. L. (1997). Economic Value Added (EVA): An Empirical Examination of a New Corporate Performance Measure. Journal of Managerial Issues, 9(3), 318-333.
Chen, S., & Dodd, J.L., 1997, Economic Value Added (EVA): An Empirical Examination of a New Corporate Performance Measure, Journal of Managerial Issues, 9, 3: 318-333.
Chouhan, V. & Gorana, H. (2014). Analysing Consumer Decision making for FMCG products on basis of different culture: a case study of Rajasthan and Gujarat states, American International Journal of Research in Humanities, Arts and Social Sciences, 8(2), 217-222.
97
Chouhan, V. & Verma, Pushpa (2014:a), Improving effectiveness of Performance appraisal tool: Who thinks that it uses improved techniques?, Business Spectrum, 4(1), 71-82.
Chouhan, V., & Naghshbandi, N. (2015). Measuring Employees Value: A Critical Study on Human Resources Accounting in India. International Journal of Management, Accounting and Economics, 2(4), 277-292.
Chouhan, V., (2013), Global Convergence of Accounting Standard And Indian Perspective, International Journal of Research in Finance & Marketing, 33(7), 15-27
Chouhan, V., Chandra, B., Goswami, S. (2014), Predicting financial stability of select BSE companies revisiting Altman Z score, International Letters of Social and Humanistic Sciences, 15(2), 92-105.
Chouhan, V.,Verma, Pushpa, Sanghvi, Himanshu and Gupta, Apurv (2013), Assessing Worker’s and Manager’s Perception on Judgment Accuracy in Performance Appraisal System (PAS) International Journal of Engineering, Business and Enterprise Applications (IJEBEA), 5(1), 95-99.
Chouhan, Vineet, Chandra, Bibhas, Goswami, Shubham & Verma, P.(2016).Analyzing the Performance Appraisal System of a Public Sector Organization in India: The Case of Rajasthan State Mines and Minerals Limited, IUP Journal of Management Research, 15(1), 48-74.
Easton, P., Harris, T. & Ohlson, J. (1992), “Aggregate Earnings can explain most security returns”, Journal of Accounting and Economic, June – September.
Goswami, S., Chandra, B & Chouhan, V. (2012). Analyzing Customer Perception towards Hypermarkets – An Empirical Study. The Alternative-Journal of Management Studies and Research (BIT Mesra), 2, 87-107.
Joshi, Sanjay Satyanarayan (2011), Relationship Between EVA, MVA and other Accounting Measures of Fertilizer Companies in India, IJRIM, Volume 1, Issue 7, November, pp 1-14.
Kanthakrishnan, R. and S. Jeyaraj (2011), Enterprising on Eva Excellence - An Empirical Study on Select Companies in India, , Journal for Bloomers of Research, Vol. 3, No. 1, August, pp 59-67.
Kaur, Mandeep and Sweety Narang, (2010) EVA® Disclosures in the Annual Reports of Indian Companies: An Empirical Study, Global Business Review October 2010 11: 395-420, doi:10.1177/097215091001100 306
Kaur, Mandeep and SweetyNarang, (2010) EVA® Disclosures in the Annual Reports of Indian Companies: An Empirical Study, Global Business Review October 2010 11: 395-420, doi:10.1177/097215091001100 306
Khan, S., Chouhan, V., Chandra, B., & Goswami, S. (2014). Sustainable accounting reporting practices of Indian cement industry: An exploratory study. Uncertain Supply Chain Management, 2(2), 61-72.
Khan, Shagufta, Vineet Chouhan, Bibhas Chandra, Shubhamgoswami, (2012) Measurement of Value Creation Vis-À-Vis EVA: Analysis of Select BSE Companies, Pacific Business Review International, Volume 5, Issue 3, September, pp. 114-131.
98
Lovata, Linda M. and Michael L. Costigan (2002), Empirical analysis of adopters of economic value added, Management Accounting Research, Volume 13, Issue 2, June 2002, Pages 215–228. http://dx.doi.org/10.1006/mare.2002.0181.
Mittal, R.K., Neena Sinha, Archana Singh (2008), Challenges of Implementing Economic Value Added, A Case Study of Godrej Consumer Products Limited, Global Business Review, August, vol. 9, no. 2, pp 287-298
Naghshbandi, N., Chouhan,V., Jain, P.(2016). Value based measurement of financial performance. International Journal of Applied Research, 2(2), 365-369.
Ramana, Reddy, M. Rajesh & Narayana, (2011), Valuation through EVA and Traditional Measures an Empirical Study International Journal of Trade, Economics and Finance, Vol.2, No.1, February.
Ray, Russ (2001), “Economic Value Added: Theory Evidence, A Missing Link”, Review of Business, Vol. 22, No. 2, Summer 2001.
Sakthivel, N. (2011), Value Creation in Indian Pharmaceutical Industry:A regression analysis, Research world, Journal of Arts Science & Commerce, Vol. II, Issue 1, January, pp. 215-232
Sharma, K. A. and Kumar, S. (2010) “Economic Value Added (EVA)—Literature Review and Relevant Issues,” Inter- national Journal of Economics and Finance, Vol. 2, No. 2, pp. 200-220.
Stern, J. 1993. "Value and people management". Corporate Finance, July: 35-37.
Stewart G B III (1994); EVA, fact and fantasy; Journal of Applied Corporate Finance; Vol 7 No 2 pp 71-87.
Stewart, G. Bennet (1993), “EVA TM : Fact and Fantasy”, Journal of Applied Corporate Finance, pp.6-19.
Stewart, G. Bennett (1994), “EVA TM: Fact and Fantasy”, Journal of Applied Corporate Finance, Summer, Vol. 7, No. 2, 1994, pp. 71-84.
Stewart, G.B. III.1991. "The quest for value". New York: Harper-Collins.
Theriou, Georgios N. Maditinos, Dimitrios I. and ZeljkoSevic, (2005), The Introduction of Economic Value Added (EVA) in the Greek Corporate Sector, The South European Review of Business & Accounting, Volume 4, Number 2,December, pp. 1-11.
Toni, A. De and Tonchia, S. (2001) Performance Measurement Systems:Models, Characteristics and Measures, International Journal of Operations &ProductiCon Management, vol.21, no. 1-2, pp 1-37.
Tortella, D. B. & Brusco, S. (2003). The Economic Value Added (EVA): an analysis of market reaction. Advances in Accounting, 20, 265–290.
Vijayakumar, A. (2011), Economic Value Added (EVA) and Shareholders Wealth Creation: A Factor Analytic Approach, Research Journal of Finance and Accounting, Vol 2, No 12, pp. 22-37