DOI: https://doi.org/10.30880/ijie.2018.10.01.022
*Corresponding author: shivaraj103@gmail.com
2018 UTHM Publisher. All right reserved. penerbit.uthm.edu.my/ojs/index.php/ijie
150
Investigate How Construction Waste Generation Rate Is
Different for Every Types of Project in Peninsular Malaysia
Using Site Visit Method
Shivaraj Subramaniam
1*, Abd Halid Bin Abdullah
1, Sasitharan Nagapan
1,
Kumanan Kupusamy
1, Haritharan Manian
1, Zawawi Daud
11
Faculty of Civil and Environmental Engineering,
Universiti Tun Hussein Onn Malaysia, Parit Raja, Batu Pahat 86400,Malaysia
Received 13 March 2018; accepted 28 April 2018, available online 01 May 2018
1. Introduction
Nowadays, construction industry engaged with many challenging issues such as produces substantial construction waste, cost overrun, delay problem, safety issue and poor-quality control [1]. In Malaysia, the most crucial issue highlighted by local researchers is excessive of construction and demolition (C&D) waste generation [2],[3]. Construction waste forms a significant portion of wastes that is finally disposed in landfills [4]. The waste dumped illegally to the landfills [2]. In addition, the transfer of construction and demolition waste at landfills has brought about major ecological concerns and government sources demonstrate that there is an intense lack of landfill space in Malaysia [5]. Moreover, pollution caused by construction waste has caused negative effects towards the environment and leads to economic lose [4]. Therefore, is an urgent requirement for the construction industry to reduce construction waste effectively, conserve landfill capacity and also it helps to achieve the concept of sustainability in waste construction [4].
Estimated the waste generation rate may serve as a useful indicator to the waste generation reduction benefits [6]. The amount construction waste generation is varying depend on types of projects [7]. The types of projects take important role in measuring the construction waste. Unfortunately, there is no accessible information with respect to generation rate of construction waste in Malaysia compare with other nations which they have a particular benchmark on construction waste consistently [6]. Therefore, this study is intended to investigate the construction waste generation and waste generation rate in Malaysia according to all types of project.
2. Literature Review
2.1
Types of project
Construction industry are classified types of projects into many. According to past researchers which showed in table 1, the major types of project which available in Malaysia are classified as residential, non-residential, Abstract: Malaysia is a rapid development of its urban centre, and where construction and demolition (C&D) waste generation is increasing proportionally with the new construction industry development. In Malaysia, the most crucial issue highlighted by local researchers is excessive of C&D waste generation. The transfer of construction and demolition waste at landfills has brought about major ecological concerns and government sources demonstrate that there is an intense lack of landfill space in Malaysia. The aim of this study is to investigate the construction waste generation rate in Malaysia due to different project types. To obtain the waste generation rate, construction sites visit is required. In construction site, direct and indirect approaches were utilized to collect C&D waste generation data based on data available. For the construction waste generation rate, non-residential projects obtained smallest value such as 0.008 t/m2 while non-residential projects obtained highest value such as 0.016 t/m2. Social amenities obtained 0.010 t/m2 of waste generation rate. Waste generation rate is different compare to waste generation due to projects sizes. Waste generation rate shows the actual waste generation for every projects type based on gross floor area. The gross floor area is important parts need to be considered during waste generation which provide actual waste generation data. Waste generation rate plays an important role to measure waste generation for every type of projects. This study, will be very much beneficial for contractors and clients to control the construction waste in construction site and to identify efficiencies of projects using waste generation rate. Besides that, provide a generation rate on construction waste to the Government for control the waste and reduce illegal dumping in future.
social amenities and infrastructure. The available types of construction projects in Malaysia as shown in table 1.
2.2 Construction waste issues in Malaysia
Construction industry is one of the main contributors to waste streams in Malaysia. Construction activities brought about a lot of construction waste expanded since during the most recent two decades. Regardless of being a waste patron, construction waste has additionally been outcome into ecological issues in Malaysia [3]. Issues of unlawful dumping have swelled quickly everywhere throughout the nation [16]. There are a lots of construction waste created in the nation because of rapid development in construction industry. Request of houses and real framework projects make the measure of construction waste getting expanded. Issues of unlawful dumping have swelled quickly everywhere throughout the nation as reported by Nagapan, Rahman & Asmi (2012) [2]. In Malaysia, the construction waste represents around 41% of aggregate solid waste yearly [17]. As the rate of construction waste is foreseen to keep expanding in Malaysia and all inclusive, it will soon present a greater challenge to the authorities in managing it [18]. Moreover, construction waste is a piece of the waste produced and classified under strong waste. It is supported where Malaysia construction waste frames a noteworthy bit of waste that is finally disposed in landfills. Construction waste materials can be characterized as the involving undesirable materials generated during construction. Moreover, contamination brought about by construction waste has created negative effects towards the earth and prompts to financial lose [19].2.3 Construction Waste Density
The construction waste data which obtained from direct method or indirect method will be in 2 units such as; metric cube and ton. Waste composition density is important for converting the waste to tonnage which very usual to compare all waste data in one unit. According to Solid Waste and Public Cleansing Management Corporation (SWCorp) for convert metric cube to ton need waste composition density as show in table 2 and
total waste amounts are generally described in tonnage [6].
Table 2. Waste Material Density
3. Objectives of the Study
The aim of this study is to investigate the construction waste generation rate in Malaysia due to different project types. In order to achieve the aim, this study embarks on the following objectives:
(i) Identify major project types in Malaysian construction industry.
(ii) Quantify construction waste generation for different types of project.
(iii)Establish construction waste generation rate towards different types of project.
3. Research Methodology
This methodology requires investigators to visit the construction sites for a realistic survey such as field measurement (FM). Direct or indirect approaches will be utilized to collect construction waste generation data by field measurement. The approaches were selected from literature review and tested in preliminary data collection which conducted in Kuala Lumpur, Malaysia.
3.1 Direct method
Direct measurement requires to weigh the waste produced or to measure its volume on site. For instance, Authors Year
Construction Project Types
Residential Non- residential
Social Amenities
Infra- structure
Commercial Industrial
Endut et al. 2005 ● ● ●
Masrom et al. 2015 ● ● ● ●
Ahmad et al. 2014 ● ● ●
Royle et al. 2010 ● ● ● ●
Grace 2010 ● ● ●
Abdelhamid 2014 ● ● ● ●
Y.Hoe et al. 2013 ● ● ● ●
Safa et al. 2015 ● ● ● ●
Total 9 6 6 8 2 2
Main Types of projects
Waste Composition
Density, k (t/m3)
Concrete 1.27
Soil and Aggregates 1.25
Brick 1.20
Tiles and ceramics 0.59
Metal 0.42
Timber 0.34
Glass 0.61
Plastics 0.23
Paper and cardboard 0.21
Mixed Waste/ Demolition Waste
152
four assumptions were made depending on how construction waste was stockpiled, gathered, scattered, or stacked. For stockpiled waste, a rectangular based pyramid was assumed, used Equation Vs = 1/3 L*B*H [19] to calculate the volume. For gathered waste, the layout shape was assumed cuboid, and the volume (Vg) was derived from Equation Vg = L*B*H [19].
3.2 Indirect method
For indirect method employed truck load records were used to estimate the volume of construction waste generated on site. The investigators recorded the number of trucks for waste collecting, together with the container’s volume of each. Based on this information, the total waste volume at a project level was derived.
3.3 Generation rate calculation
The quantification was used weight per construction area approximation. The gross floor area of the project was calculated from the building plan and recorded in the inventory form for calculation of waste generation rate. The construction waste generation rate was calculated by using the following equation 1 [20]:
C = W/GFA (1)
where:
W = Total waste generated from construction project (Ton or Kg)
GFA = Gross floor area C = Waste generation rate
4. Results and Discussion
Based on the previous researchers and research there are many type of the construction available in Malaysian construction industry. After do some literature review and preliminary survey on construction site, this research finds out that there were 4 types of construction mainly available and used in Malaysian construction industry such as residential, non-residential, social amenities and infrastructure. Meanwhile, waste generation rate not applicable for the infrastructure projects. So, this research mainly focused on residential, non-residential, and social amenities project.
4.1 Construction Waste Generation
a) Residential ProjectsFigure 1 shows the 3 months construction waste data between 5 residential project sites. Data were collected frequently for the following sites. Total waste produced by every site were calculated.
Fig. 1 Construction waste of Residential projects sites
According figure 1, shows that site 5 produced more construction waste which 233.1-ton, 170.21-ton and 155.4-ton compared others 4 sites. Meanwhile, site 4 produced very less construction waste compared to others site which is 6.12-ton, 7.2-ton and 6.3-ton. Every site produced different range of construction waste based on their projects. Site 1 and site 2 shows moderate construction waste production compared to site 1 and site 4. Construction waste for second month of site 3 shows very low waste which are 0.29-ton compared others site.
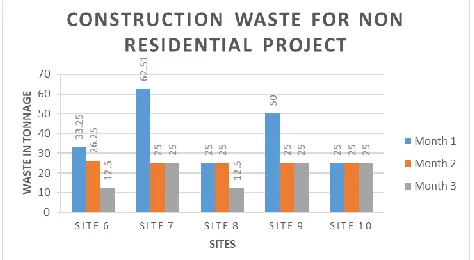
b) Non-Residential Projects
For non-residential projects 5 sites were selected. Five different types of non-residential projects were monitored to collect data. Figure 2 shows non-residential projects construction waste data which collected for 3 months period.
Fig. 2 Construction waste of Non-Residential projects sites
c) Social Amenities Projects
Figure 3 shows construction waste data produced by 5 different social amenities projects for 3 months period. All projects are in construction stage and conventional method were used for the construction.
Fig. 3 Construction waste of Social Amenities projects sites
According to figure 3, site 11 shows high construction waste data for 3 months compared others site. Site 11 produced 21.97-ton, 13.98-ton, and 13.88-ton of construction waste. All the construction waste data for 5 social amenities is very fluctuated in 3 months period. Site 14 only has stabilized data for the month 2 and month 3 such as 7.88-ton. For the site 15 first month waste is 20.66-ton meanwhile for the month 2 and month 3 the data is dropped into 1.52-ton and 2.84-ton.
4.2 Waste Generation Rate (WGR)
The WGR is a useful performance measure in managing waste across a spectrum of project sizes. Every project gross floor area (GFA) are calculated and total construction waste were used to determine WGR. Results show that, the different types of construction and different projects generate waste at different rates according to calculated gross floor area.
a) Residential Projects
5 residential projects data were used to calculate waste generation rate (WGR). Figure 4 shows different rate of WGR for every residential project.
Fig. 4 Waste Generation Rate for Residential Project
Based on figure 4, site 2 shows higher waste generation rate (WGR) compared to others 4 sites which is 0.045 t/m2 because the waste production is higher for this gross floor area. Meanwhile, site 4 shows very less WGR such as 0.001 t/m2 compared to others. Site 1 and site 3 shows same WGR such as 0.002 t/m2. Site 5 obtained 0.030 t/m2 of WGR which is second highest WGR for the residential projects among the 5 projects.
b) Non-Residential Projects
Figure 5 shows waste generation rate and average waste generation rate for non-residential projects. WGR is different for 5 non-residential project dues to different construction waste and different gross floor area (GFA).
Fig.5: Waste Generation Rate for Non-Residential Project
Based on figure 5, site 6 obtained highest WGR such as 0.018 t/m2 compared to others site. Site 10 was obtained smaller WGR among the 5 projects such as 0.002 t/m2. Meanwhile, site 7 0.004 t/m2, site 8 0.009 t/m2 and site 9 0.007 t/m2 WGR were obtained.
c) Social Amenities Projects
Figure 6 shows, calculated waste generation rate for 5 social amenities projects according to their total construction waste gross floor area. The total construction waste and gross floor area is smaller compared to residential projects and non-residential projects.
Fig. 6 Waste Generation Rate for Social Amenities Project
154
projects. Site 13 was obtained second highest WGR which are 0.012 t/m2 compared other 3 social amenities projects. Other than that, site 12 0.008 t/m2 and site 15 0.0011 t/m2 WGR were obtained.
4.3 Average Waste Generation
According waste generation rate (WGR) for all 15 sites, average waste generation rate (AWGR) was calculated for every type of construction. Table 3 shows average C&D waste and AWGR for 3 types of construction.
Table 3: Average Waste Generation and Waste Generation rate for all types of project
Based on table 3, average C&D waste and AWGR were calculated. For the average C&D waste, residential projects obtained highest value. Meanwhile, social amenities obtained very less amount of average C&D waste compare to others. For the average waste generation rate, residential project obtained highest rate and non-residential obtained lowest AWGR rate. Average C&D waste result is different compared to AWGR result. For average C&D waste residential projects obtained highest value while social amenities projects obtained lowest value. Meanwhile, for AWGR residential projects obtained highest value while non-residential projects obtained lowest value.
5. Conclusion
This study has successfully achieved the aim of this study which investigate how construction waste generation rate is different for every type of project in Peninsular Malaysia. According to past researchers and literature review, in Malaysian construction industry only 4 types of project were classified. In this research, 3 types of project were focused due to waste generation rate is not applicable for infrastructure projects. Based on this research, average construction waste generation for residential projects is higher with value of 197.02-ton compare to other two types of projects. While, social amenities projects getting the lower construction waste generation with value of 30.73-ton. The results happened due to various projects size. Non-residential projects with the medium scaled projects obtained 84.40-ton of average construction waste. Most of the residential projects consist of large project size which make the construction waste generation is higher. Meanwhile, social amenities projects consist of small size projects. The project size is an important part in measuring construction waste. For the construction waste generation rate, non-residential
projects obtained smallest value such as 0.008 t/m2 while residential projects obtained highest value such as 0.016 t/m2. Social amenities obtained 0.010 t/m2 of waste generation rate. Waste generation rate is different compare to waste generation due to projects sizes. Waste generation rate were calculated using gross floor area which shows the waste generation in ton per meter cube. Using waste generation rate able to compare with every type of projects. Waste generation rate shows the actual waste generation for every projects type based on gross floor area. The highest waste generation rate are residential projects due to floor design. Residential projects floor design is more complicated and large scaled compare with other types of projects. Non-residential projects were obtained lowest waste generation rate due to smallest gross floor area compare to other types of project. The construction waste generation make a different value once calculated with gross floor area. The gross floor area is important parts need to be considered during waste generation which provide actual waste generation data. Waste generation rate plays an important role to measure waste generation for every types of projects.
References
[1] J. Wang, H. Yuan, X. Kang, and W. Lu, “Critical success factors for on-site sorting of construction waste: A china study,” Resour. Conserv. Recycl., vol. 54, no. 11, pp. 931–936, 2010.
[2] S. Nagapan, I. A. Rahman, A. Asmi, A. H. Memon, and I. Latif, “Issues on construction waste: The need for sustainable waste management,” CHUSER 2012 - 2012 IEEE Colloq. Humanit. Sci. Eng. Res., no. Chuser, pp. 325–330, 2012.
[3] S. Nurzalikha and I. Zulhabri, “Government Initiatives Pertaining to Construction Waste Minimization in Malaysia,” Int. J. ENERGY Environ., vol. Volume 9, 2015.
[4] T. J. Sin, G. K. Chen, K. S. Long, I. Goh, and H. Hwang, “Current practice of waste management system in Malaysia : Towards sustainable waste management,” 1st FPTP Postgrad. Semin. "Towards Sustain. Manag., vol. 1106, pp. 1–19, 2013.
[5] G. Vasudevan, “Study on the Demolition Waste Management in Malaysia Construction Industry,”
Int. J. Sci. Eng. Technol., vol. 4, no. 3, pp. 131–135, 2015.
[6] C. M. Mah, T. Fujiwara, and C. S. Ho, “Construction and demolition waste generation rates for high-rise buildings in Malaysia,” Waste Manag. Res., 2016.
[7] C. T. Formoso, L. Soibelman, C. De Cesare, and E. L. Isatto, “Material Waste in Building Industry: Main Causes and Prevention,” J. Constr. Eng. Manag., vol. 128, no. 4, pp. 316–325, 2002.
[8] I. R. Endut, A. Akintoye, and J. Kelly, “Cost and Time Overruns of Projects in Malaysia,” ICONDA Prooceedings 2nd Scottish Conf. Postgrad. Res. Built Nat. Environ., no. 2001, pp. 243–252, 2005. Projects Average C&D
Waste (Ton)
Average WGR (t/m2)
Residential 197.02 0.016
Non-Residential 84.40 0.008
Social
[9] M. A. N. Masrom, M. H. I. A. Rahim, S. Mohamed, G. K. Chen, and R. Yunus, “Successful criteria for large infrastructure projects in Malaysia,” Procedia Eng., vol. 125, pp. 143–149, 2015.
[10] A. C. Ahmad, N. I. Husin, H. Zainol, A. H. A. Tharim, N. A. Ismail, and A. M. A. Wahid, “The Construction Solid Waste Minimization Practices among Malaysian Contractors,” vol. 7, pp. 1–9, 2014.
[11] M. T. Royle, “an Empirical Investigation of the,” vol. 3, no. 2, pp. 33–52, 2010.
[12] F. . Grace, “Types of construction projects,” Ezine Artic., pp. 1–2, 2010.
[13] M. S. Abdelhamid, “Assessment of different construction and demolition waste management approaches,” HBRC J., vol. 10, no. 3, pp. 317–326, 2014.
[14] Y. E. Hoe, “Causes of Abandoned Construction Projects in Malaysia,” Kuala Lumpur, 2013.
[15] M. Safa et al., “Classification of Construction
Projects,” no. July, 2015.
[16] S. Nagapan, I. A. Rahman, A. Asmi, and N. F. Adnan, “Study of site’s construction waste in Batu Pahat, Johor,” Procedia Eng., vol. 53, pp. 99–103, 2013.
[17] Z. Chen, S. A. P. C. Ramu, and F. S. Hamid, “Environmental Evaluation of Sanitary Landfills Establishment : Malaysian Case Studies,” vol. 599, pp. 224–228, 2012.
[18] C. M. Mah, “A survey of Construction and Demolition Waste in Malaysia, Mixed-Use Development,” Constr. Manag. Econ., vol. 22, no. 5, pp. 461–470, 2016.
[19] H. H. Lau, A. A. Whyte, and P. L. Law, “Composition and characteristics of construction waste generated by residential housing project,” Int. J. Environ. Res., vol. 2, no. 3, pp. 261–268, 2008. [20] S. A. Mahayuddin and W. A. Z. W. Zaharuddin,