*Corresponding author: mizan@uthm.edu.my
51
Cuff-Less Continuous Blood Pressure Monitoring System
Using Pulse Transit Time Techniques
Wan Suhaimizan Wan Zaki
1,2, Ricardo Correia
1, Serhiy Korposh
1, Barrie R
Hayes-Gill
1, Stephen P Morgan
11Optics and Photonics Group, Faculty of Engineering
University of Nottingham, NG7 2RD, UNITED KINGDOM
2Department of Electronic Engineering
Universiti Tun Hussein Onn Malaysia, 86400 Johor, MALAYSIA
1.
Introduction
Blood pressure (BP) is the pressure measured in millimetres of mercury (mmHg) exerted on the wall of a blood vessel as the blood passes through it. Two pressures are measured during a blood pressure reading: systolic blood pressure is a measure of blood pressure while the heart is beating and diastolic pressure is a measure of blood pressure while the heart is relaxed. Human blood pressure varies over 24 hours due to the changes of the human biological system. The blood pressure is usually high in the daytime and will slightly drop on the night. A 24 hour blood pressure reading can be obtained by an ambulatory blood pressure monitor (ABPM). This device basically is a small digital blood pressure machine that is attached to belt around body and a cuff connected on the upper arm. The machine takes blood pressure every 15-20 minutes during the daytime and 30 minutes at night [1]. The measurement data will be used by doctor to monitor hypertension [2] and to see the reaction of patients to specific drugs [3]. Some patients may feel discomfort, be distracted and be inconvenienced to have their blood
pressure measured by the cuff based ABPM [2,4]. Furthermore, the cuff based blood pressure measurement device gives BP reading over a 3 minute interval with no information on continuous blood pressure values. A continuous BP measurement is desirable for applications such as for assessing orthostatic hypotension [5] and during caesarean section surgery [6].
Pulse Transit Time (PTT) is one of promising method for cuff-less continuous blood pressure measurement. Most researchers define PTT as the delay time between the R-wave peak of the Electrocardiogram (ECG) and the peak of the Photoplethysmogram (PPG). The delay time between these two signals is shown to be correlated with blood pressure [7-10]. Increase in blood pressure causes vascular tone to increase and hence the arterial wall becomes stiffer causing the PTT to shorten. Conversely, a drop in blood pressure causes arterial wall tension and stiffness decrease thus increasing the PTT. This phenomenon can be explained by referring to the Moens-Korteweg Equation 1 [11]:
Abstract: This paper describes the development of a continuous cuff-less blood pressure system based on the pulse transit time (PTT) technique. In this study, PTT is defined by two different approaches denoted as PTT1 and PTT2. PTT1 is the time difference between the R-wave peak of the Electrocardiogram (ECG) and
the peak of the Photoplethysmogram (PPG). PTT2 is the time difference between two peak PPG signals on
same cardiac cycle at different positions on the body. The ECG is acquired on the chest using 3 lead electrodes and a reflection mode optical sensor is deployed on brachial artery and fingertip to monitor the PPGs. These data were synchronized using a National Instruments data acquisition card along with Matlab software for subsequent analysis. A wrist-type cuff-based blood pressure device was used to measure blood pressure on the right hand. Brachial blood pressure was measured on the upper left arm using oscillometric blood pressure monitor. Experiments were conducted by elevating the right hand at different position to investigate variability of PTT under the effects of hydrostatic pressure. Next the variability of PTT due to blood pressure changes during a Valsalva maneuver was investigated. The result shows that the PTT1 is inversely proportional to blood pressure in both experiments. Meanwhile, there is weak
correlation between PTT2 and blood pressure measurement which suggests that by excluding the pre-ejection
period (PEP) time in PTT calculation may reduce the accuracy of PTT for blood pressure measurement. In conclusion, PTT measurement between ECG and PPG signals has potential to be a reliable technique for cuff-less blood pressure measurement.
ρd Ea
PTT D
PWV (1)
where PWV is pulse wave velocity (m/s), D is length of the vessel (m), PTT is pulse transit time (s), E is elastic modulus of wall tissues (pa), a is wall thickness (m), ρ is the density of the contained blood within the vessel (kg/m3) and d is the interior diameter of the vessel (m).
Huges et al. reported that E increases exponentially with increasing blood pressure according to the Equation 2 [12]:
EEoeP (2)
where α is constant (mmHg-1), E
0 is the zero-pressure
modulus of the vessel wall and P is the BP (mmHg) within the vessel. This assumes that, in practice, the change in elasticity is much greater than the change in wall thickness and diameter of the vessel. Thus, PWV will increase with increase of blood pressure and the PTT inversely proportional to PWV.
In general, the ECG signal is acquired on the chest and the PPG signal at the finger for pulse transit time measurement [13-17]. This arrangement has a great attention due to availability of the measurement devices and to minimize error in the time domain due to distance between the heart and finger. Furthermore, these two signals are often simultaneously recorded by patient monitors in hospital and can be accessed through patient’s database system for PTT analysis [18]. The major drawback from this technique is the motion artefact on the PPG signal due to finger movement [19] and movement of arm position relative to vertical body which causes error in PTT measurement [20].
Therefore, other researchers used different locations on the body to acquire the PPG signal. One of the most promising parts of the body to obtain a PPG signal using transmission mode optical sensor is at the earlobe. The PPG signal at earlobe gives smaller error in PTT measurements because there is less effect of movement and the hydrostatic pressure is much more constant when the person moves from supine to standing position [21]. Studies by Jeong et al. show that the PTT between ECG on the chest and PPG on the earlobe have a linear response with systolic BP, but requires individual calibration to estimate BP [20]. However it is reported that PPG on the ears comprised more artefact and noise when compared with PPG at the finger [22]. This problem could be overcome with specifically designed PPG circuit with signal processing techniques for monitoring PPG signal at the earlobe site.
The transmission mode optical sensor for PPG detection shows relatively good signal compared to reflection mode optical sensor, but it is limited only to the certain body parts. Using a reflection mode optical sensor, the PPG signal can be obtained almost anywhere on the body. This has led to the development of small wearable devices consisting of ECG and PPG sensors for calculating PTT on the chest [23]. The device has a compact size and is able to monitor changes in blood
pressure with time during exercise. The only concern for the device is the measurement accuracy as it is still has a large measurement error when compared with available devices on the market [23].
Another way to determine PTT is by measuring the delay time between two PPGs signal at different locations on body. Through this method, PTT measurement devices will have simple interface system compared with the technique that uses ECG measurement which requires electrodes and additional circuitry. Jeong et al. had proposed PTT measurement using two PPG signals at earlobe and sternoclavicular and correlated this measurement with systolic blood pressure (SBP) during body postural change [9]. They estimated SBP in different body posture with a single equation. Furthermore, Amin et al. have shown that BP is highly correlates with PTT of two PPG signals during exercise [10]. They developed two identical optical sensor circuits to monitor PPG signals at finger with the distance between the sensor set to 55mm. PTT measurement between two PPGs pulses means that the pre-ejection period (PEP) measured in the ECG is excluded in PTT calculations. PEP is the time between the R-peak of the ECG and the opening of the aortic valve. Reports show that PEP has great contribution to the PTT change during daily activities such as posture change and dynamic exercise [3, 16]. Findings from Proenca et al. show that there is poor correlation between PTT and systolic BP in healthy young subjects during a sequence of short-term physical exercise if PEP is excluded from the PTT measurements [24]. This finding contradicts with that reported by Jeong et al. and Amin et al.. Therefore, further research is needed to clarify uncertainty relation between PTT of two PPGs pulses and blood pressure measurement.
Therefore, the aim of this study is to determine the best approach in determining PTT for blood pressure estimation. In this work, we defined PTT using two different approaches denoted as PTT1 and PTT2. PTT1 is
the time difference between the R-wave peak of the Electrocardiogram (ECG) and the peak of the Photoplethysmogram (PPG). PTT2 is the time
difference between two peak PPG signals on same cardiac cycle on the same arterial pathway. These positions were chosen to eliminate the different arrival time of PPG signals due to gravitation [25]. Besides, using the same arterial pathway will satisfy the assumption made in Moens-Korteweg model which used an infinitely long and straight vessel with elastic, isotropic, and homogenous walls for estimating pulse wave velocity [26]. Based on Equation 2, it is noted that vessel elasticity, E largely depends on blood pressure, thus make PTT decrease with increase of blood pressure.
2.
Experimental setup
The system block diagram for measuring PTT is shown in Figure 1. A reflectance mode optical sensor was used to capture the PPG signal on the brachial artery and fingertip. The PPG circuit consists of a green LED with wavelength of 530nm, ambient light photo sensor (APDS-9008) and operational amplifier. The LED was driven by 5 volt dc voltage. The green light that is transmitted to the skin will be absorbed by the pulsatile blood, and reflected light will be captured by the photo sensor. The sensor converts the light intensity into voltage and an operational amplifier is used to amplify the signal. Meanwhile, ECG board (STM32 ECG/EMG, Olimex) is used to monitor ECG signals on chest. The circuit consists of an instrumentation amplifier and active filter to convert electrical potential generated by electrical activity in cardiac tissue into readable voltage. A National Instruments data acquisition card is used to transfer the data to a computer and Labview software is used to visualize the waveform and recorded the signals. PTT1
and PTT2 was computed offline using Matlab software.
Peak detection algorithm was developed to determine the peak of the ECG and PPG signals for PTT measurements.
Fig.1System block diagram
In these studies, two experiments were performed by a healthy male adult, age of 35 years to investigate the correlation of PTT with BP. First experiment was conducted by elevating hand above heart level. This method will change the blood pressure due to the effect of hydrostatic pressure [27]. This experiment was conducted in seated position with the arm kept constant at the heart level. The ECG electrodes were placed on the chest and measured the ECG signal according to lead II configuration. PPG sensors were attached on the brachial artery and on the middle finger of the right arm. A wrist-type cuff-based blood pressure (OSTAR M100) was used to measure blood pressure on the right hand. A cuff based blood pressure monitor (OSTAR P2) was worn on the left upper arm for monitoring brachial blood pressure as a reference measurement. After 5 minutes seated in relaxed condition, the subject’s right hand was stretched out without bending and lifted to different positions above heart level without support. The height level was set to be 0, 15, 30, 45 and 60 cm, with 0 cm representing the base level of wrist position level with the heart. The right arm was maintained at these positions for 1 minute to record the ECG and PPGs signal. Simultaneously, radial blood pressure and brachial blood pressure were recorded.
In the second experiment, the subject performs a Valsalva maneuver to vary blood pressure. This technique used force exhalation against a closed airway to change
the blood pressure and has been applied by other researchers in their experiments [28, 29]. Shin et al. proposed that the R–J interval from ECG signal on the chest and feet can be used to estimate systolic BP continuously [28]. Authors correlated R-J interval with BP using Valsalva techniques. The same technique was used by Junior et al. to estimate the change of the blood pressure using smartphone [29]. In previous works the PTT was defined as the delay time between the heart sound and the ECG signal. In this research, we propose to measure PTT as the time delay between ECG to PPG signals and PPG to PPG signals simultaneously.
There are 4 phases involved in blood pressure changes throughout the execution of Valsalva maneuver [28]. In first phase, systolic BP will increase due to the initial inspiration. In second phase, the systolic BP will be maintained as the subject maintains the expiratory strain. In the third stage, the systolic BP drop to minimum level as breath released. In the last stage, systolic BP will return to pre-maneuver level again. The variability of the blood pressure during each phase of Valsalva maneuver was monitored using PTT techniques. In this experiment, the subject will rest in a seated position for 5 minutes before performing the Valsalva maneuver. The left and right hand are in rest positon on a table that is level with the heart. Blood pressure monitor (OSTAR P2) is used to measure the blood pressure on the upper left arm before and during the Valsalva maneuver process. The ECG signal was recorded on the chest using lead II configuration. PPGs signal on the brachial artery and on the middle finger of the right arm were recorded using reflection type optical sensor. The experiment was repeated 10 times and results are presented in the next section.
3.
Results and discussions
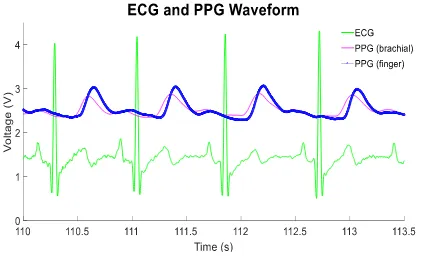
Figure 2 shows the ECG waveform acquired on the chest (green trace) and the PPG waveforms acquired on the brachial artery (pink trace) and middle finger (blue trace). All signals were measured simultaneously and plotted in voltage and time scale.
Fig. 2 ECG and PPGs waveforms
The blood flow at the body part can be measured using reflectance mode PPG sensor. As shown in Figure 2, the ECG signal is triggered first followed by the PPG brachial signal that occurs before the PPG at the finger. For 30 pulses, the average time of PTT1 for ECG to PPG finger
and ECG to PPG brachial artery was 367±7.7ms and 312±6.7ms respectively. The average time for PTT2 which
is the time difference between the two PPG pulses was 54±5.6ms. In general, the PTT values are different between each subject and depend on physiological factors and the measurement circuit used [7]. For instance, it has been reported that arterial walls become thicker and the elastic properties of the large arteries will reduced as the age increases [7]. This phenomenon leads to a decrease in Young’s modulus of arterial wall thus increasing the PTT. Besides, different filter design for ECG and PPG circuit may generate phase lag between those signals, thus lengthening the PTT [30]. From the literature, the PTT between ECG to PPG at the fingertips is in the range 300ms to 400ms [30] and PTT of two PPG signals between brachial and fingertip is reported around 50ms [31-32]. The position and the pressure applied on the sensor to the skin may also affect the PTT readings. Teng et al. have reported that the PTT will decrease as the contact force on the sensor probe increases [33]. Therefore, this force pressure on the sensor should be taken into account during PTT measurement to increase the accuracy. Moreover, individual calibration procedure is needed to obtain absolute blood pressure measurement using PTT techniques.
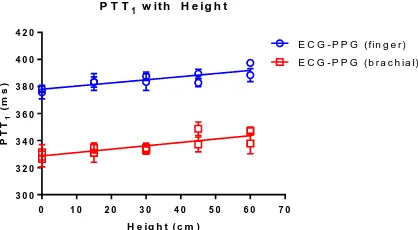
Figure 3 shows the experimental results for elevating hand at five different positions. The relationship between PTT1 and radial systolic blood pressure (SBP) is shown in
Figure 4. In this experiment, the right hand was elevated starting from 0 cm to 60 cm above heart level. The PTT1
between ECG to PPG at finger and ECG to PPG at brachial artery were recorded simultaneously.
Fig. 3PTT with different wrist height level
9 0 1 0 0 1 1 0 1 2 0 1 3 0 1 4 0 3 0 0
3 2 0 3 4 0 3 6 0 3 8 0 4 0 0 4 2 0
P T T1 w it h R a d ia l S B P
R a d i a l S B P ( m m H g )
P
T
T1
(
m
s
)
E C G - P P G ( f in g e r ) E C G - P P G ( b r a c h ia l)
Fig. 4PTT with radial systolic BP
The results in Figure 3 show that PTT1 steadily
increases when the right hand is elevated above heart level. This condition resulted from the increase of hydrostatic pressure due to the increase of height level. A similar pattern was reported by Poon et al. in their experiments on 11 subjects [34]. Their findings suggest that this technique can be used for PTT calibration in order to perform continuous BP measurements. During the PTT measurement, the radial blood pressure on the right wrist and brachial blood pressure on the upper left arm were recorded simultaneously. The brachial BP measurement is used as reference BP and result shows that the BP reading was unchanged when the subject lifted up his right hand. In contrast, radial blood pressure slightly dropped as the hand is elevated above heart level due to hydrostatic pressure. The relationship between PTT1 and radial SBP is shown in
Figure 4. The result shows that the PTT1 decrease with
increase of systolic radial blood pressure during hand elevation experiments. The inverse linear relation between PTT1 and BP is reported by many authors [35-37].
In this experiment the correlation analysis between PTT1 and BP was performed using GraphPad Prism
software. The correlation coefficient, R between radial BP and PTT1 (ECG to PPG finger) was -0.7105 for the systolic
BP and -0.7103 for diastolic BP. Meanwhile, for radial BP and PTT1 (ECG to PPG brachial), the R values for the
systolic BP was -0.6676 and -0.5308 for diastolic BP. This coefficient correlation value R is greater than -0.5 which indicates that PTT1 have a good negative relation with BP.
The different time between peak of PPG finger and peak of PPG brachial (PTT2) was calculated and plotted with radial
BP. Based on the plotting, correlation coefficient between radial BP and PTT2 was determined. The result shows that
the R value was 0.0065 for systolic BP and -0.1676 for diastolic BP. These R values indicated that there is no correlation between BP and PTT2.A second experiment
was conducted by using Valsalva maneuver techniques. Figure 5 shows the PTT1 responses with time during
Valsalva maneuver process.
0 1 0 2 0 3 0 4 0 5 0 6 0 7 0 3 0 0
3 2 0 3 4 0 3 6 0 3 8 0 4 0 0 4 2 0
P T T1 w it h H e ig h t
H e ig h t ( c m )
P
T
T1
(
m
s
)
Fig. 5 PTT during Valsalva maneuver
From the Figure 5, both traces that represent PTT1
changes with the time during the Valsalva maneuver period which occurred from 180s to 220s. The changes of PTT1
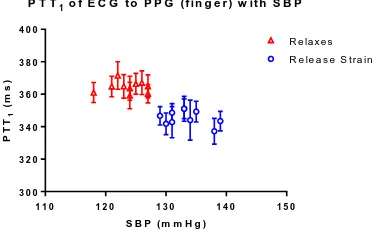
indicated that there were changes in BP values. In this experiment, the variability of PTT with BP measurement before and during the Valsalva maneuver was investigated. The results from this study are shown in Figure 6 and Figure 7. Figure 6 shows the PTT1 of ECG to PPG finger
with SBP and Figure 7 shows the PTT1 of ECG to PPG
brachial with SBP. The blood pressure was recorded before and during Valsalva maneuver which is denoted on the graph as relaxes and release strain respectively.
Fig. 6 PTT1 of ECG to PPG finger with SBP
Fig. 7 PTT1 of ECG to PPG brachial with SBP
These results show that the PTT1 has an inversely
relation with SBP. According to the correlation analysis, the correlation coefficient R in Figure 6 and Figure 7 was -0.8255 and -0.7789 respectively. The same analysis was applied for the PTT1 and diastolic BP and the result shows
that the correlation coefficient R was -0.7270 for ECG to PPG finger and -0.6463 for ECG to PPG brachial. Next,
the time difference between PPG finger and PPG brachial (PTT2) was determined and was plotted against systolic
and diastolic BP. The results show that the R value for PTT2 and systolic BP was -0.3336 and -0.4412 for diastolic
BP. These R values indicate that there is weak relationship between BP and PTT2. Both experiments revealed that
there is correlation between BP and PTT1 and these results
agree with findings from the other authors [34-36]. Meanwhile, there is a weak correlation between BP and PTT2 and this argument had been reported in the literature
[3,16,24]. One possible reason for this non dependency was related to PEP. The exclusion of PEP in the PTT2
calculation may reduce the accuracy of BP measurement with PTT [38].
In this work, there was a small data range of SBP of 25 mmHg for first experiment and 21 mmHg for second experiment. Nevertheless, the results obtained demonstrate that the PTT correlates well with the blood pressure changes. One of the possible applications of this system is development of a wearable device to monitor rapid modulations of blood pressure in falls detection system. The fall detection reliability can be increased by incorporating the blood pressure reading along with an accelerometer.
4.
Summary
In conclusion, the PTT between ECG and PPG signal correlates with BP change in hand elevating and Valsalva maneuver experiments. Meanwhile the PTT between PPG to PPG signal shows a weak correlation with BP in both experiments. This finding suggests that PEP has a major contribution to PTT changes with BP. Studies in a large numbers of subject will be conducted to support this argument for the future work. Moreover, results obtained from this study will be the basis for future research in designing wearable continuous blood pressure monitors.
References
[1] Vlahandonis, A., Biggs, S.N., Nixon, G.M., Davey, M.J., Walter, L.M. and Horne, R.S.,. Pulse transit time as a surrogate measure of changes in systolic arterial pressure in children during sleep. Journal of sleep research, Volume 23, (2014), pp. 406-413. [2] Chen, Z., Yang, X., Teo, J.T. and Ng, S.H.,.
Noninvasive monitoring of blood pressure using optical Ballistocardiography and Photoplethysmograph approaches. In 2013 35th Annual International Conference of the IEEE Engineering in Medicine and Biology Society (EMBC), (2013), pp. 2425-2428.
[3] Muehlsteff, J., Aubert, X.L. and Schuett, M.,. Cuffless estimation of systolic blood pressure for short effort bicycle tests: the prominent role of the pre-ejection period. In Conference proceedings: Annual International Conference of the IEEE Engineering in Medicine and Biology Society. IEEE Engineering in Medicine and Biology Society. Annual Conference, Volume 1, (2006), pp. 5088-5092.
[4] Solà, J., Proença, M., Ferrario, D., Porchet, J.A., Falhi, A., Grossenbacher, O., Allemann, Y., Rimoldi, S.F. and Sartori, C.,. Noninvasive and nonocclusive blood pressure estimation via a chest
0 1 0 0 2 0 0 3 0 0 4 0 0 5 0 0 2 6 0
2 8 0 3 0 0 3 2 0 3 4 0 3 6 0 3 8 0 4 0 0
P T T1 d u r in g V a l s a l v a M a n e u v e r
t i m e ( s )
P
T
T1
(
m
s
)
E C G - P P G ( f in g e r ) E C G - P P G ( b r a c h ia l)
1 1 0 1 2 0 1 3 0 1 4 0 1 5 0 3 0 0
3 2 0 3 4 0 3 6 0 3 8 0 4 0 0
P T T1o f E C G t o P P G ( f in g e r ) w it h S B P
S B P ( m m H g )
P
T
T1
(
m
s
)
R e la x e s R e le a s e S tra in
1 1 0 1 2 0 1 3 0 1 4 0 1 5 0 2 6 0
2 8 0 3 0 0 3 2 0 3 4 0 3 6 0
P T T1 o f E C G t o P P G ( b r a c h ia l) w it h S B P
S B P ( m m H g )
P
T
T1
(
m
s
)
sensor. IEEE Transactions on Biomedical Engineering, Volume 60, (2013), pp. 3505-3513. [5] Deegan, B.M.T., O'Connor, M., Lyons, D. and
OLaighin, G.,. Development and evaluation of new blood pressure and heart rate signal analysis techniques to assess orthostatic hypotension and its subtypes. Physiological measurement, Volume 28, (2007), pp. 87-102.
[6] Fung, P., Dumont, G., Ries, C., Mott, C. and Ansermino, M.,. Continuous noninvasive blood pressure measurement by pulse transit time. In Engineering in Medicine and Biology Society,
Volume 1, (2004), pp. 738-741.
[7] Nitzan, M., Khanokh, B. and Slovik, Y.,. The difference in pulse transit time to the toe and finger measured by photoplethysmography. Physiological measurement, Volume 23, (2001), pp. 85-93. [8] Chen, Y.K., Wu, H.T., Chi, C.K., Tsai, W.C., Chen,
J.Y. and Wang, M.C.,. A new dual channel pulse wave velocity measurement system. In Proceedings Bioinformatics and Bioengineering, (2004),pp. 17-21.
[9] Jeong, H., Hayashi, M., Sekine, M., Tamura, T., Kido, M., Yamada, K. and Ohno, Y.,. A study on estimating blood pressure during body postural change based on pulse transit time. In Healthcare Innovation Conference (HIC), (2014), pp. 153-156. [10] Younessi Heravi, M.A. and Khalilzadeh, M.A.,.
Designing and constructing an optical system to measure continuous and cuffless blood pressure using two pulse signals. Iranian Journal of Medical Physics, Volume 11, (2014), pp. 215-223.
[11] McCarthy, B.M., O'Flynn, B. and Mathewson, A.,. An investigation of pulse transit time as a non-invasive blood pressure measurement method. In Journal of Physics: Conference Series, Volume 30, (2014), pp. 1-5.
[12] Hughes, D. J., C. F. Babbs, L. A. Geddes, and J. D. Bourland. "Measurements of Young's modulus of elasticity of the canine aorta with ultrasound."
Ultrasonic Imaging 1, Volume 4, (1979), pp. 356-367.
[13] Zhang, J.M., Wei, P.F. and Li, Y., 2008, May. A LabVIEW based measure system for pulse wave transit time. In Information Technology and Applications in Biomedicine, (2008), pp. 477-480. [14] Li, Y., Wang, Z., Zhang, L., Yang, X. and Song, J.,.
Characters available in photoplethysmogram for blood pressure estimation: beyond the pulse transit time. Australasian Physical & Engineering Sciences in Medicine, Volume 37, (2014), pp. 367-376. [15] Terminelli, L., Carpignano, F., May, J.M., Merlo, S.
and Kyriacou, P.A., Photoplethysmography and electrocardiography for real time evaluation of pulse transit time A diagnostic marker of peripheral vascular diseases. In Photonics Technologies,
(2014), pp. 1-4.
[16] Muehlsteff, J., Aubert, X.A. and Morren, G.,. Continuous cuff-less blood pressure monitoring based on the pulse arrival time approach: The impact of posture. 30th Annual International Conference of the IEEE, (2008), pp. 1691-1694. [17] Dvorak, J. and Havlik, J.,. Pulse transition time in
heamodynamic measurement: Methods, problems, hardware equipment and first results. In Applied Electronics, (2013), pp. 1-3.
[18] He, X., Goubran, R.A. and Liu, X.P.,. Evaluation of the correlation between blood pressure and pulse
transit time. In Medical Measurements and Applications Proceedings, (2013), pp. 17-20. [19] Foo, J.Y.A., Wilson, S.J., Williams, G.R., Harris,
M. and Cooper, D.M.,. Motion artefact reduction of the photoplethysmographic signal in pulse transit time measurement. Australasian Physics & Engineering Sciences in Medicine, Volume 27, (2004), pp. 165-173.
[20] Jeong, G.Y., Yu, K.H. and Kim, N.G.,. Continuous blood pressure monitoring using pulse wave transit time. International Conference on Control, Automation and Systems, Seoul, Korea, Volume 4, (2005), pp. 2-5.
[21] Guo, D.G., Tay, F.E., Xu, L., Yu, L.M., Nyan, M.N., Chong, F.W., Yap, K.L. and Xu, B.,. A long-term wearable vital signs monitoring system using BSN. In Digital System Design Architectures, Methods and Tools, (2008), pp. 825-830.
[22] Špulák, D., Čmejla, R. and Fabián, V.,. Experiments with blood pressure monitoring using ECG and PPG. In Proceedings of the Conference Technical Computing Bratislava, (2010), pp. 1-5.
[23] Puke, S., Suzuki, T., Nakayama, K., Tanaka, H. and Minami, S.,. Blood pressure estimation from pulse wave velocity measured on the chest. Annual International Conference of the IEEE Engineering in Medicine and Biology Society, (2013), pp. 6107-6110.
[24] Proença, J., Muehlsteff, J., Aubert, X. and Carvalho, P.,. Is pulse transit time a good indicator of blood pressure changes during short physical exercise in a young population?. Annual International Conference of the IEEE Engineering in Medicine and Biology, (2010), pp. 598-601.
[25] Myllylä, Teemu, Vesa Korhonen, Erkki Vihriälä, Hannu Sorvoja, Tuija Hiltunen, Osmo Tervonen, and Vesa Kiviniemi. "Human heart pulse wave responses measured simultaneously at several sensor placements by two MR-compatible fibre optic methods." Journal of Sensor, Volume 2012, (2012), pp. 1-8.
[26] Shahmirzadi, Danial, Ronny X. Li, and Elisa E. Konofagou. "Pulse-wave propagation in straight-geometry vessels for stiffness estimation: theory, simulations, phantoms and in vitro findings."
Journal of Biomechanical Engineering, Volume 134, (2012), pp. 1-6.
[27] Liu, Y. and Zhang, Y.,. Pulse transit time and arterial blood pressure at different vertical wrist positions. Submitted to Physiol. Meas. London, (2006), pp. 1-3.
[28] Shin, J.H., Lee, K.M. and Park, K.S.,. Non-constrained monitoring of systolic blood pressure on a weighing scale. Physiological measurement, Volume 30, (2009), pp. 679-693.
[29] Junior, A.D., Murali, S., Rincon, F. and Atienza, D.,. Estimation of blood pressure and pulse transit time using your smartphone. In Digital System Design, (2015), pp. 173-180.
[30] Fung, P., Dumont, G., Ries, C., Mott, C. and Ansermino, M., 2004, September. Continuous noninvasive blood pressure measurement by pulse transit time. In Engineering in Medicine and Biology Society, Volume 1, (2004), pp. 738-741. [31] Deb, S., Nanda, C., Goswami, D., Mukhopadhyay,
[32] Tseng, H.J., Tian, W.C. and Wu, W.J.,. Flexible PZT thin film tactile sensor for biomedical monitoring. Sensors, Volume 13, (2013), pp.5478-5492.
[33] Teng, X.F. and Zhang, Y.T.,. Theoretical study on the effect of sensor contact force on pulse transit time. IEEE Transactions on Biomedical Engineering, Volume 54, (2007), pp. 1490-1498. [34] Poon, C.C., Zhang, Y.T. and Liu, Y.,. Modeling of
pulse transit time under the effects of hydrostatic pressure for cuffless blood pressure measurements.
IEEE/EMBS International Summer School on Medical Devices and Biosensors, (2006), pp. 65-68. [35] Ye, S.Y., Kim, G.R., Jung, D.K., Baik, S.W. and Jeon, G.R.,. Estimation of systolic and diastolic pressure using the pulse transit time. World
Academy of Science, Engineering and Technology, Volume 67, (2010), pp. 726-731.
[36] Yan, Y. and Zhang, Y.,. Modeling the effects of radial blood pressure change on pulse transit time.
In Proceedings of the International Special Topic Conference on Information Technology in Biomedicine, (2006), pp. 4-6.
[37] Lass, J., Meigas, I.C., Karai, D., Kattai, R., Kaik, J. and Rossmann, M.,. Continuous blood pressure monitoring during exercise using pulse wave transit time measurement. In Engineering in Medicine and Biology Society, Volume 1, (2004), pp. 2239-2242. [38] Wong, M.Y.M. and Zhang, Y.T.,. The effects of