A Comparison Study on the Performances Of
X
,
EWMA and CUSUM Control
Charts for Skewed Distributions Using Weighted Standard Deviations Methods
Abdu. M. A. Attaa and Razamin Ramlib a,b Quantitative Sciences Program
College of Art and Sciences, Universiti Utara Malaysia, 06010 Sintok, Kedah, Malaysia Corresponding email: [email protected] , [email protected], [email protected]
Abstract
In many statistical process control (SPC) applications, the ease of use of control charts leads to ignoring the fact that the process population of the quality characteristic being measured may be highly skewed. However, in many situations, the normality assumption is usually violated. Among the recent heuristic charts for skewed distributions proposed in the literature are those based on the weighted standard deviation (WSD) method. Thus, this paper compares the performances of certain WSD charts, such as WSDX , WSD Exponential weighted moving Average (WSD-EWMA) and WSD Cumulative Sum (WSD-CUSUM) charts for skewed distributions. The skewed distributions being considered are weibull, gamma and lognormal. The false alarm and mean shift detection rates were computed so as to evaluate the performances of the WSD charts. The WSDX chart was found to have the lowest false alarm rate in cases of known and unknown parameters. Moreover, when parameters are known and unknown, the WSD-CUSUM provided the highest mean shift detection rates. The chart with the lowest false alarm and the highest mean shift detection rates for most level of skewness and sample size, n is assumed to be have a better performance.
1. INTRODUCTION
A control chart is a time sequence plot with “decision lines” added. The decision lines are the lower control limit (LCL), the center line (CL) and the upper control limit (UCL). These decision lines are chosen so that an out-of-control signal can be identified (Ryan, 2000). As long as all the sample points plot within the control limits, a process is assumed to be in-control and no action is necessary. However, sample points that plot beyond the control limits indicate that a process is out-of-control and investigations and corrective actions are required to find and remove the assignable causes responsible for this behavior.
The sample points on a control chart are usually connected with straight-line segments so that it is easier to visualize how the sequence of points has evolved overtime (Montgomery, 2005). The most common univariate variables control charting techniques used in the monitoring of shifts in the process mean are the Shewhart
X
, cumulative sum (CUSUM) and exponentially weighted moving average (EWMA). TheX
chart is quick in detecting large shifts, while both the CUSUM and EWMA charts are sensitive to small shifts.These control charting techniques i.e. the
X
, EWMA and CUSUM all depend on the assumption that the distribution of a quality characteristic is normal or approximately normal. When the underlying distribution is non-normal, three approaches are presently employed to deal with this problem. The first approach is to increase the sample size until the sample mean is approximately normally distributed. The second approach is to transform the original data so that the transformed data have an approximate normal distribution. The third approach is to use heuristic methods to design the control charts (Bai and Choi, 1995). In consequence, Chang and Bai (2001) proposed a heuristic method for constructing the WSDX , EWMA and WSD-CUSUM charts for skewed distributions.Subsequently, this paper, comparison between
X
, EWMA and CUSUM control charts are made using weighted standard deviation (WSD) method for skewed distributions, to study their performances in term of false alarm and mean shift detection rates. This paper is organized as follows:Section 2 explains the weighted standard deviation method, Sections 3, 4 and 5 discuss the WSD
X , WSD-EWMA and WSD-CUSUM charts, respectively. Section 6 compares the performances of the three types of charts for skewed distributions. Finally, conclusions are drawn in Section 7.
2. WEIGHTED STANDARD DEVIATION METHOD
The basic idea of the weighted standard deviations (WSD) method is that a skewed distribution can be splitted into two segments at its mean, where each segment is used to create a new symmetric distribution. The two new distributions created from the original skewed distribution would have the same mean but different standard deviations.
The WSD method uses the two created symmetric distributions to set the limits of the WSD control charts. Specifically, one of the two new distributions is used to compute the upper control limit, while the other is used to compute the lower control limit of the WSD chart. Hence, when we use the WSD method, the control limits of the WSD
X
and WSD-EWMA charts are set using multiples of (2P
X)
X and [2
1
P
X
]
X for the upper and lower control limits, respectively, while the control limits of the WSD-CUSUM chart uses 1 / [(2P
X)
X] and 1 / ([2
1
P
X
]
X) Here,P
X
P
X
X
is the probability that the random variable X isless than or equal to its mean. However, in practice ,P
X and process parameters must be estimated. SinceX
number of observations less than or equal to
X
,
n m X X I P m i n j ij X
1 1ˆ
, where m and n are the number of samples in the preliminary data set and the sample size, respectively, and I(x) = 1 if x 0 or I(x) = 0, otherwise. Note also that,
X
denotes the sample grand mean.3. WSD
X
CHARTThe limits of the WSDX chart (Chang and Bai, 2001) are
X
X
X
X
3
n
2
P
-UCL
WSD
(1a)and X X X
P
X
n
3
2
1
-LCL
WSD , (1a) when parameters are known, andWSD WSD
2
ˆ
UCL
-
XX
3
R
2
P
Xd
n
(2a)And WSD WSD
2
ˆ
LCL
-
XX
3
R
2 1
P
Xd
n
, (2b)when parameters are unknown. Here,
X
andR
denote the sample grand mean and the average sample range, respectively, computed from a preliminary data set assumed to be in-control, andd
2WSD
P d
X 2
2 1
n
P
X
1
P
X
2
d
2nP
X
, (3) whered
2
n
is factors for center line for the normal distribution when the sample size is n.See (Montgomery, 2005).4. WSD-EWMA CHART
The WSD–EWMA chart statistics (Chang and Bai, 2001) is
E
i
X
i
1
E
i1, for i = 1, 2, … (4)where (0 < 1) is a smoothing constant and
E
0
X . The limits of the WSDEWMA chart are
UCL
WSD EWMA-
2
2
X
X
K
P
Xn
(5a) andLCL
WSD EWMA-
2 1
2
XX
K
P
Xn
, (5b) where the selection of λ and K is based on the approach discussed by Lucas and Saccucci (1990). An out-of-control signal is issued by the WSD-EWMA chart at time i whenE
i
UCL
WSD-EWMA orE
i< LCL
WSD-EWMA.If parameters are unknown, the control limits of the WSD–EWMA chart are as follows:
P
Xn
d
R
K
X
2
ˆ
λ
2
λ
UCL
WSD 2 EWMA WSD
and
2
1
-
ˆ
λ
2
λ
UCL
WSD 2 EWMAWSD
P
Xn
d
R
K
X
. (6b)
5. WSD-CUSUM CHART
The charting statistics for the WSD–CUSUM chart (Chang and Bai, 2001) are
CU iWSD, , max 0,
CU iWSD1
ZU iWSD, γUWSD
, for i = 1, 2, … (7a)and WSD
WSD
WSD WSD
, ,
min 0,
1 ,L i L i L i L
C
C
Z
, for i = 1, 2, … (7b) whereC
UWSD ,0
C
LWSD ,0 = 0, while the standardized statistics areWSD,
2
i X U i X XX
Z
P
n
(8a)and
WSD ,2 1
i X L i X XX
Z
P
n
. (8b) The reference values are
γ
WSDδ
4
UX
P
(9a)and
WSD δ γ 4 1 L X P . (9b) Here, is the magnitude of a shift in the mean, in multiples of standard deviation of the sample mean, where a quick detection is required. An out-of-control signal is given at time, i, if
h
C
UWSDi
, or
C
Li
h
WSD
, , where h is selected to give a desired in-control ARL (Chang and Bai,
2001).
When parameters are unknown, the WSD–CUSUM control chart statistics are also computed using Equations (7a) and (7b) but the standardized statistics,
Z
U iWSD, andZ
L iWSD, are computed as
WSD , WSD 2ˆ
2
i U i Xn X
X
Z
R
P
d
(10a)and
WSD , WSD 2ˆ
2 1
i L i Xn X
X
Z
R
P
d
, (10b)
respectively. The reference values are computed using the following formulae:
γ
WSDδ
ˆ
4
U
X
P
(11a)and
WSD δ γ ˆ 4 1 L X P 6. COMPARISON OF PERFORMANCES OF CONTROL CHARTS FOR SKEWED DISTRIBUTIONS
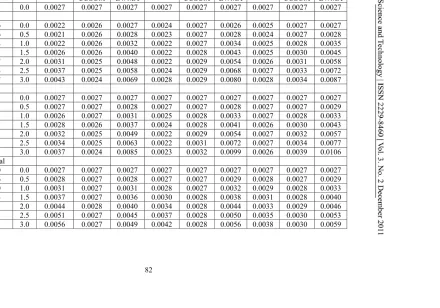
This section discusses the performances of
X
, EWMA and CUSUM control charts for skewed distributions. The skewed distributions considered in this analysis are weibull, gamma and lognormal. The simulation studies of the WSD charts are conducted using SAS program version 9. Generally, all WSD charts for skewed distributions being considered are compared based on skewness coefficients of
3 = {0.5, 1, 1.5, 2. 2.5, 3 } , sample size, are n = {4, 7, 10 } and magnitude of shit = {0.25, 0.50, 1, 1.5, 2 }.Tables 1 and 2 present the false alarm rates of the three WSD charts for skewed distributions for known and unknown parameters respectively. Table 1 shows that the false alarm rates of the three WSD charts for skewed distributions increase as the level of skewness coefficient increases, except that some cases of the WSD-CUSUM decrease when the sample size, n = 4. In general, Table 1 shows that the false alarm rates of WSD charts increase when sample size, n increases, except for some cases of the WSDX chart with gamma distribution, where they decrease. Overall, among all the three WSD charts, lower false alarm rates were provided by WSDX chart, except for some cases when sample size, n = 4. In addition, WSD-CUSUM has lower false alarm rates than that of the WSDX chart and WSD-EWMA.
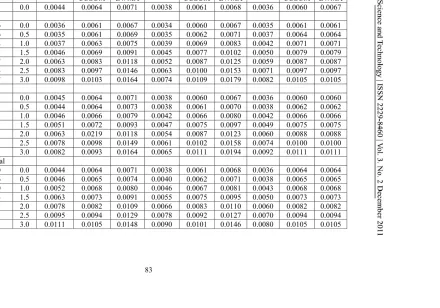
Subsequently, Table 2 shows that when the level of skewness increases the false alarm rates of the three WSD charts also increase. Note also that in general, the false alarm rates of the three WSD charts decrease when sample size, n increases. Overall, Table 2 shows that the WSD
Table 1: False alarm rates for known parameters
N
4 7 10
Distribution
s 3 WSD X CUSUM WSD EWMA WSD
X
WSD WSD
CUSUM EWMA WSD
X
WSD WSD
CUSUM EWMA WSD
Normal 0.0 0.0027 0.0027 0.0027 0.0027 0.0027 0.0027 0.0027 0.0027 0.0027
Weibull
3.6286 0.0 0.0022 0.0026 0.0027 0.0024 0.0027 0.0026 0.0025 0.0027 0.0027 2.2266 0.5 0.0021 0.0026 0.0028 0.0023 0.0027 0.0028 0.0024 0.0027 0.0028 1.5688 1.0 0.0022 0.0026 0.0032 0.0022 0.0027 0.0034 0.0025 0.0028 0.0035 1.2123 1.5 0.0026 0.0026 0.0040 0.0022 0.0028 0.0043 0.0025 0.0030 0.0045 0.9987 2.0 0.0031 0.0025 0.0048 0.0022 0.0029 0.0054 0.0026 0.0031 0.0058 0.8598 2.5 0.0037 0.0025 0.0058 0.0024 0.0029 0.0068 0.0027 0.0033 0.0072 0.7637 3.0 0.0043 0.0024 0.0069 0.0028 0.0029 0.0080 0.0028 0.0034 0.0087
Gamma
38000 0.0 0.0027 0.0027 0.0027 0.0027 0.0027 0.0027 0.0027 0.0027 0.0027
15.4 0.5 0.0027 0.0027 0.0028 0.0027 0.0027 0.0028 0.0027 0.0027 0.0029
3.913 1.0 0.0026 0.0027 0.0031 0.0025 0.0028 0.0033 0.0027 0.0028 0.0033 1.788 1.5 0.0028 0.0026 0.0037 0.0024 0.0028 0.0041 0.0026 0.0030 0.0043 0.983 2.0 0.0032 0.0025 0.0049 0.0022 0.0029 0.0054 0.0027 0.0032 0.0057 0.648 2.5 0.0034 0.0025 0.0063 0.0022 0.0031 0.0072 0.0027 0.0034 0.0077 0.442 3.0 0.0037 0.0024 0.0085 0.0023 0.0032 0.0099 0.0026 0.0039 0.0106
Lognormal
Table 2: False alarm rate for unknown parameters
N
4 7 10
Distribution
s 3 WSD X CUSUM WSD EWMA WSD
X
WSD WSD
CUSUM EWMA WSD
X
WSD WSD
CUSUM EWMA WSD
Normal 0.0 0.0044 0.0064 0.0071 0.0038 0.0061 0.0068 0.0036 0.0060 0.0067
Weibull
3.6286 0.0 0.0036 0.0061 0.0067 0.0034 0.0060 0.0067 0.0035 0.0061 0.0061 2.2266 0.5 0.0035 0.0061 0.0069 0.0035 0.0062 0.0071 0.0037 0.0064 0.0064 1.5688 1.0 0.0037 0.0063 0.0075 0.0039 0.0069 0.0083 0.0042 0.0071 0.0071 1.2123 1.5 0.0046 0.0069 0.0091 0.0045 0.0077 0.0102 0.0050 0.0079 0.0079 0.9987 2.0 0.0063 0.0083 0.0118 0.0052 0.0087 0.0125 0.0059 0.0087 0.0087 0.8598 2.5 0.0083 0.0097 0.0146 0.0063 0.0100 0.0153 0.0071 0.0097 0.0097 0.7637 3.0 0.0098 0.0103 0.0164 0.0074 0.0109 0.0179 0.0082 0.0105 0.0105
Gamma
38000 0.0 0.0045 0.0064 0.0071 0.0038 0.0060 0.0067 0.0036 0.0060 0.0060
15.4 0.5 0.0044 0.0064 0.0073 0.0038 0.0061 0.0070 0.0038 0.0062 0.0062
3.913 1.0 0.0046 0.0066 0.0079 0.0042 0.0066 0.0080 0.0042 0.0066 0.0066 1.788 1.5 0.0051 0.0072 0.0093 0.0047 0.0075 0.0097 0.0049 0.0075 0.0075 0.983 2.0 0.0063 0.0219 0.0118 0.0054 0.0087 0.0123 0.0060 0.0088 0.0088 0.648 2.5 0.0078 0.0098 0.0149 0.0061 0.0102 0.0158 0.0074 0.0100 0.0100 0.442 3.0 0.0082 0.0093 0.0164 0.0065 0.0111 0.0194 0.0092 0.0111 0.0111
Lognormal
84
Table 3:Mean shift detection rates for known parameters
N
4 7 10
3
WSD X WSDCUSUM WSD
EWMA WSDX WSDCUSUM EWMA WSD WSDX WSDCUSUM EWMA WSD
3.6286 0.0 0.25 0.0062 0.0285 0.0330 0.0099 0.0490 0.0540 0.0142 0.0682 0.0732
0.50 0.0233 0.1010 0.1053 0.0485 0.1528 0.1562 0.0810 0.1950 0.1972
1.00 0.1644 0.2598 0.2601 0.3688 0.3556 0.3521 0.5729 0.4235 0.4183
1.50 0.5086 0.4028 0.3978 0.8337 0.5091 0.5002 0.9590 0.5890 0.5689
2.00 0.8402 0.5134 0.5041 0.9900 0.6712 0.6418 0.9997 0.8741 0.8423
2.2266 0.5 0.25 0.0060 0.0254 0.0264 0.0080 0.0444 0.0451 0.0106 0.0625 0.0625
0.50 0.0188 0.0933 0.0924 0.0351 0.1428 0.1409 0.0568 0.1828 0.1796
1.00 0.1185 0.2436 0.2394 0.2818 0.3348 0.3273 0.4725 0.4017 0.3923
1.50 0.4072 0.3814 0.3726 0.7717 0.4892 0.4803 0.9437 0.5519 0.5348
2.00 0.7795 0.4949 0.4837 0.9878 0.6107 0.5816 0.9998 0.8051 0.7584
1.5688 1.0 0.25 0.0060 0.0226 0.0211 0.0069 0.0406 0.0375 0.0083 0.0575 0.0532
0.50 0.0157 0.0866 0.0807 0.0261 0.1338 0.1270 0.0410 0.1716 0.1640
1.00 0.0866 0.2300 0.2218 0.2101 0.3176 0.3058 0.3786 0.3829 0.3704
1.50 0.3131 0.3618 0.3484 0.6879 0.4729 0.4600 0.9133 0.5283 0.5152
2.00 0.6950 0.4778 0.4636 0.9816 0.5685 0.5453 0.9999 0.7285 0.6737
1.2123 1.5 0.25 0.0062 0.0206 0.0174 0.0064 0.0375 0.0314 0.0071 0.0538 0.0459
0.50 0.0145 0.0810 0.0716 0.0216 0.1267 0.1159 0.0315 0.1632 0.1514
1.00 0.0676 0.2193 0.2065 0.1596 0.3030 0.2883 0.3025 0.3667 0.3506
1.50 0.2422 0.3454 0.3307 0.5964 0.4575 0.4395 0.8768 0.5142 0.5019
2.00 0.6051 0.4610 0.4424 0.9740 0.5420 0.5266 0.9999 0.6604 0.6118
0.9987 2.0 0.25 0.0066 0.0188 0.0144 0.0064 0.0350 0.0266 0.0067 0.0510 0.0399
0.50 0.0139 0.0769 0.0644 0.0189 0.1212 0.1068 0.0259 0.1562 0.1417
1.00 0.0556 0.2108 0.1943 0.1263 0.2916 0.2751 0.2420 0.3532 0.3341
0.8598 2.5 0.25 0.0071 0.0174 0.0127 0.0066 0.0330 0.0233 0.0066 0.0485 0.0352
0.50 0.0136 0.0736 0.0582 0.0173 0.1164 0.0993 0.0228 0.1505 0.1333
1.00 0.0479 0.2037 0.1850 0.1043 0.2824 0.2639 0.2001 0.3429 0.3222
1.50 0.1588 0.3237 0.3036 0.4522 0.4290 0.4041 0.7824 0.4998 0.4826
2.00 0.4417 0.4303 0.4060 0.9541 0.5214 0.5121 1.0000 0.5855 0.5532
0.7637 3.0 0.25 0.0076 0.0163 0.0112 0.0068 0.0315 0.0208 0.0067 0.0464 0.0317
0.50 0.0136 0.0708 0.0532 0.0163 0.1130 0.0932 0.0208 0.1460 0.1265
1.00 0.0430 0.1986 0.1776 0.0889 0.2764 0.2553 0.1687 0.3336 0.3120
1.50 0.1342 0.3161 0.2935 0.3925 0.4164 0.3917 0.7309 0.4943 0.4733
2.00 0.3796 0.4177 0.3935 0.9389 0.5172 0.5086 1.0000 0.5653 0.5387
Table 4:Mean shift detection rates for unknown parameters
N
4 7 10
3
WSD X WSDCUSUM WSD
EWMA WSDX WSDCUSUM EWMA WSD WSDX WSDCUSUM EWMA WSD
3.6286 0.0 0.25 0.0086 0.0321 0.0358 0.0123 0.0514 0.0558 0.0170 0.0699 0.0744
0.50 0.0283 0.1014 0.1056 0.0544 0.1534 0.1567 0.0891 0.1958 0.1979
1.00 0.1728 0.2599 0.2602 0.3737 0.3556 0.3525 0.5753 0.4259 0.4204
1.50 0.5019 0.4027 0.3979 0.8293 0.5126 0.5029 0.9578 0.5983 0.5781
2.00 0.8290 0.5162 0.5060 0.9874 0.6804 0.6520 0.9950 0.8750 0.8449
2.2266 0.5 0.25 0.0086 0.0299 0.0305 0.0108 0.0478 0.0482 0.0140 0.0656 0.0654
0.50 0.0246 0.0947 0.0939 0.0425 0.1444 0.1425 0.0676 0.1853 0.1824
1.00 0.1326 0.2454 0.2410 0.2968 0.3376 0.3303 0.4891 0.4708 0.3976
1.50 0.4102 0.3828 0.3740 0.7661 0.4930 0.4816 0.9387 0.5644 0.5459
2.00 0.7610 0.4952 0.4833 0.9818 0.6282 0.6003 0.9995 0.8272 0.7744
1.5688 1.0 0.25 0.0091 0.0282 0.0265 0.0105 0.0459 0.0428 0.0125 0.0624 0.0582
0.50 0.0226 0.0891 0.0838 0.0365 0.1384 0.1317 0.0545 0.1771 0.1696
1.00 0.0158 0.2331 0.2242 0.2432 0.3247 0.3134 0.4133 0.3912 0.3780
2.00 0.6798 0.4766 0.4619 0.9732 0.5961 0.5702 0.9993 0.7608 0.7117
1.2123 1.5 0.25 0.0104 0.0281 0.0246 0.0106 0.0448 0.0391 0.0120 0.0603 0.0528
0.50 0.0229 0.0869 0.0780 0.0339 0.1342 0.1235 0.0469 0.1709 0.1594
1.00 0.0935 0.2271 0.2144 0.2077 0.3153 0.3008 0.3539 0.3785 0.3623
1.50 0.2887 0.3560 0.3404 0.6392 0.4668 0.4498 0.8785 0.5294 0.5125
2.00 0.6237 0.4661 0.4486 0.9588 0.5779 0.5382 0.9987 0.7161 0.6660
0.9987 2.0 0.25 0.0128 0.0295 0.0248 0.0120 0.0443 0.0367 0.0122 0.0587 0.0489
0.50 0.0258 0.0879 0.0763 0.0330 0.1316 0.1176 0.0430 0.1663 0.1516
1.00 0.0929 0.2274 0.2113 0.1852 0.3092 0.2918 0.3107 0.3690 0.3503
1.50 0.2749 0.3551 0.3368 0.5922 0.4586 0.4390 0.8414 0.5201 0.5021
2.00 0.6010 0.4640 0.4443 0.9442 0.5669 0.5434 0.9974 0.6850 0.6372
0.8598 2.5 0.25 0.0156 0.0308 0.0253 0.0136 0.0448 0.0359 0.0129 0.0580 0.0464
0.50 0.0290 0.0889 0.0752 0.0343 0.1310 0.1144 0.0415 0.1636 0.1462
1.00 0.0946 0.2280 0.2091 0.1755 0.3068 0.2872 0.2827 0.3627 0.3422
1.50 0.2694 0.3546 0.3343 0.5642 0.4544 0.4332 0.8101 0.5136 0.4942
2.00 0.5840 0.4619 0.4407 0.9267 0.5635 0.5389 0.9948 0.6672 0.6209
0.7637 3.0 0.25 0.0173 0.0309 0.0250 0.0152 0.0450 0.0351 0.0139 0.0575 0.0446
0.50 0.0305 0.0877 0.0723 0.0354 0.1303 0.1116 0.0411 0.1616 0.1421
1.00 0.0927 0.2550 0.2037 0.1679 0.3045 0.2831 0.2630 0.3580 0.3360
1.50 0.2567 0.3492 0.3273 0.5385 0.4502 0.4275 0.7800 0.5087 0.4876
88
7. CONCLUSIONS
In many situations, the normality assumption is usually violated. For example, the distributions of measurements from chemical and semiconductor processes are often skewed. However, if the normality assumption is violated it leads to erroneous conclusion. Hence, we are able to analyze three control charts for skewed distributions namely, WSDX , EWMA and WSD-CUSUM charts using (WSD) method. In this comparisons analysis, the WSDX chart was found to have the lowest false alarm rates for various level of skewness and sample sizes, when parameters are known and unknown. In term of the mean shift detection rates, when parameters are known and unknown, the WSD-CUSUM provides the higher mean shift detection rate among all charts that considered various levels of skewness and sample sizes. In conclusion, this study would help practitioners in deciding which type of chart to be used in process of monitoring as part of quality control procedures.
REFERENCES
[1] Bai, D. S. and Choi, I. S., “X and R control charts for skewed populations”, Journal of Quality Technology, 27, 1995, pp 120 – 131.
[2] Chang, Y. S. and Bai, D. S., “Control charts for positively-skewed populations with weighted standard deviations”, Quality and Reliability Engineering International, 17, 2001, pp 397 – 406.
[3] Lucas, J.M. and Saccucci, M. S., “Exponentially weighted moving average control schemes: properties and enhancements”, Technometrics, 32, 1990, pp 1 – 12.
[4] Montgomery, D.C., “Introduction to Statistical Quality Control”, (5th edition). John Wiley & Sons, Inc., New
York, 2005.
[5] Ryan, T. P., “Statistical Methods for Quality Improvement”, ( edition). John Wiley & Sons, Inc., New York, 2000.