Published online October 16, 2014 (http://www.sciencepublishinggroup.com/j/ijmea) doi: 10.11648/j.ijmea.s.2015030101.17
ISSN: 2330-023X (Print); ISSN: 2330-0248 (Online)
Air permeability, drying, blowing
Karel Adamek
1, Jaroslav Fabera
1, Milan Stejskal
1, Antonín Havelka
2, Stanislav Franc
31VUTS – Centre of Machinery Research, Liberec, Czech Rep
2TUL – Technical University in Liberec, Faculty of Textiles, Liberec, Czech Rep 3VEBA – textilní zavody, Broumov, Czech Rep
Email address:
[email protected] (K. Adamek), [email protected] (J. Fabera), [email protected] (M. Stejskal), [email protected] (A. Havelka), [email protected] (S. Franc)
To cite this article:
Karel Adamek, Jaroslav Fabera, Milan Stejskal, Antonín Havelka, Stanislav Franc. Air Permeability, Drying, Blowing. International Journal
of Mechanical Engineering and Applications. Special Issue: Moving Forward to Monitory Democracy: Citizens Engagement in Scrutinizing
Election Process in Indonesian 2014 General Election. Vol. 3, No. 1-1, 2015, pp. 40-46. doi: 10.11648/j.ijmea.s.2015030101.17
Abstract: The paper summarizes some experience with air permeability modeling in the area of air filtering, clothes design,
yarns dyeing, etc. Next part deals with surfaces blowing and drying, used in various branches of industry. The received results describe actual situation and give the direction of next progress in both research and plant operation.Keywords: Numerical Flow Simulation, Air Permeability, Filter Resistance, Cloth Permeability, Fabric Drying
1. Introduction
In many areas of technology, various problems of permeability are solved. Here, there are presented some examples of air filtering, design of clothes, etc.
In general, air permeability is defined by material resistance against air flow. The general dependence is defined in [1] as quadratic function of the pressure resistance ∆p (Pa) on the flow velocity w (m/s)
∆p = A . w2 + B . w (1)
with two permeability coefficients A, B. The formula is given by the basic knowledge of fluid mechanics. For flow penetration through any porous media (ground water flow, flow through filtering layer, etc.), there is typical the linear dependence, for flow through orifices, channels, etc. It is typical the quadratic dependence. Real materials contain both such components in any ratio, verified on many solved cases [2], [3], [4], [5], [6], etc. The formulation of permeability in [7] is analogous as any power function
∆p = C . wx
where the exponent value was evaluated in the range from 1 to 2, therefore, in good coincidence with the previous method.
For geometrically defined shapes, it is possible the dependence between flow and resistance to simulate numerically, for complicated and random shapes it is
necessary to use measurement.
2. Examples of Realizations
2.1. Idealized Fabric
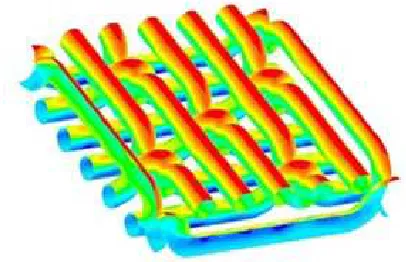
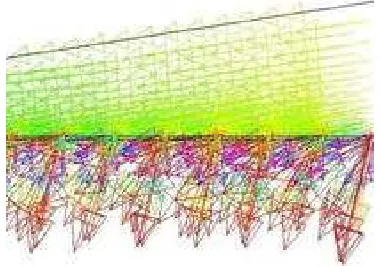
An example of simulated permeability is presented in Fig. 2.1-1 as the weaving structure of satin, with presentation of pressure field on the surfaces of individual idealized yarns.
Figure 2.1-1. Pressure distribution on the idealized satin structure.
adjacent yarns.
Figure 2.1-2. Velocity field at the plane of binding points.
Figure 2.1-3. Velocity field in a cross section of cloth.
Figure 2.1-4. Pressure field in cross section of one idealized yarn.
The basic knowledge, received by such numerical simulation, is interesting as the first step of the solution, but due to an idealization of individual yarns, there is not significant coincidence with reality. Real yarns are composed from many elementary fibers, they have a hairy surface and
due to beat-up forces they are markedly deformed in the manufactured cloth. Fig. 2.1-4 presents the idealized pressure field in one idealized yarn made from many elementary fibers during the cross-flow of air.
2.2. Wind Tunnel [8], [9], [10], [11]
For an experimental study of permeability for various combinations of clothing layers, the so-called wind tunnel is used. On the wire structure (as imitation of arm), the appropriate layers are pulled on and under the effect of outer air flow (simulating the wind effect), there is measured the temperature field inside. Such procedure is very time consuming and contains many errors. The temperature must be measured and statistically evaluated in many points of the inner volume and more, the temperature of recirculating air is changing in time, etc. Therefore, the method of numerical simulation was designed and verified.
Figure 2.2-1. Streamlines around a cylinder
In Fig. 2.2-1, we can see the streamlines around the flowed cylinder, in Fig. 2.2-2, there is the well-known ground-plane of such a velocity field.
Figure 2.2-2. Velocity field around cylinder – ground plane.
Next cross sections of the monitored permeable area represent the air permeability through a permeable layer – the permeability parameters were evaluated by real measuring.
In Fig. 2.2-3, there is the pressure field of the above mentioned flow around permeable cylinder.
The stagnation point is situated on the left side at the symmetry axis, where the velocity is minimum. The minimum pressure is situated on sides, where the velocity is maximum. Between those extremes, there arise some pressure gradients, in the relation with the permeability of the just used layer. Consequently, the temperature field is changing, too, after Fig. 2.2-4.
Figure 2.2-4. Temperature field in a permeable layer.
Initially, the surroundings are cold and the inner volume is heated at some constant temperature. Due to an impact of outer wind (from the left side) and specific layer permeability on the cylinder surface, the cold surroundings are infiltrating inside in the area of stagnation point and on the contrary, on the cylinder sides, the warmer inner atmosphere is pressed out and in the wake after the cylinder, there arises the area of warmer air. The method of numerical flow simulation simply enables to study an influence of several permeable textile layers and theirs combinations on co-called thermal comfort inside the clothing.
2.3. Hardness of the Yarn Winding on a Bobbin
The dying of yarn layer, wound on a bobbin, is not fully uniform, people say that due to the different hardness of individual wound bobbins. The used measuring methods of winding hardness need many time and are not reproducible enough. For instance, the methods based on measuring the absorbed kinetic energy of mass impinging on the wound surface or measuring the force resistance against the needle movement in a wound layer.
Therefore, the method of permeability measuring was proposed and designed because the permeability is surely proportional to the hardness / stiffness of the winding. The realized equipment [12] demonstrates well the measuring of different permeability of individual standard winding stiffness. It is enough to measure the air flow through wound material at defined pressure gradient.
Figure 2.3-1. Winding permeability - evaluation of permeability parameters from experimental data.
Using the same procedure, it is possible to define the dependence of the winding permeability for air flow on the used pressure gradient. From the measured function of the flow resistance (Pa) on the flow velocity (m/s) from the graph in Fig. 2.3-1, two permeability parameters were evaluated for the next numerical simulation. See also the formula (1) above.
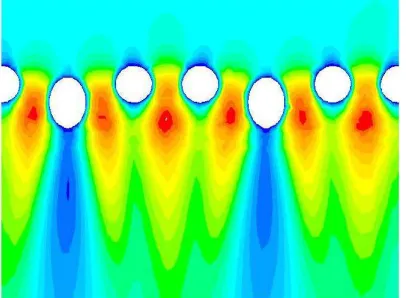
Figure 2.3-2. Pressure field – flow from the axis to the periphery
For the numerical simulation, the thick volume of the winding was divided in many elementary volumes of partial permeability, the resulting flow field is presented in Fig. 2.3-2 to Fig. 2.3-4 as the pressure, velocity and directional fields. The velocity scale is suppressed to express well the area of small velocity values in the volume of the winding. The presented field in an axis-symmetrical model is valid for the flow from the axis to the periphery, for the inverse flow direction, the pressure gradient is inverse, too, the velocity field and directional field are analogous.
It is evident that on the small radius of the winding face it is the “short-circuit” flow, thus this area will be really colored in shorter time. If the dying time will be shortened, the dying of the outer corners area with small velocities will be not well colored. It is possible to expect that the winding will not be colored uniformly. During the dying procedure, several bobbins were placed at each other, therefore, the described effect of short-circuit flow could be suppressed partially. It could be suppressed more by inserting rigid partitions between bobbins so that the short streamlines are suppressed and it is possible to expect more uniform dying of the bobbin volume.
Figure 2.3-3. Velocity field - short-circuit over the small radius of the face (suppressed scale)
3. Drying, Surface Blowing
3.1. Drying of Printed Foil
The principle is presented in Fig. 3.1-1. The plastic foil with a just printed wet surface is traversing along the cylindrical surface.
Figure 3.1-1. Velocity vectors in the drying chamber – former design
The upper side of the foil is blown by warm air from the slotted nozzle, to dry just printed colors. The air flow, saturated by vapors from printing colors, is exhausted by side channels up. Along both sides, there are situated simple labyrinths connected with exhaust, too, to prevent the escape of the saturated air into surroundings. In the modeled geometry, there are visible large vortex areas, where some part of saturated air is flowing back into the drying area, thus the drying intensity is decreasing. The noise level during the operation is too high, too. Therefore, another design is proposed after Fig. 3.1-2, where the drying flow is divided into two parts.
Figure 3.1-2. Velocity vectors in the drying chamber – a new design
Such a new solution contains several advantages:
Due to the outlet divided in two parts, the level of aerodynamic noise is decreasing
Higher number of drying zones increases the drying intensity, too, so that smaller air volume is enough for the drying and so it is possible to expect that the noise level is decreasing, too
Using several simple shape changes, the areas of large vortexes are none so that the drying intensity is further increasing, because the saturated air cannot flow back in the drying area
At higher drying intensity, the air consumption can be decreased and thus the level of aerodynamic noise is decreasing, too
Finally, the construction height of the equipment is decreasing.
The illustration in Fig. 3.1-3 presents profiles of the impact component of velocity vector, upright to the dried surface, which has the main influence on the drying intensity. The
slight asymmetry of the profile is given by relative large mesh elements. Such velocity profiles, received by numerical flow simulation, are in good coincidence with the profiles of mass
transfer coefficients, received by experiments with
naphthalene block blown by impact air flows.
Figure 3.1-3. Profiles of impact velocity component (blue = former, new = red).
3.2. Impact Drying [13], [14]
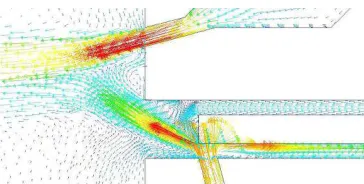
As an example, there is presented the flow field in the equipment for the drying of flat materials (textiles, paper), characteristic by intensive mass transfer and using so-called impact (upright) flows. The whole equipment is very large and complicated, therefore, some partial models were solved step by step.
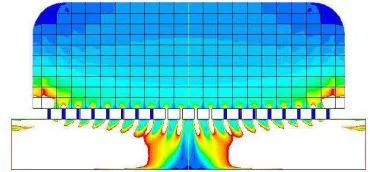
Fig. 3.2-1 presents the velocity field in lengthwise cross section of the inlet part, situated after air heater and blower (here down from left).
Figure 3.2-1. Velocity field in the inlet manifold
problem could be solved by adaptations of monitored manifold in such a way to get the same flow in both lower and upper chamber together with uniform velocity distribution across each inlet. For instance, using convergent outer sides of channels, shifting the position of the dividing point in the vertical channel, etc. It is necessary to correct visible flow deformations as for instance the flow adhesion to the inner bend of the channel or the flow separation from the outer walls of bend, etc.
Figure 3.2-2. Inequality of individual jet flows from supply channel
Fig. 3.2-2 presents the detail of the previous case – one jet chamber characterized by side inlet (from right) and by many jet outlets along the lower side (down). At the inlet, there is supposed the uniform velocity. To ensure the uniform drying effect of the whole width of material, situated under the outlets, it is necessary to keep the same velocity from each of outlets. The best image about the flow from individual jet gives the presented vector field. They are visible quite uniform values of velocity, but all are inclined from the desired theoretical vertical direction.
Figure 3.2-3. Outflow from perforated metal plate (left), outlet modification (right)
The next Fig. 3.2-3 presents more detailed part of the previous case – the flow field in one jet outlet in a common jet chamber. The result of the side air inlet to the jet together with relative large jet outlet in thin wall is the inclined outflow, not upright to the dried surface- therefore, its impact effect is not the maximum possible (see the left detail). It is possible to model a more suitable jet shape, which provides the upright flow direction toward the dried surface. Of course, the usable manufacturing method is important, too (see the right detail).
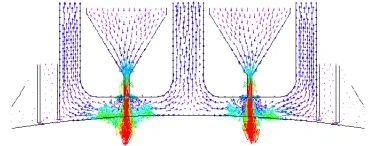
The interaction of the flow field from the drying jet with the relevant dried surface is shown in Fig. 3.2-4. The vertical
impact flow from the jet is bending and dividing into two horizontal flows with the expressive stagnation area in the middle. The velocity field in the vicinity of the dried surface has high influence on the coefficient of mass transfer and on the drying intensity, too.
Figure 3.2-4. Velocity field of impact flow from jet (up) to the dried surface (down)
Experiments confirm an acceptable consent of the flow field intensity after the numerical modeling with measured drying intensity. Total images of the flow field are different after the defined boundary layer on the upper side of the model (outlet or rigid wall). The presented case does not solve the mutual interactions of neighboring jets.
Figure 3.2-5. Streamlines in the area of drying – former design
The next Fig. 3.2-5 presents streamlines in the inlet after Fig. 3.2-2 and outgoing from jets modified after Fig. 3.2-3 (right). Using a very large dried surface, the streamlines from the inner part of the model, saturated by humidity, can hardly get the outer boundary condition (outlet) from the area between the inlet and dried surface. Thu, the drying intensity is decreasing and the drying output, too. Therefore, it is suitable to add the next system of exhaust outlets to the system of inlet jets.
Figure 3.2-6. Streamlines in the area of drying – added exhaust openings
A relevant image of streamlines is in Fig. 3.2-6 – streamlines of individual impact flows are reflecting from the dried surface and are going out as the shortest way up.
In Fig. 3.2-7, there is visible the ground plan of such a design: in the middle among 8 impact peripheral flows, situated at the common circle, there is added one common exhaust opening.
material, as fabrics, knit work, etc. [14], as presented in the previous paragraph. Fig. 3.2-8 presents the relevant temperature and velocity fields around the cooled body of magnetron. Hot air is used for standard impact drying as above.
Figure 3.2-7. Arrangement of impact flows (red) and exhausts – ground plan
Figure 3.2-8. Magnetron - temperature (left) and velocity field
3.3. Blowing of Wet Surfaces
The effect of impact flows is applied in several technical applications; some of them are presented below. For instance, big plastic parts are washed before painting; the sticking water should be blowing out before the final drying by hot air [15], but the result of such a procedure is not sufficient. Important steps of the solution are presented in Fig. 3.3-1.
Figure 3.3-1. Vector fields from left: actual concept – experiment - proposal of adjustment.
The left vector field in Fig. 3.3-1 shows that blowing nozzles, situated from the outer side, have practically not any influence on the inner surfaces of parts, where the flow velocity is practically zero.
The middle scheme shows the vector field of an alternative case, modeling the real testing situation, where a suitable result was reached. Due to the nozzle approaching to the inner side of monitored part, there arises significant flowing, during the real test, the sticking water was successfully removed. But removing the second (left) part, the production of the line is of 50%, only.
It is clear that for the intensification of water removal by air flows it should be to install additional nozzles on the inside side of parts, for instance after the right scheme. And more, the numerical simulation enables to state the optimum nozzle positions for each specific part.
Similar situation arises at blowing-out of stuck water drops on the wet surface of a plate. Fig. 3.3-2 presents the situation, when the plate is at any (left) operating position. It is visible that the upper nozzle has not any effect on the plate – its direction is wrong.
Figure 3.3-2. Blowing of the plate
In Fig. 3.3-3, it is the critical situation when the lower nozzle is affecting just on the edge of the plate. Thus, some water drops are blown-over from the lower side onto the upper one and it is not possible to remove them yet.
Figure 3.3-3. Blowing-over of water drops from lower side of the plate on the upper one
Using a better layout of lower and upper slotted nozzles, it is possible to reach the more efficient water removing from both surfaces. The numerical simulation allows seeking and checking such a suitable design in advance, without wide experiments.
3.4. Blowing of Contaminated Surface
The measured weft yarn length, periodically removed by the main weaving nozzle from the premeasured weft store, is monitored by an optoelectric device, counting the number of removed weft coils from the feeder drum. In a very dusty area of a weaving mill, the active surfaces of the optoelectric sensor are quickly contaminated by textile dust and the loom will stop automatically because the exact measuring of the weft length is not possible when the device does not „see“ the removed weft coils from the drum.
sides it is not possible to situate any air supply because in this area there are moving the removed and counted coils of the measured weft length.
Using the numerical flow simulation, the problem was simply solved. The air inlet is covered, one part of the air is coming from the side of the cover along the wall, where both emitter and receiver are situated, and the second part is rising from another opening in the cover. The position, dimension
and direction of such an opening were defined
"experimentally" by numerical simulation – the flow must be directed just in the area of reflecting surface on the opposite side.
Figure 3.4-1. Blowing of optoelectric device
References
[1] Software Fluent
[2] K. Adamek, "Warming chamber for production of insulating panels", report VUTS Liberec, 2006 (in Czech).
[3] K. Adamek, "Polycondensating chamber for production of insulating mats", report VUTS Liberec, 2007 (in Czech).
[4] K. Adamek, "Fabric air permeability modeling", 13th Int. Conf. STRUTEX (Structure and Structural Mechanics of Textiles), TU Liberec, 2006. ISBN 80-7372-135-x.
[5] K. Adamek, "Permeability of textile layers", XVIth Int. conf. Applic. of exp. and numer. meth. in fluid mech.. ZU Zilina, 2008. ISBN 978-80-8070-826-9 (in Czech).
[6] K. Adamek, "Luftdurchlaessigkeit der Textilien", Chemnitzer Textitechniktagung, 2008.
[7] M. Havrdova, "Permeability evaluation of clothing materials", PhD thesis, FT TU Liberec, 2004 (in Czech).
[8] L. Sindelkova, "Relation between cloth permeability and binding", diploma thesis, FT TU Liberec, 2007 (in Czech).
[9] R. Subert, "Textiles permeability at higher flow velocities", PhD thesis, FT TU Liberec, 2006 (in Czech).
[10] A. Halasova, "Evaluation of permeability of textile sandwiches under conditions of high air velocity speeds", PhD thesis, FT TU Liberec, 2007 (in Czech).
[11] K. Adamek, "Device for permeability measuring of wound bobbin", Czech utility design, 2014.
[12] J. Fabera, M. Stejskal, K. Adamek, "Application of thermovision to evaluating heating unevenness of fabric during drying and to comparing drying performances", 13th Conf. Strutex, TU Liberec, 2006. ISBN 80-7372-135-x.
[13] M. Stejskal, M., K. Adamek, J. Fabera, "Study of new principles of impact drying and development of new jet systems of drying machines", report VUTS Liberec, grant No. VCT2 (TS), 2009 (in Czech).