American Journal of Civil Engineering
2013; 1(1): 41-48Published online June 30, 2013 (http://www.sciencepublishinggroup.com/j/ajce) doi: 10.11648/j.ajce.20130101.16
Detection spacing of DSRC-based data collection system
for real-time highway travel time estimation
Sang Cheal Byun
1, 2, Suhyeon Kim
1, 2, *, Min Heon Kim
1, 2, Sang Wook Han
1, 21Advanced Transport Research Division,Goyang-si, South Korea 2Korea institute of Construction Technology, Goyang-si, South Korea
Email address:
sang@kict.re.kr(S. C. Byun), shkim49@kict.re.kr(S. Kim), valam83@kict.re.kr(M. H. Kim), hsu3939@kict.re.kr(S. W. Han)
To cite this article:
SangCheal Byun, Suhyeon Kim, Min Heon Kim, Sang Wook Han. Detection Spacing of DSRC-Based Data Collection System for Real-Time Highway Travel Time Estimation. American Journal of Civil Engineering. Vol. 1, No. 1, 2013, pp. 41-48.
doi: 10.11648/j.ajce.20130101.16
Abstract:
A DSRC (Dedicated Short-Range Communication)-based traffic data collection system has been introduced to enhance the accuracy of real-time traffic information. However, due to the lack of studies for the DSRC system on interrupted flow condition, there is no installation guideline of DSRC RSEs on the national highways in Korea. This study presented an appropriate spacing of DSRC RSEs for the national highways based on the accuracy of traffic information and the required minimum sample size. By analyzing the field data collected on the national highways, the optimal spacing of DSRC RSEs was selected for each type of road. According to the result, the optimal spacing for controlled-access highway was different from that for multi-lane road and urban and suburban arterial. It implies that detection spacing should be determined considering the type of road. These results would be utilized as a guideline for installing DSRC RSEs on the national highways.Keywords:
DSRC, Detection Spacing, Travel Time Estimation, Highways, ITS1. Introduction
DSRC (Dedicated Short-Range Communication) is a wireless communication channel designed for transportation field, and it promotes the advance of ITS (Intelligent Transportation System) service. Using the OBU (on-board unit) and RSE (road-side equipment), it enables vehicle-to-infrastructure (V2I) communication. As it can collect travel time data on a road section directly, a DSRC-based data collection system provides more accurate traffic information than existing vehicle detectors. For this reason, it is introduced as a main component of traffic data collecting system for ATIS (Advanced Traveler Information Service) in Korea. Most of the expressways in Korea have established DSRC-based data collection system using high-pass OBU for electric toll collection system, and the national highways began to introduce it recently.
As mentioned in [1], spacing of vehicle detectors affects the accuracy of traffic information, and spacing of DSRC RSEs is a major component of DSRC system design. Since the DSRC-based traffic data collection system is on the beginning stage for the national highway system, a guideline for installing DSRC RSE has yet to be established. The
DSRC system is designed to directly collect the travel time data of a road section from only the vehicles equipped with specific OBU which makes difficult to apply the outcomes from point detection system. In addition, for existing studies dealt with DSRC [2-4] were carried out on the expressways, their results also could not be adopted to the national highways without any validation due to the differences in road and traffic condition. Therefore, it is necessary to establish a guideline for installing DSRC RSEs considering the road and traffic conditions of the national highways.
42 SangCheal Byun et al.: Detection Spacing of DSRC-Based Data Collection System for Real-Time Highway Travel Time Estimation
guideline for establishing the DSRC system on the national highways in Korea.
2. Literature Review
Previous studies which determined the optimal detection spacing were mostly carried out with point detection system. According to the studies including [5-8], as the density of vehicle detectors grew, the accuracy of travel time estimation tended to be improved, but the rate of improvement got decreased. However, according to [9] which dealt with remote microwave sensor and acoustic sensor, adding a sensor did not necessarily improve the accuracy of travel time, and thus the criteria for detection spacing might be dependent on detection system.
Studies on the DSRC-based traffic data collection system are at the beginning stage, and existing studies were mostly focused on expressways. In [2], the optimal RSE spacing was determined by analyzing a time-space diagram under the assumptions of average travel speeds of peak and non-peak period, rate of speed reduction, and duration of congestion. Based on the result of [2],a follow-up study ([3]) suggested a generalized method to determine the optimal spacing as the distance travelling at congested speed during the aggregation time interval. In [4], a microscopic traffic simulation was carried out to evaluate the travel time estimation error for each spacing alternative, and the results indicated that the detection spacing affected the accuracy of travel time estimation less during non-peak period than peak period.
In previous studies mentioned above, the spacing of detectors for traveler information system was mostly determined based on the accuracy of information. The spacing of DSRC RSEs was also determined by evaluating the error of travel time estimation to enhance the accuracy. For the DSRC system, however, the number of collected data is another essential factor to produce valid traffic information as mentioned in the studies dealt with probe vehicle data including [10-11]. It is because the data collected by the DSRC system is a sample of vehicles equipped with a specific OBU. Sufficient size of sample is required to produce the valid information which represents the population. Therefore, securing the required minimum sample size is as important as enhancing accuracy of information in determining the spacing of DSRC RSEs, especially for highways with low traffic volume.
Existing studies on detection spacing were mostly carried out with vehicle detectors, and thus the results cannot ensure the applicability to DSRC system. In addition, they did not be supported by empirical analyses except a few studies including [9]. Studies determined the optimal spacing of DSRC RSEs on expressways ([2]-[4]) has limitation of validation with field data though they applied parameters based on real traffic condition for the numerical or simulation analysis. Moreover, since they did not consider various road conditions which found in the national
highways, empirical study considering different types of roads and analyzing field data is necessary.
3. Framework of Analysis
3.1. Analysis Criteria
As mentioned in previous section, since accuracy and the required minimum sample size is the most important factors in traveler information, the detection spacing of DSRC RSEs is determined based on two criteria in this study. First, the average number of collected data was compared with the required minimum sample size based on the variability of collected data. And then, among the spacing alternatives satisfying the sample size requirement, the spacing which produces most accurate traffic information is selected as the optimal spacing for each type of road. If there are alternatives which show little difference in accuracy of information, the largest spacing is beneficial due to the cost effectiveness. The measure of accuracy of traffic information and the required minimum sample size for an aggregation time interval are estimated as follows.
3.1.1. Required Minimum Sample Size
The method of calculating the required minimum sample size is adopted from [12] which presented the equation of minimum sample size for travel time estimation using license plate matching technique. As indicated in (1), the minimum sample size is dependent on the coefficient of variation, allowable relative error, and t- or z-statistics which is determined by the desired confidence level. Among these values, allowable relative error and desired confidence level are parameters specified by the analyst. The coefficient of variation, however, depends on the mean and variance of the data, so it varies with detection spacing which makes changes in the component of the aggregation data and its variability. In this study, 95% confidence level and 10% allowable relative error are applied.
n · · (1)
Where:cv = coefficient of variation
e= maximum specified allowable relative error t, z= t-, z-statistics for specified confidence level
3.1.2. Measure of Accuracy
American Journal of Civil Engineering
MAPE is estimated using (2) as below.
size of relative error compared to the actual value, and it can be compared with different spacing alternatives
of their scales. In addition, it is relatively easy to specify an allowable threshold as it represents percentag
MAPE ∑ ⅹ
Where:X = estimates Y = actual value n = number of estimates 3.2. Evaluation Method
To evaluate detection spacing alternatives with respect to the accuracy of traffic information and minimum sample size, it should be defined how to produce the traffic information using DSRC data. In addition, specifying the actual value is necessary for calculating the measure of accuracy. In this section, procedures for evaluating alternatives, including method of travel time estimation and the actual value for evaluating the accuracy are presented.
3.2.1. Method of Travel Time Estimation
The DSRC system collects travel time data on a road section with two RSEs installed at both ends, through recording and matching the time a vehicle
RSEs. The collected data contains outliers resulted communication error, overlapped detection
causes. The outliers might distort the representative tendency of the data. For this reason, traffic information shall be produced after removing outliers
methods based on statistical technique
the data are aggregated by predefined time interval in every updating cycle as indicated in Fig. 1.
Figure 1. Updating cycle and aggregation time interval for travel time estimation
Current traveler information system of
highways in Korea produces traffic information by aggregating data collected for previous 5 minutes in every minute. In other words, it applies 5 minutes aggregation time interval and 1 minute updating
aggregation interval and updating cycle may
American Journal of Civil Engineering 2013; 1(1): 41-48
) as below. It represents the relative error compared to the actual value, and it can alternatives, irrespective In addition, it is relatively easy to specify an allowable threshold as it represents percentage error.
ⅹ100 (2)
evaluate detection spacing alternatives with respect to the accuracy of traffic information and minimum sample size, it should be defined how to produce the traffic In addition, specifying the culating the measure of accuracy. In this section, procedures for evaluating alternatives, including method of travel time estimation and
accuracy are presented.
ation
DSRC system collects travel time data on a road section with two RSEs installed at both ends, through recording and matching the time a vehicle passes at the data contains outliers resulted from overlapped detection, and other might distort the representative For this reason, traffic information shall be produced after removing outliers using filtering statistical techniques in general. Then, time interval in every
time interval for travel time
Current traveler information system of the national in Korea produces traffic information by aggregating data collected for previous 5 minutes in every minute. In other words, it applies 5 minutes aggregation cycle. Though the cycle may affect the
accuracy of the traffic information, this study focuses on determining the detection spac
adopts the current setting.
Contrary to the vehicle detection system which estimate the travel time using collected point speed data,
system generates travel time
individual travel time collected during an aggregation time interval as seen in (3). Travel speed on a road section is calculated by dividing the length of the section by the travel time.
T ∑$%&'# (
Where:)* = travel time of individual vehicle RSEs
N = number of vehicles collected during aggregation time interval
3.2.2. Selection of Actual Val In the DSRC traffic data
data is collected by matching the time start point and the end point
the traffic information of the DSRC system is
aggregating the data based on the arrival time at the end of the section. However, the actual travel time with respect to the users is similar to the travel time a
departure time because the information is provided to users before departing the section. Therefore,
provided by DSRC system is time difference is referred to as time
The time-lag causes error in travel time estimation to a greater or lesser extent. If the travel time of
section is constant over time, the aggregated travel times based on departure time and arrival time would be equal. In general, however, the traffic condition on a section over time, so the two aggregated travel times
In addition, the variability in travel time of individual vehicles, which makes change in composition of aggregated data at every updating cycle
difference.
We refer to the difference as the error due to the time and it can be supported by
From the two travel time curve of travel time due to the time-part of the figure shows the big when the traffic condition changes
It is more reasonable to evaluate the accuracy of traffic information based on the travel time experienced by the user. Thus, the travel time aggregated by the departure time was used as the actual value in
other words, travel time data are created by matching the time vehicles passed the two RSEs, and aggregated travel times based on departure time and arrival time are used as the actual value and estimated value to calculate the error, respectively.
43
accuracy of the traffic information, this study focuses on spacing of DSRC RSEs and
vehicle detection system which estimates the travel time using collected point speed data, the DSRC on a section by averaging the individual travel time collected during an aggregation time Travel speed on a road section is calculated by dividing the length of the section by the travel
#% (3)
travel time of individual vehicle between
= number of vehicles collected during the
Actual Value for Measuring Accuracy collection system, travel time ected by matching the time a vehicle passes the with its OBU ID. In addition, mation of the DSRC system is produced by data based on the arrival time at the end of However, the actual travel time with respect to users is similar to the travel time aggregated by the the information is provided to users ing the section. Therefore, the information is past information, and such time difference is referred to as time-lag.
lag causes error in travel time estimation to a f the travel time of a vehicle on a section is constant over time, the aggregated travel times sed on departure time and arrival time would be equal. In general, however, the traffic condition on a section varies over time, so the two aggregated travel times are different. n addition, the variability in travel time of individual es change in composition of at every updating cycle, contributes the
We refer to the difference as the error due to the time-lag, field data as shown in Fig.2. From the two travel time curves, the time-lag and the error -lag is identified. The enlarged the big difference in travel times
changes rapidly.
44 SangCheal Byun et al
Figure 2. Comparison of travel times aggregated by departure time and arrival time. + Data collected on the section between
Galhyeon-dong T-Jct. (1.9km) of the national highway #3 on Dec. 14 2012.
3.2.3. Evaluation Procedure
Figure 3. Procedure of evaluating alternatives
The procedure of evaluating alternatives of detection spacing is shown in Fig. 3. After collecting data from RSE installed at the start and the end point of
time data is created by matching the time passed at the two points using its OBU ID
the outliers contained in the data, the data collected during previous 5 minutes are aggregated to
time information at every minute. And
et al.: Detection Spacing of DSRC-Based Data Collection System for Real-Time Highway Travel Time Estimation
times aggregated by departure time and section between Galma Tunnel and Jct. (1.9km) of the national highway #3 on Dec. 14th,
alternatives
alternatives of detection After collecting data from RSEs end point of a section, travel times when a vehicle using its OBU ID. After removing the outliers contained in the data, the data collected during to produce the travel nd then, the MAPE is
calculated based on the travel time aggregated by the departure time at every updating cycle and averaged over the study period. The coefficient of v
also calculated at every cycle
size is estimated using average coefficient entire study period. If average
smaller than the minimum sample size, the spacing alternative is rejected. Otherwise, the spacing is compared with other alternatives based on the MAPE.
3.3. Considerations in Analysis
3.3.1. Types of Roads
As interrupted flow and un
the national highways have various road conditions for each section. The national highways in Korea can be categorized into many types of roads based on
conditions such as number of lane
and signalized intersection. Analysis of RSE spacing was carried out for each type of road because
spacing of DSRC RSEs may depend According to the KHCM Manual, [13]), roads are multi-lane highway, urban and rura highway. Freeway is again classified into controlled-access highway. Except are included in the national high
analysis are collected and analyzed for three types of road indicated in Table 1 in accordance with KHCM
excluding two-lane highways volume to install the DSRC system
Table 1.Types of
Types of roads Access control
Controlled-access highway
Fully controlled access Multi-lane
highway
Partially controlled access, Free access Urban and rural
arterial Free access
3.3.2. Analysis Time Period
In the DSRC-based traffic data collection system, data is generated after a vehicle passed a road section, which causes time-lag longer than its travel time
evaluation result may depend on traffic condition which affects the travel time when the detection spacing is equal. Especially, the result for peak period when congestion is growing or decreasing is different
non-peak period, as indicated in Fig. 4. During peak period, since traffic condition changes significantly over time, the error due to the time-lag is enlarged during peak period. Existing studies including [4] which analyzed the spacin of DSRC RSEs on expressway, presented that the travel time estimation error was dependent on congestion.
Based Data Collection System for
travel time aggregated by the departure time at every updating cycle and averaged over The coefficient of variation of the data is calculated at every cycle, and the minimum sample s estimated using average coefficient of variation over . If average number of collected data is minimum sample size, the spacing alternative is rejected. Otherwise, the spacing is compared with other alternatives based on the MAPE.
lysis
uninterrupted flow are mixed, have various road conditions for The national highways in Korea can be categorized into many types of roads based on the road s number of lanes, controlled-accessibility Analysis of RSE spacing was carried out for each type of road because the optimal
depend on the type of road. KHCM (Korea Highway Capacity
categorized into freeway, lane highway, urban and rural arterial and two-lane is again classified into expressway and . Except expressway, all others are included in the national highways. In this study, data for collected and analyzed for three types of roads indicated in Table 1 in accordance with KHCM’s guideline, highways because of too low traffic DSRC system in general.
Types of roads studied
Access control Intersection density
Number of lanes
Fully controlled 0.0 per km
More than 4 lanes/2 ways Partially controlled
access, Free access
≤ 1.0 per km
More than 4 lanes/2 ways
Free access > 1.0 per km
More than 2 lanes/way
American Journal of Civil Engineering 2013; 1(1): 41-48 45
Figure 4. Comparison of time-lag during peak and non-peak period
In terms of the required minimum sample size as well as the accuracy, it is necessary to analyze considering the time period. Since the national highways have less traffic than expressways, it may be difficult to collect sufficient data especially during non-peak period. To provide credible traffic information continuously, minimum sample size should be secured during even non-peak period. In this context, after dividing the collected data into two groups based on the travel speed and its trend, the data are analyzed for peak period and non-peak period independently.
3.3.3. Alternatives of Analysis
Previous studies ([2-3]) suggested the optimal spacing of DSRC RSEs on expressways as 3~6km. As the national highways have lower speed limit than expressways, the optimal detection spacing would be shorter than that of expressways. Therefore, to determine the optimal detection spacing, there is no need to evaluate alternatives longer than 6 km.
In this study, the maximum spacing of DSRC RSEs is determined based on the characteristics of congested traffic condition of national highways. Investigating the traffic condition on several national highways where the DSRC system is in operation, average speed reduction rate was 40 km/hr in an hour, and average vehicle speed during peak period was monitored as 40 km/hr. On the basis of the assumption that the travel speed decrease constantly over time, it is expected that the MAPE of travel time estimation due to the time-lag would exceed 10% when the detection spacing is longer than 4 km.
Taking into account of traffic condition on national highways, spacing alternatives for analysis were specified as 1, 2, 3, and 4km. As shown in Fig 5, four portable DSRC RSEs were installed on each road section for analysis and collected data. By matching various combinations of RSEs, travel time data were generated for analyzing the four alternatives of DSRC RSEs. Due to the lack of available RSEs, the spacing alternative of 3km has different start point from other alternatives.
Figure 5. Locations of DSRC RSEs for each road section
3.4. Data Collection for Analysis
For evaluating the detection spacing alternatives, two to three sections for each type of roads were selected. The sections for data collection are indicated in Table 2. As peak hour was monitored at some sections only, analysis for peak hour was carried out using the data from a single section of each type.
Table 2. Road sections for analysis
Types of Roads Highway
number Highway Section
Average Travel Speed (km/hr) Peak Non-peak
Controlled-access highways
#77
Goyang-si
~Gayang Br. - 86.1
Gayang Br.
~Seongsan Br. 46.4 -
#46 GeumnamIC~Hwado - 80.6
Multi-lane highways
#1 Airport T-Jct.
~Byeongjeom-si 22.9 74.0
#43 Kkonmae Int.
~Neungpyeong Int. - 67.6
#45 Chohyeon T-Jct.
~DoojeonT-Jct. - 77.1
Urban and rural arterials
#38 GoongriJct.
~ShindaeJct. 28.8 53.7
#1 Bijeon Jct.
~Angoon5-ri T-Jct. - 69.6
#43 Beoncheon2 Br.
~EungogaeT-Jct. - 67.2
+ Br. = bridge, IC = interchange, Int. = intersection, Jct.= junction
4. Results and Discussions
As aforementioned, the detection spacing alternatives were evaluated for different congestion level for each road type. Using field data, the optimal spacing is determined by examining the collected sample size exceeding the minimum sample size and by evaluating MAPE for the alternatives. For each type of roads, the alternative which minimizes the MAPE while collecting sufficient data is selected after investigating the results during peak and non-peak period. If the results of peak and non-peak period are different, the spacing would be selected based on the result of peak period.
4.1. Controlled-Access Highways
46 SangCheal Byun et al.: Detection Spacing of DSRC-Based Data Collection System for Real-Time Highway Travel Time Estimation
average sample size for detection spacing alternatives on controlled-access highways. They had the road condition of uninterrupted traffic flow which makes the coefficient of variation low. It resulted in the small minimum sample size as one to three vehicles for an aggregation time interval. On the other hand, controlled-access highways had high traffic volume, and the number of collected data was more than 30 for an aggregation interval. As a result, the minimum sample size would possibly be secured with all of the spacing alternatives.
Table 3. Analysis results of sample size for controlled-access highways
Traffic Conditio
n
Measures 1 km 2 km 3 km 4 km
Peak period
Coefficient of
variation 0.067 0.051 0.048 0.029 Required min.
sample size 2 1 1 1
Average sample
size 52.9 40.3 37.1 37.8
Non-peak period
Coefficient of
variation 0.102 0.096 0.075 0.080 Required min.
sample size 3 3 2 2
Average sample
size 55.6 55.7 39.9 43.8
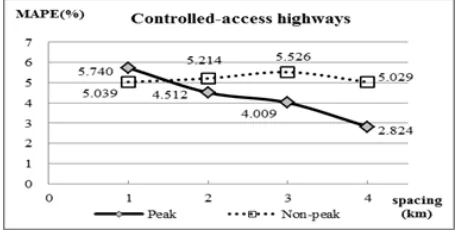
Fig. 2 shows the MAPEs of the spacing alternatives which applied the travel time aggregated based on the departure time as the actual value. The result presented that the DSRC-based data collection system could produce accurate traffic information which have estimation error of 2~6%. It is possible because the controlled-access highways have uninterrupted traffic flow condition and their high vehicle speed reduces the error due to the time-lag.
Figure 6. MAPEs for controlled-access highways
Comparing the accuracy by detection spacing alternatives, no significant difference in MAPEs was found during non-peak period which coincides with the result from [2]. During peak period, however, larger spacing tended to have smaller MAPE, which was different from the result of previous studies. It may be attributable to the characteristics of the MAPE measure and the data of individual vehicles. That is, the longer the travel distance,
the greater the error due to the time-lag, while the difference in travel time among individual vehicles could be offset within the section. The MAPE is calculated as the rate of estimation error relative to the actual value of travel time. Therefore, the MAPE could be reduced as the detection spacing gets longer.
Since all of the alternatives were qualified with the minimum sample size requirement, the optimum spacing was determined based on the accuracy of information. Though all of the spacing alternatives could produce accurate information less than 10% of MAPE, 4 km spacing minimized the MAPE. That alternative is advantageous for installation cost, too. For these reasons, optimum spacing of DSRC RSEs on controlled-access highways was selected as 4km.
4.2. Multi-Lane Highways
As can see in Table 4, all of the spacing alternatives would possibly collect the data more than the minimum sample size in peak period. In non-peak period, however, the minimum sample size could hardly be secured in case of 1 km spacing. It was caused by the high coefficient of variation and corresponding large required minimum sample size. In other words, in case of short detection spacing such as 1 km, large sample size is required due to the high coefficient of variation while less data were collected due to less traffic in non-peak period.
It is expected that the high coefficient of variation is resulted from large difference in travel time among individual drivers. Driving characteristics of individual driver could significantly affect the individual travel time under the free traffic condition. When the average travel time is short due to the short spacing, the variability of individual data would contribute significantly to the coefficient of variation.
Table 4. Analysis results of sample size for multi-lane highways
Traffic Conditio
n
Measures 1 km 2 km 3 km 4 km
Peak period
Coefficient of
variation 0.201 0.088 0.105 0.055 Required min.
sample size 11 3 3 1
Average sample
size 15.2 11.6 13.0 10.0
Non-peak period
Coefficient of
variation 0.169 0.102 0.088 0.066 Required min.
sample size 8 3 3 2
Average sample
size 6.7 5.7 8.1 4.4
American Journal of Civil Engineering 2013; 1(1): 41-48 47
the relative error due to the time-lag tended to smaller than that during peak period because of high vehicle speed. In addition, as the detection spacing gets larger, the MAPE tends to decrease. During peak period, the MAPE of 2 km spacing was the lowest.
Except one alternative of 1 km spacing which could not satisfy the minimum sample size, the relation between MAPE and detection spacing during peak period was different from that during non-peak period. In peak period, the error due to the time-lag was possibly enlarged because of considerable long travel time. Given the need of more accurate information during peak hour than non-peak hour, the optimal spacing of DSRC RSEs on multi-lane highways was determined as 2km based on the result of peak period.
Figure 7. MAPEs for multi-lane highways
4.3. Urban and Rural Arterials
Table 4 presents that all of the detection spacing alternatives can satisfy the minimum sample size during peak period. During non-peak period, however, the minimum sample size would hardly be secured in cases of 1 km and 3km spacing. It may result from the high coefficient of variation and less traffic volume as mentioned before. An explicit relation between detection spacing and coefficient of variation was hardly found due to the complex road condition on urban and rural arterials affected by many factors including traffic signals and adjacent land use.
Table 4. Analysis results of sample size for urban and rural arterials
Traffic Conditio
n
Measures 1 km 2 km 3 km 4 km
Peak period
Coefficient of
variation 0.117 0.052 0.065 0.035 Required min.
sample size 4 1 2 1
Average sample
size 10.9 10.8 3.1 3.9
Non-peak period
Coefficient of
variation 0.137 0.065 0.094 0.056 Required min.
sample size 6 2 3 1
Average sample
size 5.2 4.9 2.5 4.5
Fig 8 shows the MAPEs of detection spacing alternatives on urban and rural arterials. As seen in other types of road,
high variability of individual travel time contributed to the high MAPE for 1km spacing. In addition, the road conditions with dense signalized intersections increased the MAPE. Though the MAPE did not significantly increase as the spacing extended to 4 km during non-peak period, it exceeded 15% for 4 km spacing during peak period. It was caused by the increased time-lag in congested traffic condition.
The optimal detection spacing was determined by comparing the MAPEs of alternatives which satisfied the required minimum sample size. The alternatives minimizing the MAPE for peak and non-peak period were inconsistent. Among 2km and 4km alternatives, 2km was selected for the optimum detection spacing of DSRC RSEs considering the result of peak period.
Figure 8. MAPEs for urban and rural arterials
5. Conclusions
The optimal spacing of DSRC RSEs was estimated for the purpose of providing an installation guideline for the DSRC-based traffic data collection system on the national highways. It was determined based not only on the accuracy of information but also on the minimum sample size requirement for each spacing alternative due to the restricted target of DSRC system. Contrary to the existing studies dealt with expressway, the evaluation was conducted for various types of roads considering road condition of the national highways.
As a result, 4km was found to be the optimal spacing for controlled-access highways which has uninterrupted traffic flow, and 2km was selected for multi-lane highways and urban and rural arterials. The MAPE was not decreased as the detection spacing decreased which was inconsistent with previous studies on expressways ([2]-[4]). This result can be interpreted that traffic information on a short section would not sufficiently accommodate the variability of individual travel time due to the interrupted traffic condition. In addition, the evaluation result from an analytical or simulation method could not correspond to field data and it requires an appropriate validation process.
48 SangCheal Byun et al.: Detection Spacing of DSRC-Based Data Collection System for Real-Time Highway Travel Time Estimation
DSRC RSEs can be determined considering the optimal RSE spacing for the type of road and other conditions such as locations of intersections, traffic conditions, and so on. In addition, the evaluation method for detection spacing in this study can also be applied into consideration of introducing the DSRC system and selecting the location of RSEs.
This study has beneficial distinctiveness as followings. The evaluation results for detection spacing using field data collected from various types of the national highways provides a practical decision. The measures of evaluation such as the required minimum sample size and the accuracy of information can be utilized for determining other design factors of the DSRC-based data collection system. In addition, the resulting minimum sample size could provide a criterion for introducing the DSRC system on a road section which carries less-traffic volume.
As indicated in the evaluation result, the optimum spacing of RSEs is dependent on the road conditions, and the national highway shaves various road conditions. The analysis result of this study was resulted from data collected on 2 to 3 sections for each type of roads. Therefore, additional data collection and analysis for various traffic conditions would enhance the credibility of the result. Moreover, as previously mentioned in [8], there might be the location that would have critical impact on the accuracy of traffic information. From this perspective, the location along with the spacing of DSRC RSEs needs to be evaluated to enhance the Advanced Traveler Information System using the DSRC-based data collection system.
References
[1] W. Feng, A. Y. Bigazzi, S. Kothuri, and R. L. Bertini, “Assessing the impacts of freeway sensor spacing and probe vehicle penetration on travel time prediction and estimation accuracy for traveler information and traffic management”, Proceedings of the 89th Annual Meeting of Transportation Research Board, 2010.
[2] S. Lee (eds.),“Establishment of installation standard for expressway traffic detection system”, Technical report, Report no. EXTRI-2011-07-534, Korea Expressway
Corporation Research Institute, 2010.
[3] N. Kim, S. Lee, S. Oh, and Y. Son, “A study on optimal traffic detection systems by introduction of section detection system,” The J. of the Korea Institute of Intelligent Transport Systems, vol. 10, no.3, pp. 47–63, June2011. [4] J. Park, “Methodology for determining RSE spacing for
Vehicle-Infrastructure Integration (VII) based traffic information system”, Dis. of Hanyang Univ., 2010.
[5] J. Kwon, B. McCullough, k. Petty, and P. Varaiya, “Evaluation of PeMS to improve the congestion monitoring program”, California PATH Research Report, UCB-ITS-PRR-2007-6, 2006.
[6] X. L. Ban, Y. Li, A. Skabardonis, and J. D. Margulici, “Performance evaluation of travel-time estimation methods for real-time traffic applications”, J. of Intelligent Transportation Systems: Technology, Planning, and Operations, vol. 14, no. 2, pp.54-67, 2010.
[7] B. Bartin, K. Ozbay, and C. Lyigun, “Clustering-based methodology for determining optimal roadway configuration of detectors for travel time estimation”, Transportation Research Record, vol. 2000, pp. 98-105, 2007.
[8] P. Chaduri, .T. Martin, A.Z. Stevanovic, and C. Zhu, "The Effects of detector spacing on travel time prediction on freeways", International Journal of Engineering and Applied Sciences, vol.7, no.1, pp.1-10, 2011.
[9] K. Ozbay, B. Bartin, and S. Chien, "South Jersey real-time motorist information system: technology and practice," Transportation Research Record, vol.1886, pp.68-75, 2004. [10] K. K. Srinivasan, and P. P. Jovanis, “Determination of
number of probe vehicles required for reliable travel time measurement in urban network”, Transportation Research Record, vol. 1537, pp.15-22, 1996.
[11] M. Chen, and S. I. J. Chien, “Determining the number of probe vehicles for freeway travel time estimation by microscopic simulation”, Transportation Research Record, vol. 1719, pp.61-68, 2000.
[12] S. M. Turner (eds.), Travel Time Data Collection Handbook,FHWA,1998, p. 4-6.