Published online January 10, 2013 (http://www.sciencepublishinggroup.com/j/ajmp) doi: 10.11648/j.ajmp.20130201.13
A method for analyzing physical processes at the vortex
front in high-temperature superconductors
Khalil Rostami
Kotel’nikov Institute of Radio Engineering and Electronics, Russian Academy of Sciences, 1 Vvedenskii sq., Fryazino, Moscow region, Russia
E-mail address:
[email protected] (K. Rostami)
To cite this article:
Khalil Rostami. A Method for Analyzing Physical Processes at the Vortex Front in High-Temperature Superconductors. American Journal of Modern Physics. Vol. 2, No. 1, 2013, pp. 21-33. doi: 10.11648/j.ajmp.20130201.13
Abstract:
A method of simultaneous analysis of the magnetic and crystalline microstates of superconductors is proposed to find out the specific features of interaction between the crystalline and magnetic microstructures of polycrystalline HTSCs. Qualitatively new results are obtained for samples with different microstructures. For example, regular steps are observed on the magnetic-field dependence of the trapped magnetic flux density Btr(H0) in polycrystalline and epitaxial YBCO films for both increasing and decreasing field. The results of the analysis imply that epitaxial films, as well as bulk and film polycrystalline HTSCs, are "decomposed" into monodomains, crystallites, and subcrystallites with different demagnetization factors. The simultaneous penetration of vortices into crystallites of about the same size and into more regularly arranged subcrystallites gives rise to the above-mentioned steps. As the quality of the samples increases, these steps become more prominent, which is attributed to the enhanced short-range ordering. The absence of steps on Btr(H0) in bulk polycrystalline samples clearly demonstrates the absence of long-range ordering in these samples. It is the vitreousness of the crystalline microstructure of HTSCs that is responsible for the transformations in the vortex system. The similarity of the results obtained in samples with different microstructures points to the universal mechanism of penetration, distribution, and trapping of magnetic flux in these samples. It is found that polycrystalline HTSCs are in fact multistep, rather than two-step, systems. It is shown that the vitreousness of the microstructure of HTSCs and the dense arrangement of twinning boundaries lead to the penetration of magnetic flux in the form of hypervortices into samples and are responsible for the formation of a superconducting glass state on physical principles different from those of the Ebner--Strode model of granulated glass.Keywords:
Vortex Front, Josephson Medium, Demagnetization Factor, Thermodynamic Field, Crystallites and Subcrystallites1. Introduction
The problem of determining the interaction mechanism between the crystalline and magnetic microstructures of high-temperature superconductors (HTSCs) is one of the key problems of HTSC physics that has attracted worldwide interest. This problem marks one of milestones in the development of superconductors with the critical current density Jc close to the critical Ginzburg−Landau depairing current density −Jc
GL 1−6)
and is a challenging problem from both fundamental and applied points of view. From the technological viewpoint, it is much simpler and cheaper to synthesize polycrystalline HTSC samples of required shape and size. However, Jc in HTSC polycrystals is well below that in HTSC single crystals and epitaxial
structure. This structural division was associated with the presence of twinning boundaries in the crystallites of polycrystalline HTSCs. Since the distance between twinning boundaries in the crystallites of polycrystalline YBa2Cu3O7−x (YBCO) is about 50 Å17), it is rather difficult to detect subcrystallites by means of current and magnetic measurements. To measure the characteristics of monodomains (large crystallites), crystallites, and subcrystallites, the authors of18−20) carried out a detailed analysis of the problems of demagnetization and thermodynamic fields and established a close relationship between these problems. The complex solution of these problems would open a direct access to the experimental measurement of the thermodynamic magnetic field profile, which is crucially important for the description of the physical properties of spatially inhomogeneous type II semiconductors. The measurement of the magnetic-field dependence of the effective demagnetization factor neff(H0) of a sample and of the thermodynamic magnetic field
Hi(H0) made it possible to trace the motion of the interface between regions occupied by vortices and the Meissner regions, which are free of vortices. When vortices penetrate into a sample or into a large number of crystallites and subcrystallites with close demagnetization factors, the function neff(H0) undergoes appreciable changes. In this way one could determine the values of Jc and the first thermodynamic critical magnetic fields HicI = Hi = H0/(I −
neff) for chosen monodomains, crystallites, and subcrystallites.
In spite of a large number of works on the penetration (exit), distribution, and trapping of a magnetic flux in HTSC films and single-crystal and polycrystalline HTSC samples, a systematic comparative analysis of experimental data on the magnetic flux trapping, obtained by the same technique, has not been carried out for samples with different microstructures.21,22) This analysis would provide useful information on the magnetic (local critical parameters of monodomains, crystallites, and subcrystallites, as well as interdomain, intercrystallite, and intersubrystallite weak links; the energy of interdomain, intercrystallite, and intersubcrystallite Josephson junctions; the condensation energy in monodomains, crystallites and subcrystallites; the pinning forces in them; etc.) and crystallographic (linear dimensions of monodomains, crystallites, and subcrystallites; the anisotropy and the density of twinning boundaries; enhancement of the short-range ordering as the size of monodomains, crystallites, and subcrystallites decreases; and the morphology of different-scale defects, localized dislocations, plastic deformations, and other possible defects of microstructure) microscopic states of superconductors. The answer to these questions will allow one to establish a detailed relationship between the crystallographic and magnetic microstructures of HTSCs and stimulate the development of many prospective technologies based on HTSCs. Therefore, the development of a method for the local diagnostics of HTSCs that makes it possible to capture a magnetic flux
both in homogeneous and local magnetic fields and to smoothly vary the spatial scale of the applied field seems to be a quite topical problem. This method allows one to selectively analyze the distribution of local fields around a sample, monodomains, crystallites, and subcrystallites. Thus, one can obtain useful information not only on the magnetic flux penetration (exit) and the formation and transformation of a vortex lattice but also on the crystallographic microstructure of samples and reveal some features of interaction between the magnetic and crystalline microstructures of a sample. Conventional methods for investigating magnetic properties (see, for example,23−26) and references therein) allow one to observe only the integral characteristics of superconductors, because the external field, after being switched off or reduced, smoothly exits from a sample and is partially trapped by the sample. This fact prevents one from obtaining information on both the magnetic and crystallographic microstructures of a sample. It is known that a simultaneous analysis of the magnetic and crystallographic microstructures of samples can be carried out by the neutron diffraction technique. However, in spite of the fact that the field distribution is detected locally, this technique is also an integral technique, because the magnetic structure of a sample is analyzed either in a magnetic field or when the magnetic field is slowly switched off27).
The aim of the present study is to determine the penetration mechanism of a magnetic flux into an HTSC, to find out the specific features of interaction between the crystalline and magnetic microstructures of an HTSC, and to develop a method for simultaneous analysis of the magnetic and crystalline microscopic states of superconductors.
2. Samples and Experimental Method
2.1. Experimental Method
To detect the trapping of a magnetic flux only due to the front of the magnetic field, we connected a capacitance of
C = 0.05 µF in parallel with a solenoid (with inductance of
L ≈ 7.6 H and resistance R ≈ 85.9 Ω) that produces an external field. The application of a dc voltage pulse to this LC circuit gives rise to a decaying ac magnetic field H(t) =
H0exp(−βt)cosΩt in the solenoid. In this expression, β =
R/2L is the attenuation factor, Ω = (ω2−β2)1/2 ≈ 1.6 kHz is a modified frequency of the oscillatory circuit, and ω2=1/LC.
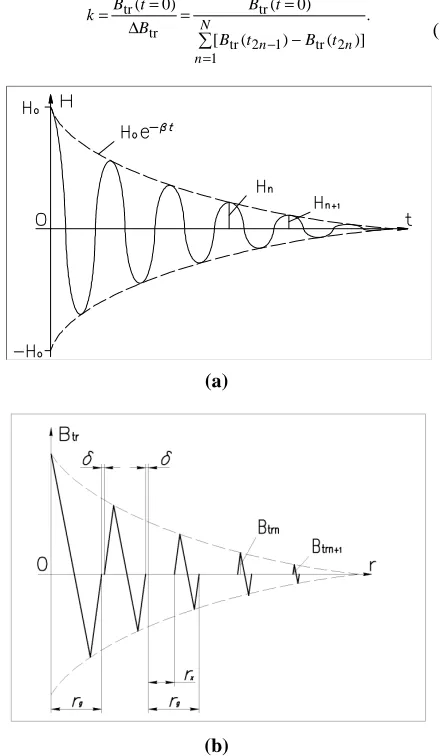
Since the oscillation amplitude H0exp(−βt) falls off exponentially from H0 to zero, the trapping of the magnetic flux occurs due to the field H0 rather than due to the ac field28). Figure 1a shows the time dependence of the field
H(t) for arbitrary parameters of the LC circuit. By varying
resistor is connected in parallel with the solenoid. The analysis of the magnetic-field dependence of the trapped magnetic flux Btr(H0) of a superconducting sample by the method proposed was carried out in the ZFCMFA (zero field cooling with magnetic field accumulation) regime18−20). According to the ZFCMFA regime, a sample is cooled to the liquid nitrogen temperature in zero magnetic field. Then a steplike impulse of external magnetic field is applied, and, in five minutes after switching off the field, we measured Btr at the center of a sample on its surface. Next, without heating the sample, we applied another impulse of H0 and measured the total Btr, and so on. The amplitude of the steps was monotonically increased by equal amounts and, upon reaching the necessary value, monotonically decreased in the same manner. To pass smoothly from large to small spatial scales, after each cycle of measurements, we gradually reduced the amplitude of the step to the minimum value; moreover, after each cycle a sample was heated to temperature above
Tc and was again cooled down to T = 77.4 K. This technique allowed us to move step-by-step the magnetic field front into the bulk of the sample, monodomains, crystallites, and subcrystallites, and back and follow up the motion of the interface between the regions occupied vortices and Meissner regions. Since the experimental conditions allowed us to eliminate the effect of the trailing edge of the magnetic pulse, the probing of the bulk of a sample by the front of a decaying ac magnetic field has allowed us to separately investigate the magnetic state of regions with identical critical parameters, to make a local capture of the flux, and change the topology of the trapped magnetic flux by the front of the field. As the external field increases, the interface between the vortex and Meissner regions starts to enclose domains with the maximum values of the critical parameters (HcIi, Jci, and Tci). Thus, by cycling the field, we can achieve mutual transitions between the Gaussian and δ(H0)-like distributions of the trapped magnetic flux. This allows us to obtain useful information on the magnetic properties of samples as a function of the crystallographic microstructure of spatially inhomogeneous superconductors such as HTSCs.
The function Btr(H0) was measured in magnetic fields of up to 1.3 kOe at liquid nitrogen temperature by a Hall probe with the working area of 50 × 50 µm2 and sensitivity of about 200 µΩ ⋅ mT−1. The equipment allowed us to detect a Hall probe signal with an accuracy of 2.5⋅10−3 G and move a sample relative to the Hall probe along the radius and along the axis of the cylinder. First, a sample was moved relative to the Hall probe with large steps along both the radius r in the axis z to a specific region of interest, and then this region was examined with a step of 10 µm29). Due to the electric contacts on the Hall probe, the minimum spacing between the working area of the Hall probe and a sample was about 200 µm. To determine the exact value of the maximum density of the trapped magnetic flux Btrmax(0) at the center of a sample on its surface, we constructed normalized axial distributions
Btr(z)/Btrmax(0) along the axis z. The extrapolation of these curves to the ordinate displaced by −200 µm from the z axis has shown that a signal loss at a distance of 200 µm from the sample surface is at most 5% of Btrmax(0) 22). The magnetic field was directed perpendicular to the plane of a sample.
Figure 1b provides a schematic illustration of the radial distribution of the sample response Btr to the field H(t). This distribution allows one to determine the remanent field ∆Btr due to incomplete compensation of the signal from positive and negative half-periods of the field H(t). We considered a case when the field H(t) leads to the implementation of the Bean model30) in crystallites of size 2rg and to the suppression of weak links in the intercrystallite space of δ 18−20). For the fields below the first critical magnetic field of crystallites HcIg, the shift of the front of Btr from the disk center rx is equal to the radius
rg of the disk. The suppression ∆Btr was determined from
. )] ( ) ( [
) 0 ( )
0 (
1 tr 2 1 tr 2 tr
tr tr
∑
= − −
= =
∆ = =
N
n n n
t B t B
t B B
t B k
(1)
(a)
(b)
Fig. 1. (a) Time dependence of the field H(t) for arbitrary parameters of
the LC circuit, and (b) schematic illustration of the radial distribution of the sample response Btr to the field H(t).
remanent signal ∆Btr is a quantity of second-order compared with the response Btr of a sample to the first half-period of the field H(t). To evaluate ∆Btr for the values of t corresponding to six extrema of the first three periods of the field H(t), we determined Btr(t) from H0exp(−βt). Next, we calculate Btr(t2n) = Btr2 + Btr4 + Btr6 and Btr(t2n−1) = Btr1 +
Btr3 + Btr5 for the positive and negative half-periods, respectively. The calculation yields the value of k ∼ 23.1 for all values of H0 throughout a frequency interval of 0.1−2 kHz. Moreover, Fig. 1b shows that k significantly increases due to a relatively close position of the working area of the Hall probe to the front of the magnetic impulse. The remaining signal after the front of the magnetic field can be substantially reduced by increasing the resolution of the method via reducing the damping factor D = ln(Hn /
Hn+1) of the LC circuit and reducing the size of the Hall probe (there are Hall probes with a working area of 10 × 10
µm2).
To trap magnetic flux in a homogeneous magnetic field and measure the magnetic-field dependences of neff(H0) and
Hi(H0), as well as to compare the results obtained in this way with the results obtained by a front of a decaying ac magnetic field, we also carried out measurements in the ZFC (zero field cooling) regime. The ZFC differs from ZFCMFA in that, each time after the trapping a magnetic flux, the sample was heated to temperature above Tc and cooled again to temperature of 77.4 K. The component of Earth's magnetic field Hz was compensated by a coil coaxial to the solenoid producing the external magnetic field. The method and the setup are described in detail in18−20, 29).
2.2. Samples
The analysis was carried out on YBCO samples with different microstructures, different edge barrier heights, different bulk pinning, and different demagnetization fields. Samples in the form of a disk 8 mm in diameter, cut out of single-crystal epitaxial quasi-single-crystal YBCO films (sample 1), texture polycrystalline YBCO samples with the axis c perpendicular to the sample plane (sample 2), and nontextured polycrystalline YBCO samples (sample 3) had a thickness of ~0.4 µm, ~0.7 mm, and ~4.3 mm, respectively. Epitaxial YBCO films were obtained by laser sputtering of a high-density stoichiometric YBCO target onto a well polished NdGaO3 (110) sample
31)
. X-ray diffractometer analysis showed that the c axis in the films is perpendicular to the plane of the substrate and the films have low concentration of defects. Investigations carried out by a high-resolution scanning electron microscope and current measurements have shown that films have a smaller number of twinning boundaries and exhibit in-plane anisotropy comparable with the crystal anisotropy32). The critical current measured by the dc four-probe technique on bridges fabricated by photolithography and wet etching was about 5⋅106 A/cm2 in the Earth's field. The textured and nontextured YBCO polycrystalline samples were cut
out from a cylindrical ingot by a diamond-point cutter. The melt textured samples were synthesized by placing a seed on the top of a melt at high temperature. Polarized beam optical microscope examination of a mechanically polished surface clearly revealed bright (single-crystal) blocks with a size of about 0.11 cm2 separated by narrow inclusions of green color. This fact was confirmed by the results of the scanning Hall-probe measurements of a trapped magnetic flux. The nontextured samples were synthesized by the standard solid-phase technology and had a relative density of 95% (the theoretical density was assumed to be 6.38 g⋅cm−3) and consisted of chaotically oriented anisotropic crystallites of different shapes and arrangement, with an average size of about 1 µm. To eliminate the nonuniform distribution of oxygen on the surfaces of the disks, the end surface layers were removed by a diamond cutter.
monodomain was about 3, which indicates that there is a small number of twinning boundaries in the monodomain. The starting temperature and the width of the superconducting transition (Tc and ∆Tc) of a sample placed in a microsolenoid (l ~ 330 µH) were measured by a resonance inductance meter in the frequency band 110−155 kHz. The temperature dependence of inductance l(T) for the epitaxial film yielded Tc = 92 K and ∆Tc = 0.6 K, while, for samples 2 and 3, we obtained Tc = 92 K and ∆Tc = 2 K and 4 K, respectively.
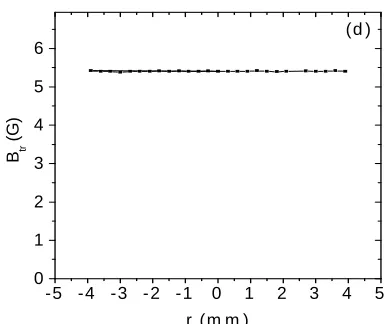
Fig. 2. Radial distribution of the trapped magnetic-flux density Btr for
samples 1, 2 and 3. (a) the function Btr(r) measured on sample 2 in magnetic fields of 25 Oe (curve 1), 50 Oe (curve 2) and 65 Oe (curve 3); (b) the function Btr(r) for sample 2 in a field of 1.3 kOe; (c, d) the function Btr(r) measured on samples3 and 1 in a magnetic field of 1.3 kOe.
3. Experimental Results
3.1. Experimental Results Obtained When Trapping Magnetic Flux by the Front of a Decaying Magnetic Field
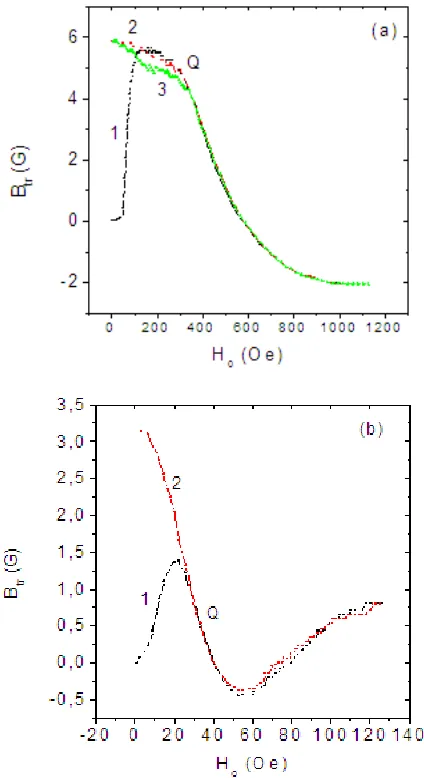
Figure 3 shows the magnetic-field dependence of the density of the trapped magnetic flux Btr(H0) for sample 1 (a), sample 2 (b), and for sample 1, measured in the ordinary ZFCMFA regime (c). One can see (curves 1 in Figs. 3a and 3b) that the function Btr(H0) reaches a maximum as the field increases. When the field is stepwise decreased from its maximal value (curves 2), the function reproduces the forward curves 1 up to a certain irreversibility point Q, after which curves 1 and 2 start to diverge. Namely, curves 2 monotonically increase, reaching a saturation value. Further repetitions of the cycles of increasing and decreasing external field do not change the character of curves 2. Figure 3c shows that, during the trapping in a uniform field, curve 1 slowly increases with the field and reaches a saturation. As the external field decreases (curve 2), a sample stores the maximum value of Btr reached on curve 1.
-3 ,5 -3 ,0 -2 ,5 -2 ,0 -1 ,5 -1 ,0 -0 ,5 0 ,0 -1
0 1 2 3 4 5 6 7 8 9 1 0 1 1
(a )
Btr
(G
)
r (m m ) 1
2 3
-4 -3 -2 -1 0 1 2 3 4
1 2 1 4 1 6 1 8 2 0 2 2
2 4 (b )
Btr
(
G
)
r (m m )
-5 -4 -3 -2 -1 0 1 2 3 4 5
0 5 1 0 1 5 2 0 2 5 3 0 3 5 4 0 4 5 5 0
(c )
B tr
(
G
)
r (m m )
-5 -4 -3 - 2 -1 0 1 2 3 4 5
0 1 2 3 4 5 6
(d )
B tr
(
G
)
Fig. 3. The magnetic-field dependence of the density of the trapped
magnetic flux Btr(H0) (a) for sample 1, (b) sample 2, and (c) for sample 1,
measured in the ordinary ZFCMFA regime.
Figure 4 shows the function Btr(H0) for sample 3 (a) and for sample 1 measured at a point shifted by 2 mm from the geometrical axis of the film (b). Figure 4c demonstrates the tail of Fig. 4b in expanded scale. A comparison of curves in Figs. 3a, 3b, and 4a shows that, as the quality of the samples deteriorates, the irreversibility point comes closer and closer to the point of maximum, while, above the irreversibility point, curve 2 is smeared more and more under the cycling of the external field. One can see that curves 1 and 2 in Figs. 4b and 4c exhibit regular steps over certain intervals of the external field both for increasing and decreasing fields. The initial parts of the function
Btr(H0) shown in Fig. 3a demonstrate that curve 2 for sample 1 exhibits good repetition as opposed to the curve for samples 2 and 3. Another goal of the present study is to compare the results for a point on the geometrical axis of a film and a point shifted by 2 mm from the axis. Figures 3a and 4b show that the results in the low-field region are qualitatively different. This fact can be attributed both to the stronger manifestation of the demagnetization fields due to the external surface of a sample and to the microstructure of the film, and is not an experimental error
high sensitivity to small spatial dispersion of the local characteristics of a sample. A comparison of Figs. 3 and 4 shows that the method proposed allows one to obtain qualitatively new results in samples with different microstructures.
(a) In contrast to the conventional methods, the function
Btr(H0) passes through a maximum, rather than reaches a saturation value, as the field increases.
(b) As the field decreases, the maximum value of the function Btr(H0) is not stored as the field increases, but this function exhibits strong hysteresis.
(c) Under further cycling of the field, the function Btr(H0) shows complete reversibility (the absence of hysteresis).
(d) The curves Btr(H0) exhibit steplike behavior.
Fig. 4. The function Btr(H0) (a) for sample 3, and (b) for sample 1
measured at a point shifted by 2 mm from the geometrical axis of the film; (c) the tail of Fig. 4b in expanded scale.
3.2. Results Obtained When Trapping Magnetic Flux In a Uniform Magnetic Field
Figure 5 shows a typical magnetic-field dependence
Btr(H0) (a) and the difference of the densities of trapped magnetic fluxes Btr2− Btr1 as a function of H0 (b). Curve 2
in Fig. 5a is measured in the ZFCMFA regime, and curve 1, in the ZFC regime. Curve 1 in Fig. 5b is obtained by subtracting curves 1 from curves 2 (Fig. 5a), and curve 2 corresponds to sample 3. The inset in Fig. 5a shows the initial region of curve 1. As is shown in18), the magnetic-field dependence of Btr2 − Btr1 is proportional to the function neff(H0). Curve 1 in Fig. 5b allows one to clearly distinguish the values of the following fields: the first critical magnetic field of the interdomain medium (Hc1J
≅ 3 Oe), the setting field of the critical state of the interdomain medium (HcJt ≅ 50 Oe), the first critical magnetic field of monodomains (Hc1g ≅ 60 Oe), and a number of first critical magnetic fields of crystallites and subcrystallites (≅ 240, 320, 460, 600, 650 Oe, etc.). The values of Hc1J, HcJt, and Hc1g are in good agreement with literature data35,36). Figure 5a shows that that these curves do not allow one to clearly determine the first critical magnetic fields HcJt and Hc1g and the first critical magnetic fields of crystallites and subcrystallites. Curve 1 in Fig. 5b allows one to clearly determine the values of these fields, because the Meissner screening currents play a crucial role when subtracting curves. When the size distribution of monodomains, crystallites, and subcrystallites has clear-cut maxima, the magnetic-field dependence of the effective demagnetizing factor neff(H0) of a sample more clearly displays the characteristic fields (Fig. 5b, curve 1), while, when the distribution function is smooth, the characteristic fields manifest themselves weaker (Fig. 5b, curve 2). The Meissner surface currents can be found from the expression37)
JS = 10 Hc / 4πλ; (2)
here λ is the penetration depth of the magnetic field into a sample.
Figure 6 demonstrates the magnetic-field dependence
Hi(H0) (a) and Jc(H0) (b) for sample 2. It is well-known that, at zero temperature, the critical thermodynamic magnetic field Hc(0) for bulk YBCO is about 1 T9). Substituting these parameters into the formula2)
Fig. 5. (a) A typical magnetic-field dependence Btr(H0), and (b) the
difference of the densities of trapped magnetic fluxes Btr2− Btr1 as a
function of H0. Curve 2 in Fig. 5a is measured in the ZFCMFA regime,
and curve 1, in the ZFC regime.
Fig. 6. The magnetic-field dependence (a) Hi(H0) and (b) Jc(H0) for
sample 2.
we obtain Hc(77.4) = 2.8⋅103 Oe. The measured value of
650 Oe of the first critical magnetic field of subcrystallites corresponds to the calculated value of the thermodynamic first critical magnetic field of Hic ~ 2.82⋅103 Oe, which well agrees with the estimated result. Figure 6b shows that the Meissner screening current is a nonlinear function of the field. As the field increases, JS varies from about 5.7 103 A/cm2 for a sample to about 8.2⋅107 A/cm2 for subcrystallites; this curve continues to slowly grow rather than reaches a saturation value. This shows that the currents of subcrystallites in a field of Hc ~ 2.82⋅103 Oe are more than two orders of magnitude greater than the critical current of a monodomain measured by the four-probe technique in the Earth's field. For sample 2 at temperature of 77.4 K, the depairing current JcGL is determined from37)
JcGL(T) = 10 H
c[1−(T/Tc)1/2]/3⋅61/2πλ). (4) According to our estimates, JcGL(77.4) = 1.91⋅107 A/cm2. Substituting the values of Jci and Btri into the formulas
Fp = (1/c)JcBtr , (5)
fp = (Φ0/c)Jc (6)
(Φ0 is a magnetic flux quantum and c is the velocity of light), we determine the volume density of the pinning force and the pinning forces acting on a unit length of a vertex22).
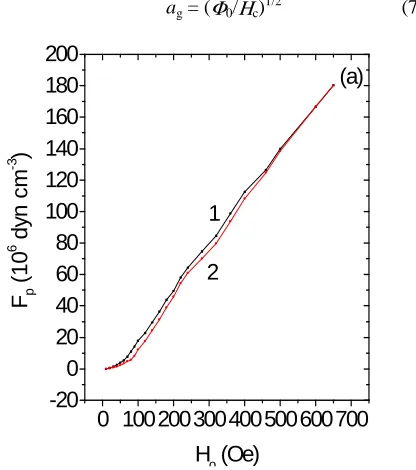
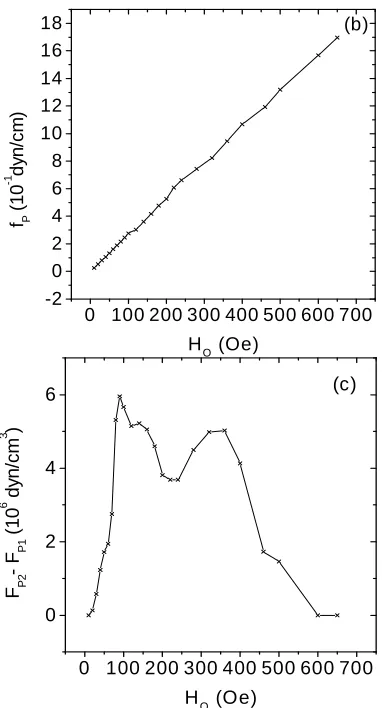
Figure 7 shows the magnetic-field dependence of Fp(H0) (a), fp(H0) (b), and (Fp2 − Fp1)(H0) (c). Here Fp1 corresponds to the ZFC regime, and Fp2 corresponds to the ZFCMFA regime. Figure 7c show that (Fp2 − Fp1)(H0) is a nonmonotonic function of H0. This behavior of the curves is likely to be attributed to the anisotropy of pinning at twinning planes38,39), as well as to the pinning of the magnetic flux at other possible structural defects. The linear size of crystallites and subcrystallites is determined from the expression
ag = (Φ0/Ηc)1/2 (7)
0 100200300400500600700
-20
0
20
40
60
80
100
120
140
160
180
200
(a)
F
p(
1
0
6
d
yn
c
m
-3
)
H
o(Oe)
1
Fig. 7. The magnetic-field dependence of (a) Fp(H0), (b) fp(H0), and (c)
(Fp2 − Fp1)(H0). Here Fp1 corresponds to the ZFC regime, and Fp2
corresponds to the ZFCMFA regime.
Figure 8 demonstrates the function ag(Ηi) for sample 2. One can see that, as the field increases, the size of subcrtystallites decreases from about 0.84 µm to about 0.1
µm. The energy EJ of interdomain, intercrystallite, and intersubcrystallite Josephson junctions and the intradomain, intracrystallite, and intrasubcrystallite condensation energy
Eg for fields Hic and currents Jc can be found from the expressions14,39)
EJ = Jcag2/2e, (8)
Eg = VgHcg2/8π, (9)
where Vg = ag3 is the volume of domains or crystallites and subcrystallites, and e is the electron charge.
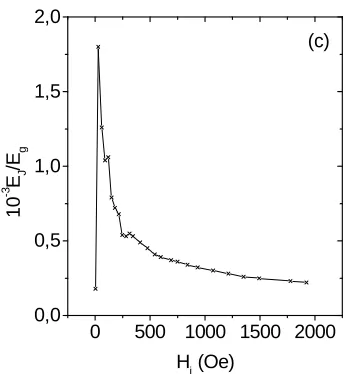
Figure 9 presents the magnetic-field dependences EJ(H0) (a), Eg(H0) (b), and EJ/Eg(H0) (c) for sample 2. Figure 9a shows that the energy of Josephson junctions formed on intercrystallite and intersubcrystallite twinning planes is much greater than the energy of intradomain Josephson junctions; the energy of intradomain Josephson junctions changes little as the magnetic field increases. However, Fig. 9b shows that the values of the intradomain, intracrystallite, and intrasubcrystallite condensation energy increase as the
size of crystallies and subcrystallites decreases and lead to the decrease of the ratio EJ/Eg as a function of H0. It is obvious that, in view of the sufficiently high demagnetization factor of the film, the values of Hci, Jci, EJi, and Egi for domains, crystallites, and subcrystallites in the film are much greater than the analogous characteristic values in sample 2; in this case, the linear size agi of a subcrystallite may reach the minimum value (see Fig. 8), thus giving rise to nanocrystallites (intertwining domains)8).
Fig. 8. The function ag(Ηi) for sample 2.
0 100 200 300 400 500 600 700 -2
0 2 4 6 8 10 12 14 16
18 (b)
fP
(
1
0
-1 d
yn
/c
m
)
HO (Oe)
0 100 200 300 400 500 600 700 0
2 4
6 (c)
FP
2
-
FP
1
(
1
0
6 d
y
n
/c
m
3 )
HO (Oe)
0 500 1000 1500 2000
0,0 0,2 0,4 0,6 0,8
a
(
m
k
m
)
Hi (Oe)
0 500 1000 1500 2000
-1 0 1 2 3 4
(a)
EJ
(
1
0
-1
6 J
)
Hi (Oe)
0 500 1000 1500 2000
2 4 6 8 10 12 14
(b)
Eg
(
1
0
-1
3 J
)
Fig. 9. The magnetic-field dependences (a) EJ(H0), (b) Eg(H0), and (c)
EJ/Eg(H0) for sample 2.
4. Discussion of the Results
Since the epitaxial and polycrystalline films and textured and nontextured bulk polycrystalline HTSC samples exhibit similar behavior, we carry out the comparative analysis of the results for sample 2. The dense disposition of interdomain links and the vitreousness of the microstructure of the sample lead to the macroscopic penetration of magnetic flux into the sample. First, magnetic flux penetrates into interdomain weak links in the form of hypervortices10) and is trapped there after the removal of the field. Then, as the field increases, the flux in the form of a linear chain of Josephson and Abrikosov vortices penetrates into monodomains and is trapped there after the removal of the field. Thus, the function Btr(H0) monotonically increases up to its maximum. A further increase in the external field leads to the penetration of vortices into crystallites and subcrystallites and to a partial suppression of the currents of interdomain, intercrystallite, and intersubcrystallite weak links by the stray fields of the Josephson and Abrikosov vortices trapped in the domains, crystallites, and subcrystallites. As the field increases, due to the significant amplification of the local stray fields of vortices trapped in the domains, crystallites, and subcrystallites by the demagnetization fields of nearby domains, crystallites, and subcrystallites, these local stray fields become large enough to close the flux path around domains, crystallites, and subcrystallites18-20,40). Thus, the density of the flux directed opposite to the external field increases, and curve 1 continues to decrease (Fig. 3b). This reduces the mean value of Btr and the size of hypervortices. The competition between the decrease in the effect of the demagnetization fields and the preservation of more stable weak links leads to the narrowing down of the space of interdomain, intercrystallite, and intersubcrystallite weak links, forming transparent windows and narrow regions (bridges) that connect the above structures. It is these windows through which the stray fields of the vortices
trapped in monodomains, crystallites, and subcrystallites are closed. A decrease in the external field from a given maximal value leads to the slow rearrangement of the vortices trapped on the twinning boundaries of monodomains, crystallites, and subcrystallites and again to the trapping of the Josephson and Abrikosov vortices on intersubcrystallite and intercrystallite twinning planes. This gives rise to phase-dependent identically directed vortex arrays in the sample. A further decrease of the field leads to a slow aggregation of the vortex arrays, and the function
Btr(H0) increases, reaching a saturation when the vortex array occupies the whole volume of the sample and the stray fields of all the vortices are closed around the sample. The cycling of the external field does not change the character of curve 2 in Fig. 3b due to the repletion of the cycles of slow suppression of weak links by the stray fields of the Josephson and Abrikosov vortices trapped in subcrystallites, crystallites, and monodomains and further flipping and trapping of the Josephson and Abrikosov vortices in weak links. Thus, as the field increases, the trapped flux is gradually switched to centers with stronger pinning, suppressing the trapped flux at centers with weak pinning. This fact is exhibited by a slow decrease in magnetic relaxation down to its complete vanishing as the field increases. The relaxation was determined by measuring the variation in Btr within five minutes after turning off the solenoid current. As the field decreases, the trapped flux is preserved at centers with strong pinning, and then centers with weak pinning start to take part in the trapping. Thus, as the external field increases, the boundary between the vortex and Meissner regions slowly contracts around the areas with the highest critical parameters (Hc1i,
Jci, and Tci); as the field decreases, the space between these areas is filled. The explanation given above clearly shows that the cycling of the field leads to transitions between the Gaussian and δ(H0)-like distributions of the trapped magnetic flux. In the traditional methods, all the pinning centers take part in the trapping of the flux when the field either increases or decreases. The fact that the results obtained on samples 1, 2, and 3 exhibit similar behavior points to the universal mechanism of penetration (exit), distribution, and trapping of magnetic flux in these samples. This result allows us to suggest that the major part of magnetic flux penetrating into a HTSC sample penetrates there in the form of Josephson vortices, which are mainly pinned on weak links and twinning boundaries. Then growth of the field just shortens long weak links and twinning boundaries and changes the size of Josephson vortices. As the size of vortices decreases, they start to "see" densely arranged twinning boundaries and small-scale structural irregularities of the sample. The irreversibility point Q determines the vanishing threshold of hypervortices. This is indicated by the approximation of the irreversibility point to the maximum point as the quality of samples deteriorates. Thus, the multiphase nature of the magnetic flux (which consists of Josephson and Abrikosov vortices of different spatial scales and of
0 500 1000 1500 2000
0,0 0,5 1,0 1,5 2,0
(c)
1
0
-3 E
J
/E
g
vortex−antivortex-type nanodipoles formed by Josephson and Abrikosov vortices with different orientations) and the vitreous character of HTSC give rise to the superconducting glass state in the sample. The simultaneous penetration of vortices into monodomains and a large number of crystallites and subcrystallites with close values of the demagnetization factor leads to steps on the diagram of Btr(H0) (Figs. 4b, c). Since an ever increasing number of small crystallites and subcrystallites take part in the process as the external field increases, the steps on the diagram become more and more pronounced; a decrease in the demagnetization factor of the crystallites and subcrystallites impedes the penetration of the field into them and thus increases the interval between these steps.
5. Conclusions
The results of the study clearly show that the effective magnetic permeability of HTSC experiences a sharp change as the magnetic field increases and a sample is decomposed into monodomains, crystallites, and subcrystallites. This result clearly demonstrates that HTSC represents a multistep magnetic system consisting of interpenetrating subsystems with opposite magnetic moments spatially separated by current clusters. The key parameter of such a system, EJ/Eg11), decreases as the magnetic field increases (Fig. 9c). The results of the investigation show that the vitreous character of HTSC is attributed to the very nature of HTSC, more precisely, to the small coherence length of HTSC. The enhancement of the short-range order due to the improvement of the sample quality, as well as the fact that Jc of monodomains, crystallites, and subcrystallites is much greater than the Jc of a macroscopic sample result in a qualitative difference between the local and integral properties of HTSCs. A deeper insight into the factors responsible for the difference between the local and integral properties of HTSCs may facilitate the design of a model for the adequate description of the HTSC physics. To explain the mechanism of current flow through current clusters and the flow of vortices along normal zones, it is more appropriate to apply the block model of Meissner domains rather than the cluster model of weak links41). To take into consideration the transformation of the topology of Meissner domains and the multiple scale phenomena, as well as to calculate the characteristics of the percolation transition and the critical exponents, it is much more convenient to apply the Sierpinski carpet with infinite ramification − a modified two-dimensional analog of the Cantor set42-44).
According to the results obtained, the experimental value of JcGL of subcrystallites is much higher than the estimated values of JcGL; therefore, the following questions remain open:
How do the width and length of twinning boundaries change as the field increases?
Is the coherence length the lower limit of the size of subcrystallites at which the weak links affecting the Jc are
missing?
Is the penetration depth λ invariant under the variation of the space scale?
How do the size and the energy of vortices change when passing to nanoscales?
Moreover, these questions entail many other related questions.
6. Summary
We have developed an algorithm for the experimental investigation of HTSC problems that have not been actually analyzed. We have proposed a method of local approximation for the simultaneous investigation of the crystallographic and magnetic microstates of superconductors and for studying the specific features of interaction between the crystallographic and magnetic microstructures of HTSCs. We have found that both epitaxial films and bulk polycrystalline HTSC samples consist of various groups of monodomains, crystallites, and subcrystallites with different demagnetization factors. We have confirmed the earlier obtained results18-20) that, to reduce the Gibbs free energy component due to demagnetization fields, it is energetically favorable for a sample to decompose into domains, crystallites, and subcrystallites. We have found that interdomain weak links with wide spectrum and high demagnetization fields of monodomains allow weak magnetic fields to penetrate into a textured polycrystalline HTSC sample, forming hypervortices in it. We have shown that the multiphase nature of the magnetic flux and the vitreous character of the microstructure of a polycrystalline HTSC sample leads to the formation of a superconducting glass on a different physical basis compared with the Ebner−Stroud granulated glass model1,45,46). We have measured the local critical parameters of monodomains, crystallites and subcrystallites and the interdomain, intercrystallite, intersubcrystallite, and intrasubcrystallite weak links; the energy EJ of interdomain, intercrystallite, intersubcrystallite Josephson junctions; the condensation energy Eg in monodomains, crystallites, and subcrystallites and the pinning forces in them; and the linear dimensions of monodomains, crystallites, and subcrystallites. We have found that EJ sharply increases with the magnetic field due to the diffusion of magnetic flux from the interdomain space into a monodomain; in this case, EJ varies little in the intradomain space, while Eg increases and becomes more than three orders of magnitude over the entire range of the external field.
Acknowledgments
I am grateful to V.N. Gubankov for his interest in this work and valuable remarks and to I.P. Nikitin for help in the work.
References
[1] Physical Properties of High-Temperature Superconductors, ed. by D.M. Ginsberg (World Scientific, Singapore, 1990; Mir. Moscow, 1990).
[2] V. V. Schmidt: The Physics of Superconductors : Introduction to Fundamentals and Applications (Springer, Berlin, 1997; MTsNMO, Moscow, 2000).
[3] V. M. Pan: Fiz. Nizk. Temp. (Karkov) 32 (8) (2006) 1039 [Low Temp. Phys. 32 (8) (2006) 783].
[4] A. S. Mel,nikov, Yu. N. Nozdrin, I. D. Tokman et al.:Phys. Rev. B. 58 (1998) 11672.
[5] M. W. Rupich, U. Schoop, D. T. Verebelyi et al.: IEEE Trans. Appl. Supercond., 13 (2) (2003) 2458.
[6] M. S. Hatzistergos, H. Efstathiadis, E. Lifshin et al.: IEEE Trans. Appl. Supercond. 13 (2) (2003) 2470.
[7] A. A. Zhukov and V. V. Moshchalkov: Sverkhprovodomost : Fiz., Khim., Tekh. 4 (1991) 850.
[8] E. Z. Meilikhov: Usp. Fiz. Nauk 163 (3) (1993) 27 [Phys. Usp. 36 (3) (1993) 129].
[9] Chemistry of High-Temperature Superconductors: Ed. by D. Nelson, M. Whittingham, and T. George (American Chemical Society, Washington, DC, United States, 1987; Mir, Moscow, 1988), Chap. 28.
[10] E. B. Sonin: Pis'ma Zh. Eksp. Teor. Fiz. 47 (1988) 415 [JETP Lett. 47 (1988) 496].
[11] J. R. Clem: Physica C 153-155 (1988) 50.
[12] G. Deutsher: Physica C 153-155 (1988) 15.
[13] Kh. R. Rostami: The 23 rd International Conference on Low Temperature Physics LT 23, August 20-27, 2002, Hiroshima, Japan, Program and Abstracts, P.312.
[14] Kh. R. Rostami: MT 20 – 20TH Internationa Conference on Magnet Technology, August 27- 31, 2007, Philadelphia, Pennsylvania, USA, Program and Abstracts, # 5105.
[15] Kh. R. Rostami: 20 TH International Symposium on Superconductivity (ISS), November 5-7, 2007, Tsukuba, Japan, Program and Abstracts, PCP-45, PCP-46, p.77.
[16] A. Sulpice, P. Lejay, R. Tournier et al.: Europhys. Lett. 7 (1988) 365.
[17] S. Nakahara, T. Boone, M. F. Yan et. al. : J. Appl. Phys. 63 (1988) 451.
[18] Kh. R. Rostami: Zh. Eksp. Teor. Fiz.128 (4) (2005) 760 [JETP 101 (4) (2005) 653].
[19] Kh. R. Rostami: Zh. Eksp. Teor. Fiz.134 (4) (2008) 716 [JETP 101 (4) (2008) 653].
[20] Kh. R. Rostami: Mod. Phys. B 23 (2009) 4277.
[21] V. N. Gubankov and Kh. R. Rostami: Fiz. Tverd. Tela (St. Petersburg) 43 (7) (2001) 1168 [Phys. Solid State 43 (7) (2001) 1210].
[22] Kh. R. Rostami: Fiz. Nizk. Temp. 27 (2001) 103 [Low Temp. Phys. 27 (2001) 79].
[23] L. M. Fisher, A. V. Kalinov, L. F. Voloshin, and V. A. Yampol'skii: Phys. Rev. B 71 (2005) 140503.
[24] D. Daghero, P. Mazzett, A. Stepanescu, and A. Masoero: Phys. Rev. B 66 (2002) 184514.
[25] D. Zola, M. Polichetti, C. Senatore, et al.: Phys. Rev. B 70 (2004) 224504.
[26] Ch. Jooss, J. Albrecht, H. Kuhn, et al.: Rep. Prog. Phys. 65 (2002) 651.
[27] V. N. Zabenkin, L. A. Akseľrod, A. A. V.orob,ev, et. al.: JETP Letters 70 (1999) 771 [JETP Letters 70 (1999) 787].
[28] Kh. R. Rostami: 4TH International Conference on Magneto Science (ICMS 2011) in Shanghai & Xi,an, China (October 9-15, 2011), www.mag-sci2011com.
[29] Kh. R. Rostami: Prib. Tekh. Éksp. N6 (2004) 95 [Instrum. Exp. Tech. 47 (6) (2004) 809].
[30] C. P. Bean: Rev. Mod. Phys. 36 (1964) 31.
[31] P. B. Mozhaev, G. A. Ovsyannikov, A. Kuhle, et al.: Sverkhprovodimost: Fiz. Khim. Tekh. 8 (1995) 288.
[32] T. Scherer, P. Marienhoff, R. Herwig et al.: Physica C, 197 (1992) 79.
[33] Kh. R. Rostami, V. V. Mantorov, and V. I. Omeľchenko: Fiz. Nizk. Temp. 22 (1996) 736 [Low Temp. Phys. 22 (1996) 565].
[34] H. Hilgenkamp, J. Mannhart: Rev. Mod. Phys. 74 (2002) 485.
[35] Cao Xiaowen, Han Guchang, and Zhang Tingyu: Mod. Phys. Lett. B1 (9/10) (1988) 383.
[36] H. Dersch and G. Blatter: Phys. Rev. B 38 (1988) 11391.
[37] M. Tunkham: Introduction to Superconductivity (New York; MeGraw - Hill (1975), Atomizdat, Moscow (1980)).
[38] W. K. Kwok, U. Welp, S. Fleshler et. al.: Phys. Rev. Lett. 64 (1990) 966.
[39] A. Barone and G. Paterno: Physics and Applications of Josephson Effect, Wiley, New York (1982), Mir, Moscow (1984).
[40] Kh. R. Rostami: 25TH International Conference on Low Temperature Physics (LT 25), August 6- 13, 2008, Leiden, Netherlands, Program and Abstracts, p 45.
[41] Y. I. Kuzmin: Low Temp. Phys. 130, (3/4) (2003) 261.
[42] I. M. Sokolov: Usp. Fiz. Nauk 150 (2) (1986) 221 [ Sov. Phys. Usp. 29 (1986) 924].
[43] A. N. Herega, N. G. Drik, A. P. Ugoľnikov: Usp. Fiz. Nauk 182 (5) (2012) 555 [Phys. Usp. 55 (5) (2012) 129].