Original Research Article
Self perceived visual health among women aged 18-59 years in a rural
area of Greater Noida, Uttar Pradesh: a cross sectional study
Amit Singh Pawaiya
1, Ieshitva Jain
2, Khushboo Juneja
1, Mithila Dayanithi
3*, S. Nagesh
4INTRODUCTION
There are approximately 1.3 billion with some form of vision impairment globally, out of which 188.5 million have mild vision impairment, 217 million have moderate to severe vision impairment and 36 million people are
blind. About 80% of all vision impairment globally is avoidable and most of the affected are above 50 years.1
India became the first country in the world to launch the National Program for Control of Blindness (NPCB) in 1976, now called National Program for Control of
ABSTRACT
Background: Visual health is both visual function and individual’s perception of vision. This study was conducted to estimate visual function and individual’s perception of vision and to understand the impact of sociodemographic factors and treatment seeking behaviour for eye morbidities among women in our society. The aim of the study was to obtain visual acuity scores and the perceived visual function score and analyse both objective and subjective visual health.
Methods: A community based cross-sectional study was conducted among 182 women aged 18-59 years residing in rural practice area of School of Medical Sciences and Research, Sharda University, Greater Noida.
Results: The most common problem in the study group was moderate visual impairment (23.1%), followed by severe visual impairment (8.2%) and blindness (1%). The common causes being uncorrected refractive errors followed by cataract. Visual impairment was maximum among 49-59 years (47.46%), illiterate (54.24%) and in lower socio-economic status (54.24%).
Conclusions: An intersectoral approach involving the PRI, ASHA/ANM at all levels of the health system may be appropriate. Strategies involving the communities, schools, colleges, workplaces and shifting to preventive and curative approach instead of only curative approach may help to create more awareness about common avoidable causes of blindness namely refractive errors and cataract. Comprehensive eye care services from early screening to treatment need to be made accessible, affordable and available at all levels of health system irrespective of gender, literacy, age and socioeconomic status to improve visual health and thus quality of life.
Keywords: Greater Noida, Self perceived, Visual health, Visual impairment, Women
1
Assistant Professor, 4Professor & HOD, Department of Community Medicine, School of Medical Sciences & Research, Sharda University, Greater Noida, Gautam Buddh Nagar, Uttar Pradesh, India
2
MBBS Student, School of Medical Sciences & Research, Sharda University, Greater Noida, Gautam Buddh Nagar, Uttar Pradesh, India
3
Associate Professor, Department of Community Medicine, Rama Medical College Hospital & Research Centre, Hapur, Uttar Pradesh, India
Received: 15 May 2019
Revised: 04 June 2019
Accepted: 05 June 2019
*Correspondence:
Dr. Mithila Dayanithi, E-mail: [email protected]
Copyright: © the author(s), publisher and licensee Medip Academy. This is an open-access article distributed under the terms of the Creative Commons Attribution Non-Commercial License, which permits unrestricted non-commercial use, distribution, and reproduction in any medium, provided the original work is properly cited.
Blindness and Visual Impairment (NPCBVI) to reduce prevalence of blindness.2 There are 62 million with visual impairment of which 8 million are blind which is about one-fourth of global blindness.3,4 By 2020, blindness is likely to increase to 18 million with the increase in life expectancy and projected increase in the country’s population. By adopting the strategies advocated by Vision 2020, India is committed to reduce the preventable blindness by 2020.5
Visual impairment severely affects the working capacity and quality of life. Age, sex, literacy and working status are associated with blindness. Visual impairment was found more in illiterates, females, rural residents and among those above 70 years of age.6
Visual health being a comprehensive measure of visual function and individual’s perception of vision, this study was conducted to estimate both objective and subjective visual health and to understand the impact of sociodemographic factors and treatment seeking behaviour for eye morbidities amongst the women of our society who generally ignore their health. Health seeking behaviour is influenced by a variety of socio-economic variables, including sex, age, the social status of women, the type of illness, access to services and perceived quality of the service etc.7
METHODS
A community based study was conducted in rural catchment areas of School of Medical Sciences & Research, Greater Noida, Uttar Pradesh from 1st August to 30th September 2018. Four villages; Girdharpur, Patla Khera, Chirsi and Kullipuraby were selected out of 8 villages, using purposive sampling. From the selected villages by simple random sampling a list of eligible women was prepared with the help of medical social worker. Sample size was calculated by considering prevalence of visual impairment 24.5% with 7% absolute error, 10% non response rate and 95% confidence interval (CI).8 The sample was collected from 182 women.
A pre-designed, semi structured questionnaire was prepared using visual functioning questionnaire-25 (VFQ-25) as reference.9 The questionnaire covered socio-demographic profile, present eye complaints, treatment seeking behavior, history of surgeries and other disease like diabetes, hypertension etc.
A team of two qualified optometrist took all the measurements after the equipment used were standardized and validated before visit to each village. Visual Acuity was measured using a Landolt chart placed 6 meters away from the women. For each participant visual acuity of each eye was measured separately with their correcting glasses on and the measurement in better eye was considered for the purpose of this study.
Normal vision was taken as (≥6/18), moderate visual impairment as (<6/18-6/60), severe visual impairment as (<6/60-3/60) and visually blindness was taken as (<3/60-1/60).
Perceived visual functioning was assessed using questionnaire consisting of 14 questions on subject’s perception of general eye health status, perceived near, distant, colour and peripheral vision, past surgeries, history of chronic diseases, frequency of eye checkups and spectacle usage.
The data was analyzed using Statistical Package for the Social Sciences Software (SPSS) version 22.0. Confidence interval of 95%, p<0.05 was considered significant for analysis.
RESULTS
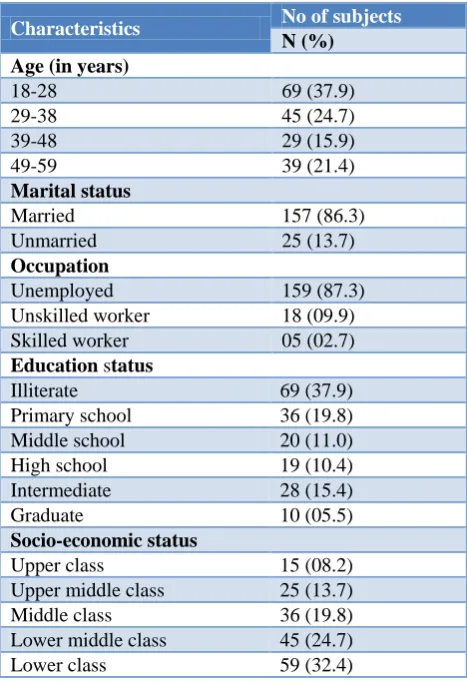
A total of 182 women aged 18-59 years participated in the study. Majority of respondents were in the age group 18-28 years (37.9%), illiterate (37.9%), unemployed (87.3%) and belonging to lower socio-economic status (32.4%) according to Modified Prasad Socio economic scale (Table 1).
Table 1: Distribution of study subjects according to their socio-demographic characteristics (n=182).
Characteristics No of subjects
N (%) Age (in years)
18-28 69 (37.9)
29-38 45 (24.7)
39-48 29 (15.9)
49-59 39 (21.4)
Marital status
Married 157 (86.3) Unmarried 25 (13.7)
Occupation
Unemployed 159 (87.3) Unskilled worker 18 (09.9) Skilled worker 05 (02.7)
Education status
Illiterate 69 (37.9) Primary school 36 (19.8) Middle school 20 (11.0) High school 19 (10.4) Intermediate 28 (15.4) Graduate 10 (05.5)
Socio-economic status
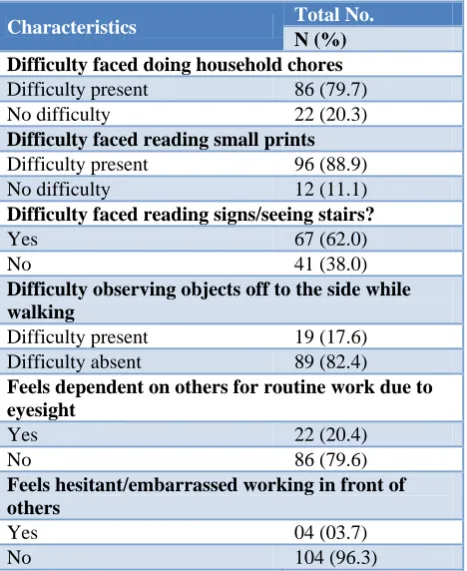
Out of the total 182 subjects, 108 (59.4) subjects rate their vision as unsatisfactory and report facing problems with distant vision (Table 2). Among them, 86 (79.7%) face problem doing household chores like stitching, cooking and 96 (88.9%) faced difficulty in reading small prints. Out of 108 women, 22 (20.4%) feel dependent on others to complete their household chores due to poor eyesight (Table 3). Only 4 (3.7%) among the 108 came up openly that they feel embarrassed working in front of others.
Table 2: Distribution of study subjects according to their eye related complaints and perceived visual
function status (n=182).
Perceived eye health status Total no.
N (%)
Good 74 (40.7)
Fair 84 (46.2)
Poor 24 (13.2)
Table 3: Distribution of study subjects facing difficulty in doing household chores (n=108).
Characteristics Total No.
N (%) Difficulty faced doing household chores
Difficulty present 86 (79.7) No difficulty 22 (20.3)
Difficulty faced reading small prints
Difficulty present 96 (88.9) No difficulty 12 (11.1)
Difficulty faced reading signs/seeing stairs?
Yes 67 (62.0)
No 41 (38.0)
Difficulty observing objects off to the side while walking
Difficulty present 19 (17.6) Difficulty absent 89 (82.4)
Feels dependent on others for routine work due to eyesight
Yes 22 (20.4)
No 86 (79.6)
Feels hesitant/embarrassed working in front of others
Yes 04 (03.7)
No 104 (96.3)
One or more than one eye related complaint leading to inadequate quality of personal and social life was reported by 135 (74.2%) women (Table 4). Among them, the most common reported problem in 93 (68.9%) subjects was blurring of vision and 92 (68.1%) women had headache followed by watering of eyes in 75 (55.6%) (Figure 1).
In the study group, prevalence of visual impairment was
were found to be moderately visually impaired, 15 (8.2%) had severe visual impairment and 2 (1%) were blind (Table 5). The most common cause being uncorrected refractive errors followed by cataract.
Figure 1: Study subjects with eye complaints (n=135).
Table 4: Women with eye related complaints (n=182).
Characteristics Total no.
N (%)
Subjects with eye related complaints
Present 135 (74.2)
Absent 47 (25.8)
Table 5: Distribution of women according to their visual acuity (n=182).
Characteristic Total no.
N (%)
Normal (≥6/18) 123 (67.6)
Moderate visual impairment
(<6/18-6/60) 42 (23.1) Severe visual impairment
(<6/60-3/60) 15 (08.2) Blindness (3/60-1/60) 02 (01.0)
Table 6: Distribution of women according to treatment seeking behaviour (n=108).
Characteristics Total no.
N (%)
Eye checkups (in last 1 year)
Yes 40 (37.0)
No 68 (63.0)
Spectacles prescribed (n=40)
Yes 27 (67.5)
No 13 (32.5)
Wear prescribed glasses (n=27)
Yes 6 (22.2)
Among those with unsatisfactory eye health status (108) only 40 (37%) women had their eyes checked up in last 1 year reflecting treatment seeking behaviour (Table 6).
Among them, 27 subjects (67.5%) have been prescribed correction glasses but only 6 (22.2%) of them were wearing them on a regular basis.
Table 7: Association of visual impairment with sociodemographic characteristics (n=182).
Characteristics Visual impairment present Visual impairment absent Chi-square P value
N (%) N (%)
Age (years)
54.2
0.0
18-28 07 (10.1) 62 (89.9)
29-38 12 (26.6) 33 (73.4)
39-48 12 (41.4) 17 (58.6)
49-59 28 (71.8) 11 (28.2)
Education
24.596 .056 Literate 27 (23.9) 86 (76.1)
Illiterate 32 (46.4) 37 (53.6)
Occupation
8.065 .52 Employed 03 (10.7) 25 (89.2)
Unemployed 56 (36.4) 98 (63.6)
Marital status
4.331 .22
Married 55 (35.0) 102 (65.0)
Unmarried 04 (16.0) 21 (84.0)
Socioeconomic status
23.709 .02
Lower 32 (52.5) 29 (47.5)
Lower middle 10 (22.2) 35 (77.8)
Middle 06 (16.6) 30 (83.3)
Upper middle 06 (24.0) 19 (76.0)
Upper 05 (33.3) 10 (66.7)
History of previous eye illness
10.566 .01
Present 10 (41.7) 14 (58.3)
Absent 49 (31.0) 109 (69.0)
Table 8: Distribution of visual impairment among the women of 18-59 years.
Characteristics Visual impairment present Visual impairment absent Total
N (%) N (%)
Age (in years)
18-28 7 (11.86) 62 (50.41) 69
29-38 12 (20.34) 33 (26.83) 45
39-48 12 (20.34) 17 (13.82) 29
49-59 28 (47.46) 11 (8.94) 39
Total 59 (100) 123 (100) 182
Education
Literate 27(45.76) 86 (69.92) 113
Illiterate 32 (54.24) 37 (30.08) 69
Total 59(100) 123 (100) 182
Occupation
Employed 3 (5.08) 25(20.33) 28
Unemployed 56 (94.92) 98 (79.67) 154
Total 59(100) 123(100) 182
Marital status
Married 55(93.22) 102(82.93) 157
Unmarried 4(6.78) 21(17.07) 25
Total 59(100) 123(100) 182
Characteristics Visual impairment present Visual impairment absent Total
N (%) N (%)
Socioeconomic status
Lower 32 (54.24) 29 (23.58) 61
Lower middle 10(16.95) 35 (28.46) 45
Middle 6 (10.17) 30 (24.39) 36
Upper middle 6 (10.17) 19(15.45) 25
Upper 5(8.47) 10 (8.13) 15
Total 59(100) 123(100) 182
History of previous eye illness
Present 10 (16.95) 14(11.38) 24
Absent 49 (83.05) 109 (88.62) 158
Total 59(100) 123(100) 182
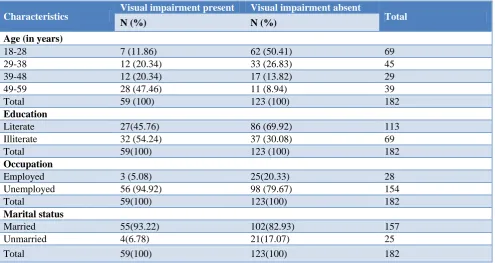
Visual impairment was maximum in women belonging to 49-59 years of age (71.8%) followed by 41.4% in 39-48 years age group (Table 7) and relationship was statistically significant. Among 59 persons with visual impairment, 46.4% were illiterate in contrast to 23.9% of literate subjects. Majority of them among the visually impaired, 56 (36.4%) women were unemployed. Among 59 with visual impairment majority of them; 32 (52.5%) belonged to lower socio-economic status and relationship was statistically significant (p=0.02).
Among 24 women with history of previous eye illness, 41.7% (10) were visually impaired and was statistical significance (p=0.01). In the study group there is a significant correlation between poor visual health & visual impairment and their socio-economic status, level of education and employment status (Table 7).
Visual impairment was higher among illiterates 32 (54.24%) as compared to literates 27 (45.76%) (Table 8). Majority of the women in the study belonged to the lower socioeconomic status, 32 (54.24%) as compared to the higher socioeconomic status (Table 8).
DISCUSSION
Blindness in India has been associated with the level of education, age and occupation.In the present study there were 59 (32.3%) with visual impairment out of which 2 were blind. In a similar study among 153 subjects, 49 (32%) were visually impaired out of which 3 (2%) were blind.10
In this study uncorrected refractive error was the most common cause for visual impairment followed by cataract. Similarly in a study of 411 patients, 47.4% had refractive error, followed by 10.5% with cataract.11 It is a known fact that increasing age is a common factor leading to visual impairment. In consistent with other studies, visual impairment was highest in age group of 49-59 years among 28 (47.46%) in this study.8,12-14
In a study, visual impairment was highest among above
visual impairment was higher (9.87%) in females than males (6.98%), four times more in illiterates than those beyond Grade 10 and in those not engaged in any work had twice higher risk compared to those actively working.6 Like in previous studies, in this study too education and poverty had an influence on visual impairment.8,14,15 Visual impairment was found to be maximum among 49-59 years of age 28 (47.46%), illiterate 32 (54.24%) and in lower socio-economic status 32 (54.24%) in this study.
The global eye health action plan under the Universal Eye Health: a Global Action Plan 2014-2019, encompasses integration of eye care programmes into the wider health care system at all levels (primary, secondary, and tertiary) with a target of reducing avoidable visual impairment by 25% by 2019.16 To attain this global target it may be appropriate to plan strategies to provide comprehensive eye services along with general health services.
CONCLUSION
accessible, affordable and available at all levels (primary, secondary and tertiary) of health system irrespective of gender, literacy, age and socioeconomic status to improve visual health and thus quality of life.
Funding: No funding sources Conflict of interest: None declared
Ethical approval: The study was approved by the Institutional Ethics Committee
REFERENCES
1. Blindness and vision impairment. WHO Key Facts. Available at: https://www.who.int/news-room/fact-sheets/detail/blindness-and-visual-impairment. Accessed on 3 June 2019.
2. National Programme for Control of Blindness & Visual Impairment (NPCBVI). Available at: http://npcbvi.gov.in/. Accessed on 3 June 2019. 3. Mariot SP. Global Data on Visual Impairments
2010. WHO; 2012:5.
4. Vignesh D, Gupta N, Kalaivani M, Goswami AK, Nongkynrih B, Gupta SK. Prevalence of visual impairment and its association with vision-related quality of life among elderly persons in a resettlement colony of Delhi. J Family Med Primary Care. 2019;8:1432-9.
5. Deshpande M. Vision 2020: Right to Sight – India. MJAFI. 2008;64:302-3.
6. Murthy GV, Gupta SK, Bachani D, Jose R, John N. Current estimates of blindness in India. Br J Ophthalmol. 2005;89(3):257–60.
7. Chauhan RC, Manikandan, Purty AJ, Samuel A, Singh Z. Determinants of health care seeking behavior among rural population of a coastal area in South India. IntJ Sci Rep. 2015;1(2):118-22. 8. Malhotra S, Vashist P, Kalaivani M, Gupta N,
Senjam SS, Rath R. Prevalence and causes of visual impairment amongst older adults in a rural area of North India: a cross sectional study. BMJ Open. 2018;8(3):e018894.
9. Mangione CM. Version 2000 The National Eye Institute 25-Item Visual Function Questionnaire (VFQ-25) NEI VFQ-25 Scoring Algorithm; 2000. 10. Sembiah S, Paul B, Dasgupta A, Biswas B, Ghosh
A, Manjula M. A Cross Sectional Study on Visual Health among Women aged 18-59 years residing in a Slum of Kolkata, West Bengal. Indian J Community Health. 2017;29(4):363-8.
11. Rao CR, Shetty RS, Narayanan SS, Kini S, Kamath V, Kamath A. Prevalence of visual impairment in adults aged 18 years and above in a rural area of coastal Karnataka. Int J Health Allied Sci. 2018;7(1):31-6.
12. Dineen B, Bourne RR, Jadoon Z, Shah SP, Khan M A, Foster A, et al. Causes of blindness and visual impairment in Pakistan. The Pakistan national blindness and visual impairment survey. Br J Ophthalmol. 2007;91:1005–10.
13. Kyari F, Gudlavalleti MVS, Sivsubramaniam S, Gilbert CE, Mohammed M. Prevalence of Blindness and Visual Impairment in Nigeria: The National Blindness and Visual Impairment Survey. IOVS. 2009;50(5):2033-9.
14. Marmamula S, Khanna RC, Rao GN. Unilateral visual impairment in rural south India-Andhra Pradesh Eye Disease Study (APEDS). Int J Ophthalmol. 2016;9:763–7.
15. Naidoo KS, Jaggernath J. Uncorrected refractive errors. Indian J Ophthalmol. 2012;60:432–7. 16. Universal Eye Health: a Global Action Plan 2014–
2019, WHO. Available at: https://www.who.int/ blindness/AP2014_19_English.pdf. Accessed on 3 June 2019.