Alert Correlation System with Automatic Extraction of
Attack Strategies by Using Dynamic Feature Weights
Chih-Hung Wang*, Ye-Chen Chiou
Department of Computer Science and Information Engineering, National Chiayi University, Chiayi, Taiwan.
* Corresponding author. Tel.: +886-5-2717736; email: [email protected] Manuscript submitted November 25, 2014; accepted June 2, 2015.
doi: 10.17706/ijcce.2016.5.1.1-10
Abstract: With the growth in popularity of the computer technology and Internet, new vulnerabilities of systems and unknown risks continuously increase. Some methods based on the known system environment have been unable to deal with the attacks generated by unknown vulnerabilities. Moreover, it is hard to find potential vulnerabilities for virtual machines generated by the server in the cloud environment. Therefore, it is very important to automatically extract attack strategies in the alert correlation system.
In this paper, we proposed an alert correlation system with automatic extraction of attack strategies. We estimate the correlation cell value between two alerts by using equality constraints sets (ECS) and records them in the alert correlation matrix (ACM). Our system does not need to create the predefined knowledge base and training data. Moreover, our system also needs not to reestablish the modules due to the different environments. We extract the attack scenarios from attackers by observing the connectivity and relationship among the receiving alerts.
Key words: Alert correlation, attack graph, intrusion detection, cloud computing, network security.
1.
Introduction
The attacker would interrupt the service or steal information and assets for some purposes. It is not enough to safeguard the system by only use of a firewall and/or an anti-virus software tool. Therefore, the intrusion detection system (IDS) would be additionally used to monitor system environment and detect network threats. The IDS raises the alerts when it finds out the suspicious behavior or abnormal conditions in the system. Network administrator can analyze these alerts and deal with the security and network situations.
However, the attacks on the network become more and more complicated. There needs to be done multiple steps to finish a full attack. Therefore, viewing a single alert alone cannot retrieve the useful attack strategy. Moreover, the alerts generated by IDS are usually massive, but most of them are false alerts; i.e., they may be generated by normal behaviors. These false alerts will obstruct the analysis of the security situation for the administrator. In order to reduce the false alerts and help the administrator to obtain useful information about security situation, alert correlation technology has been developed to handle a huge number of low-level alerts and extract the relative information to construct the attack scenarios for the system environment.
analyze the relevance between alerts in order to obtain the useful information from a great number of alerts. Finally, the post-processing uses the information for further processing, such as showing the attack strategies of the intrusion or the causality between alerts.
In the past few years, there are many different alert correlation techniques have been proposed. The aim of most alert correlation methods are creating a high-level graph so that it can provide the network administrator much useful information to reduce his effort on observing a lot of low-level alerts. According to different result graphs, alert correlation methods are divided into status-based graph [1], host-based graph [2], [3], multistage–based graph [4] and alert-type-based graph [5], [6]. Several alert correlation methods build the attack graph with the known network topologies and known vulnerabilities [7]. Although this kind of method is fast and accurate, it cannot extract the attack scenarios with unknown vulnerabilities. The statistic-based method [8] correlates alerts by observing and analyzing the relationship of the past alerts. This way can detect the attack with unknown vulnerabilities. Zhu and Ghorbani proposed the Alert Correlation Matrix [5] to store the alert correlation probability. Their system calculates the correlation strength from Alert Correlation Matrix; however, this method needs to spend a lot of effort to label the training data in order to generate the alert correlation probabilities.
Therefore, this paper presents a novel alert correlation method which can extract the attack scenarios without extra efforts of labeling training data. Moreover, we used dynamic feature weights to handle different type of alerts. The rest of the paper is organized as follows. The related works of the alert correlation method are described in Section 2. In Section 3, we present an automatic alert correlation method without preparing knowledge base and training data. Section 4 shows the experimental results of our approach and finally we give the concluding remarks for this paper in Section 5.
2.
Related Work
2.1.
Alert Correlation with Knowledge Base
Ning et al. proposed Hyper-Alert Type architectures [9], [10] to represent the state of the system and replace the low-level alerts. Their method used the predefined prerequisites and consequences of the alerts to aggregate low-level alerts and generate a detailed attack scenario. However, the method based on known knowledge cannot correlate the alerts for unknown attacks. Moreover, the network manager is required for professional knowledge and expert experience for the environment to build lots of rules.
2.2.
Alert Correlation Based on Neural Network
This kind of method calculates the similarity values among alerts and aggregates similar alerts to eliminate duplicate low-level alerts. The features of alerts include: source IP address, destination IP address, source port, destination port, alert time stamp and so on. After calculating the similarity, the relationship of alerts can be realized. Compared to the knowledge base method, the system can retrieve DDoS attacks though the analysis of the similarity of IP addresses.
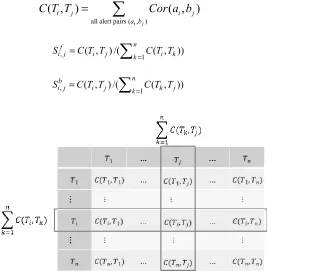
Zhu and Ghorbani proposed a mechanism of Alert Correlation Matrix (ACM) [5] to store the past correlation experience. Their system calculates the correlation probability between two alerts by using both techniques of multilayer perceptron (MLP) and support vector machine (SVM), and then adds the correlation probabilities into Alert Correlation Matrix. If two types of alerts are correlated, the correlation probability value will be added to the corresponding cell in ACM. The ACM is shown in Fig. 1. In Fig. 1, n represents the total number of types of alerts, and Ti denotes the type i of the alert. C(Ti,Tj) denotes the ACM cell value on the ordered pair (Ti,Tj) that means the alert of type Ti followed by the alert of type Tj.
However, their method needs to appropriately prepare MLP and SVM labeled training data in advance. The alert correlation probability is calculated by mapping features of two alerts on the result table built by MLP and SVM. In their work, the system administrator is required for professional knowledge for the environment and spends a lot of time to build the result tables. Therefore, we proposed a new method to calculate the alert correlation probability according to the past collected alerts instead of the training results from MLP and SVM. Compared to the original labeled training methods, using the calculation method is easier and reducing costs.
2.3.
Alert Correlation Based on Bayesian Networks
Kavousi and Akbari proposed a method using past alerts to get information, and used the prior knowledge to assist Bayesian network to correlate alerts [6]. Therefore, this method does not require predefined knowledge base. Alert Correlation Engine has two components; the first is an offline component, using Bayesian causal analysis from the past alerts to learn multi-step attack behavior patterns periodically. The second one is an online component, using hierarchical approach to correlate alerts in real time based on the behavior model extracted from the offline component. In order to find the possible causal relationship between the types of alerts, Kavousi and Akbari also proposed the Equality Constraint Sets (ECS) to extract the connection relationship between two types of alerts. The ECS between Ti and Tj is shown as the following equation:
(
Tj ECS Ti)
Nijc NiP , | = / , (1)
where Ni is the number of alerts with type Ti. Nijc represents the number of times that the two alerts of types Ti and Tj satisfies the following three conditions. First, the type Ti alert and the type Tj alert are in the same time window. Second, the type Ti alert is followed by the type Tj alert. Third, the two alerts must satisfy at least one of the equality constraints. The equality constraints of two types of alerts are listed in Table 1.
Table 1. List of Equality Constraints [6]
Equality Constraints
1
EC Equality of source IP addresses (SrcIP = SrcIP)
2
EC Equality of destination IP addresses (DestIP = DestIP)
3
EC Equality of source port numbers (SrcPort = SrcPort)
4
EC Equality of destination port numbers (DestPort = DestPort)
5
EC Alerts IP chain (DestIP = SrcIP)
6
EC Reverse IP chain (SrcIP = DestIP)
In order to extract the corresponding ECS, the system needs to look for every possible existence of a causal relationship between the types of alerts by finding the relationship between P(Tj,{ec}|Ti) and
constraint between Ti and Tj. If the value is equal to P(Tj), it indicates that ec is an irrelevant influence equality constraint between Ti and Tj. If the value is less than P(Tj), it indicates that ec is a negative influence equality constraint between Ti and Tj.
Therefore, the relevance of specific equality constraints with positive influence of ordered pairs (Ti, Tj) are selected for further usage.
3.
Proposed Alert Correlation Method
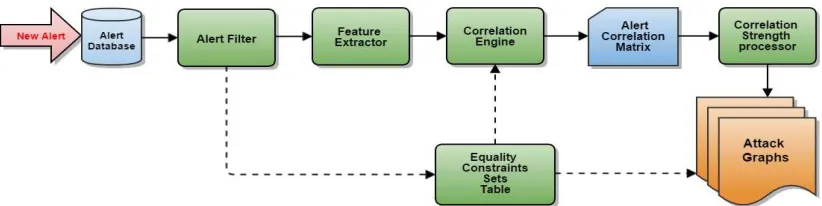
The process of the proposed alert correlation method is shown in Fig. 2. While the intrusion detection system found suspicious behavior packets, it will raise a new alert and store the alert in the alert database. Alert Filter deletes the duplicate alerts in the alert database. The feature extractor extracts the feature between the new alert and old alerts. The system calculates the ECS of ordered pairs (Ti, Tj) and stored the ECS in the Equality Constraint sets Table. Correlation Engine chooses different weights based on different ECSs of (Ti, Tj), then calculates the correlation cell value between the new alert and old alerts by using different weights. The correlation cell value will be added to the corresponding cell of alert correlation matrix (ACM). The system generates a plurality of attack graphs based on ACM.
The Attack Graphs can be used to model the system vulnerabilities and formulate the attack scenario which occurs in the system. We will describe each component and calculation method in the following. The solid lines represent the main process for the alert correlation and the dashed lines represent the reference information for calculating.
Fig. 2. The process of the proposed method.
3.1.
Alert Filter
Duplicate alerts are possibly generated from suspicious behaviors from the attacker. The suspicious behavior usually contains many similar packets and may trigger the alerts repeatedly. We remove the duplicate alerts if the alerts have the same Source IP, Destination IP, Source Port, Destination Port, Signature ID and very close timestamps. By carrying out this procedure, the alert correlation system can be more accurate and efficient.
3.2.
Equality Constraint Sets Table
There may be a certain causal relationship between (Ti, Tj). We extract the equality constraints between (Ti, Tj). The equality constraint indicates the relationship of the attribute values of two alerts. After the calculation of the equality constraint on the alert type pair (Ti, Tj) as mentioned in Section 2.3, the positive influences equality constraint will be added to the Equality Constraint Sets. The Equality Constraint Sets will be used to calculate the alert correlation cell values and assist in generating the attack graph.
3.3.
Feature Extractor
relationship between alerts. The symbols a and b denote two different alerts.
F1 indicates the similarity of the source IP address between two alerts. The value of F1 is between 0 and 1. When the source IP of the alert is very close to another, the alert might be generated from the same attacker who changed the IP address. The method for calculating the IP address similarity is converting IP address into a binary. There is a total of 32 bits. n is the number of counting the same bit from left. IP
address similarity S(ipa,ipb)=n/32 . For example, suppose that ipa =192.168.0.1 and
101 . 0 . 168 . 192 = b
ip , ipa can be written as 11000000101010000000000000000001 and ipb can be
written as 11000000101010000000000100101101. Then n = 23, so that S(ipi,ipj)=23/32. F2 indicates
the similarity of the destination IP address between two alerts. The value of F2 is between 0 and 1. When the destination IP of the alert is very close to another, it means the hosts located in same subnet might be attacked. The method for calculating is the same as F1. F3 indicates whether the source Port number of two alerts are the same. The value of F3 is either 0 or 1. The same port number means the same service. F4 indicates whether the destination Port number of two alerts are the same. The value of F4 is either 0 or 1. F5 represents the forward IP link relation between a and b. F5 indicates whether the source IP address of the new alert is equal to the destination IP address of the old alert. The value of F5 is either 0 or 1. If (a, b) satisfies F5, it represents that the host becomes a victim to be taken as the springboard for the attacker to invade other hosts. F6 represents the reverse IP link relation between a and b. F6 indicates whether the destination IP address of the new alert is equal to the source IP address of the old alert. The value of F6 is either 0 or 1. If (a, b) satisfies F6, it represents the attacker may successfully obtain the privileges of a host. If (a, b) satisfies both F5 and F6, it may represent there are two hosts send messages to each other.
F7 indicates whether the time interval of (a, b) is less than the threshold. The value of F7 is either 0 or 1. When many alerts occur intensive, it may represent the system under attack in this moment. Moreover, the attack will be accompanied by multiple alerts occurring together. F8 indicates the probability of ECS
between the alert type Ti and alert type Tj. The formula of F8 can be written as P
(
Tj,ECS |Ti)
= Nijc /Ni.3.4.
Correlation Engine
The Correlation Engine calculates the correlation cell value between the new alert Tj and the previous alerts Ti in a certain timestamp. Correlation Engine chooses different feature weights with the different ECSs between (Ti, Tj). We design a variety of different feature weight combinations for six kinds of equality constraints. (We only shows three feature weight combinations as the examples in Table 2.) For (Ti, Tj), if
ECS = {EC2}, we select weight-(a) to calculate the correlation cell value of (Ti, Tj). Similarly, if ECS = {EC1,
2
EC , EC3, EC4}, we select weight-(b) to calculate the correlation cell value of (Ti, Tj). In Table 2,
weight-(a) shows the weight assignment for the alert pair which satisfies equality constraint EC2. We
increase the weights of destination IP (F2) and port (F4) in this case of combination. For example, considering the DDoS attack is the target being attacked from many different hosts. Therefore, the weight combination of the DDoS attack can be suitable for weight-(a). Moreover, we increase the weights of F5 and
F6 in the weight-(c). Considering an attacker launches the remote root access to the victim host, this situation satisfies EC5 and EC6 . Hence, we choose weight-(c) combination. Through the equality
constraint sets of the alert pair, our system can find the corresponding feature weight combination, and then precisely calculates the correlation cell value. The main formula to calculate the correlation cell value is written as:
1
( ,i j) n kFeature ( ,k i j)
k
Featurek(ai, bj) denotes the k-th feature values on the old alert a of type Ti and the new alert b of type Tj.
k
α denotes the weight of k-th feature, and the total of the weights equals to 1.
Table 2. The Feature Weight Combinations Feature Weight-(a) Weight-(b) Weight-(c)
F1 0.02 0.16 0.02
F2 0.26 0.16 0.02
F3 0.02 0.12 0.02
F4 0.26 0.12 0.02
F5 0.02 0.02 0.26
F6 0.02 0.02 0.26
F7 0.2 0.2 0.2
F8 0.2 0.2 0.2
Weight-(a) is applied if ECS = {EC2,EC4}
Weight-(b) is applied if ECS = {EC1,EC2,EC3,EC4}
Weight-(c) is applied if ECS = {EC5,EC6}
If the cell value in ACM is larger, the relationship of the corresponding two alert types may be stronger. We use Forward Correlation Strength and Backward Correlation Strength to find out which previous alerts should be, with high possibility, correlated to the current one.
3.5.
Correlation Strength Processor
Alert correlation probabilities Cor(ai,bj) are added to the cell value C(Ti,Tj) in the Alert Correlation
Matrix. The calculation of C(Ti,Tj) in ACM is to sum up all correlation probabilities of alert pairs with type
Ti and type Tj, as in (1). Forward Correlation Strength Si,fj can find out which incoming alerts the current
alert should correlate to. The calculation of f j i
S, is the normalization of the horizontal cells in ACM. On the
other hand, Backward Correlation Strength b j i
S, can find out which past alerts should be correlated with
the current alert. The calculation of b j i
S, is the normalization of the vertical cells in ACM [5] (see Fig. 3).
all alert pairs ( , )
( ,
)
( ,
)
i j
i j i j
a b
C T T
=
∑
Cor a b
(3)) ) , ( /( ) , ( 1 , =
∑
= nk i k
j i f
j
i C T T CT T
S (4)
) ) , ( /( ) , ( 1 , =
∑
= nk k j
j i b
j
i C T T C T T
S (5)
After obtaining the Forward Correlation Strength and the Backward Correlation Strength, the system can learn the causal relationship between the types of alerts. The alert graph builder uses the causal relationship to generate the alert graph. The alert graph shows an attack scenario extracted from the alert database.
4.
Experiment
In order to implement our proposed approach, we use the DARPA 2000 dataset [11]. DARPA2000 is an often used dataset to evaluate the detection technique and system. There are two multistage attack scenarios in DARPA 2000: LLDOS 1.0 and LLDOS 2.02.
LLDOS 1.0 contains DoS attacks with five steps. The first step is scanning multiple subnets. The second step is to find out the Solaris host which runs the sadmind daemon by pinging. The third step is to exploit the sadmind vulnerability. The fourth step is to install the DDoS software: mstream. The final step is lunching the DDoS attack.
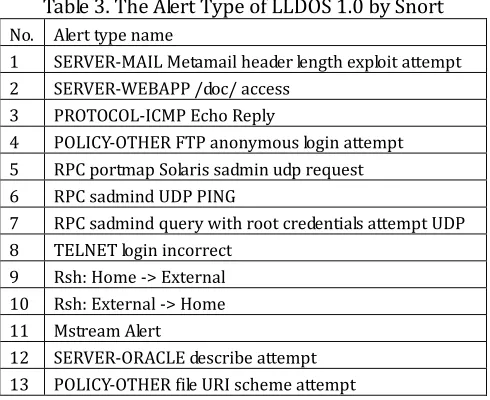
Table 3. The Alert Type of LLDOS 1.0 by Snort No. Alert type name
1 SERVER-MAIL Metamail header length exploit attempt 2 SERVER-WEBAPP /doc/ access
3 PROTOCOL-ICMP Echo Reply
4 POLICY-OTHER FTP anonymous login attempt 5 RPC portmap Solaris sadmin udp request
6 RPC sadmind UDP PING
7 RPC sadmind query with root credentials attempt UDP 8 TELNET login incorrect
9 Rsh: Home -> External 10 Rsh: External -> Home 11 Mstream Alert
12 SERVER-ORACLE describe attempt 13 POLICY-OTHER file URI scheme attempt
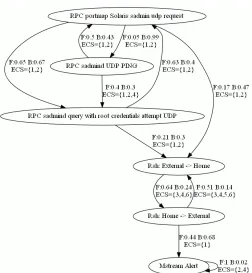
DARPA 2000 contains many network packets, and we used Snort, a well-known open source IDS, to analyze LLDOS 1.0 packets and generate the alerts. Snort raises 429 alerts from LLDOS 1.0, and in them, 228 alerts are filtered by our system. Table 3 shows 13 types of alerts generated by Snort for LLDOS 1.0. Fig. 4 shows the attack scenarios extracted from our experiments in LLDOS 1.0 by using the proposed correlation method. Compared with the original five attacking steps in LLDOS 1.0, the output graph can be consistent with them and clearly illustrates the attack strategy. The alert types are located in the oval shape. “RPC portmap Solaris sadmind udp request” indicates a request used portmap to discover the port which Remote Procedure Call (RPC) sadmind is listening. “RPC sadmind UDP PING” indicates a Solaris sadmind buffer overflow vulnerability (CVE-1999-0977). “RPC sadmind query with root credentials attempt UDP” indicates an attempt is made to exploit a known vulnerability with the RPC sadmind in order to carry out remote root access. “Rsh: Home -> External” and “Rsh: External -> Home” indicate the administrative remote access by Rsh. “Mstream Alert” indicates launching the DDoS.
attack graph.
Fig. 4. The attack graph of LLDOS 1.0 generated by our proposed system.
Table 4. The Cell Value in ACM of Our Proposed System
1 2 3 4 5 6 7 8 9 10 11 12 13 1 241.64 0.71 0.72 31.09 0 0 0 0 0 0 0 0 0
2 21.19 0 1.99 27.55 7.29 0 0 0 0 0 0 0 0
3 142.66 0 3 8.46 0 0 0 0 0 0 0 0 0
4 188.43 0 0 7.13 2.05 0 0 0 0 0 0 0 0
5 0 0 0 0 19.57 9.17 125.54 0 5.04 33.55 0.24 0 0
6 2.76 0 0 0 70.21 0.13 55.7 0 5.19 6.5 0.42 0 0
7 3.64 0 0 0 65.83 0 7.1 0 5.46 21.36 0.56 0 0
8 0 0 0 0 0 0 0 0 0 0 0 0 0
9 0 0 0 0 0 0 0 0 0.98 9.97 8.66 0 0
10 0 0 0 0 0 0 0 0 5.26 0.37 2.61 0 0
11 0 0 0 0 0 0 0 0 0 0 0.29 0 0
12 27.95 0 0 0 0 0 0 0 0 0 0 0.5 0
13 0 0 0 1.2 0 0 0 0 0 0 0 0 0
Table 5. The Forward Correlation Strength of Our Proposed System
1 2 3 4 5 6 7 8 9 10 11 12 13 1 0.88 0 0 0.11 0 0 0 0 0 0 0 0 0
2 0.37 0 0.03 0.47 0.13 0 0 0 0 0 0 0 0
3 0.94 0 3 0.06 0 0 0 0 0 0 0 0 0
4 0.95 0 0 0.04 0.01 0 0 0 0 0 0 0 0
5 0 0 0 0 0.1 0.05 0.65 0 0.03 0.17 0 0 0
6 0.02 0 0 0 0.5 0 0.4 0 0.04 0.05 0 0 0
7 0.04 0 0 0 0.63 0 0.07 0 0.05 0.21 0.01 0 0
8 0 0 0 0 0 0 0 0 0 0 0 0 0
9 0 0 0 0 0 0 0 0 0.05 0.51 0.44 0 0
10 0 0 0 0 0 0 0 0 0.64 0.04 0.32 0 0
11 0 0 0 0 0 0 0 0 0 0 1 0 0
12 0.98 0 0 0 0 0 0 0 0 0 0 0.02 0
5.
Conclusion
This paper presents an alert correlation system with automatic extraction of attack strategies. By analyzing the Equality Constraints Sets (ECS) between two alert types to calculate the correlation cell value, our method does not require expert knowledge and training data. Through incrementally updating the Alert Correlation Matrix (ACM), we obtain the causal relationship between two alert types. The result of our experiment provides precise attack scenarios from the attacker and clear connection relationship between two alert types.
In the Future work, we are planning to solve an inborn problem of ACM. The problem is some attacks might often happen in the past. However, even though the vulnerabilities of these attacks have been fixed and the alerts of such attacks no more appear, the corresponding cell values stored in ACM are still large. Therefore, we will design a new method to improve it in the future.
Acknowledgment
This work was supported in part by the Ministry of Science and Technology of Taiwan under the Grant MOST 103-2221-E-415-011.
References
[1] Zhang, S., Li, J., Chen, X., & Fan, L. (Oct. 2008). Building network attack graph for alert causal correlation.
Journal of Computers & Security,27(5–6), 188-196.
[2] Liu, Z. M., Li, S., He, J., Xie, D., & Deng, Z. T., (Dec. 2012). Complex network security analysis based on attack graph model. Proceedings of Second International Conference on Instrumentation, Measurement,
Computer, Communication and Control (IMCCC) (pp. 183-186).
[3] Lagzian, S., Amiri, F., Enayati, A., & Gharaee, H. (Nov. 2012). Frequent item set mining-based alert correlation for extracting multi-stage attack scenarios. Proceedings of Sixth International Symposium on
Telecommunications (IST) (pp. 1010-1014).
[4] Xie, A., Chen, G., Wang, Y., Chen, Z., & Hu, J. (July 2009). A new method to generate attack graphs.
Proceedings of Third IEEE International Conference on Secure Software Integration and Reliability
Improvement (SSIRI) (pp. 401-406).
[5] Zhu, B., & Ghorbani, A. A. (Nov. 2006). Alert correlation for extracting attack strategies. International
Journal of Network Security, 3(3), 244-258.
[6] Kavousi, F., & Akbari, B. (Nov. 2012). Automatic learning of attack behavior patterns using Bayesian networks. Proceedings ofSixthInternational Symposium on Telecommunications (IST) (pp. 999-1004). [7] Ou, X., Govindavajhala, S., & Appel, A. W. (2005). MulVAL: A logic-based network security analyzer.
Proceedings of14th USENIX Security Symposium (pp. 113-128).
[8] Marchetti, M., Colajanni, M., & Manganiello, F. (Sep. 2011). Identification of correlated network intrusion alerts. Proceedings ofThird International Workshop on Cyberspace Safety and Security (CSS), (pp. 15-20).
[9] Ning, P., Cui, Y., & Reeves, D. S. (Nov. 2002). Constructing attack scenarios through correlation of intrusion alerts. Proceedings of the 9th ACM conference on Computer and Communication Security (pp. 245-254). New York, USA: ACM Press.
[10]Ning, P., Cui, Y., Reeves, D. S., & Xu, D. (May 2004). Techniques and tools for analyzing intrusion alerts.
Journal of ACM Transactions on Information and System Security (TISSEC), 7(2), 274-318.
[11]MIT Lincoln Laboratory. (2000). DARPA intrusion detection evaluation datasets. Retrieved November
10, 2014, from the MIT Lincoln laboratory website:
Chih-Hung Wang was born in Kaohsiung, Taiwan in 1968. He received the BS degree in information science from Tunghi University and MS degree in information engineering from National Chung Cheng University, Taiwan in 1991 and 1993, respectively. He received the Ph.D. degree in information engineering from National Cheng Kung University, Taiwan in 1998. He is presently an associate professor at the Department of Computer Science and Information Engineering, National Chiayi University, Taiwan. His research interests include cryptography, information security and data compression.
![Fig. 1. Alert correlation matrix [5].](https://thumb-us.123doks.com/thumbv2/123dok_us/1312054.1638840/2.595.176.431.638.745/fig-alert-correlation-matrix.webp)
![Table 1. List of Equality Constraints [6]](https://thumb-us.123doks.com/thumbv2/123dok_us/1312054.1638840/3.595.161.437.593.703/table-list-equality-constraints.webp)