Measuring the Informal Economy in Egypt
Hany M.Elshamy
Associate Professor of Economics, Economics Department, Faculty of Commerce,
Tanta University, Egypt, Abstract
This paper estimates the size of the informal economy in Egypt for the period 1980-2012, using a structural equation modeling approach; I find that a stringent tax system and higher inflation, and dominance of the agriculture sector are key factors in determining the size of the informal economy, representing altogether around 72 percent of the informal economy variance. The results also confirm that a higher degree of informality reduces the number of contributors to social security schemes, and enrollment rates in education. The size of the informal economy in Egypt has been increased over the time. The average annual growth rate for the size of informal economy in Egypt was around 1%for the period 1980-2012.This paper has important policy implications for authorities striving to reduce the degree of informality. For instance, in countries where the informal economy is related to a high tax burden, policy options include lowering and homogenizing effective tax rates across all sectors in the economy.
Keywords: Informal Economy, MIMIC, Egypt JEL Classification: C30, E26, J3, J51, O5, O17
1.
INTRODUCTIONInformality is a matter of concern among policymakers and the business community throughout the world. Impacts on productivity and growth, losses in fiscal revenues, and equity issues related to the existence of unprotected workers lacking health insurance and pension protection are important concerns associated with a significant share of the labor force operating informally (Angel‐Urdinola&Tanabe, 2012).
The informal economy comprises those economic activities that circumvent the costs and are excluded from the benefits and rights incorporated in the laws and administrative rules covering property relationships, commercial licensing, labor contracts, torts, financial credit and social systems (Vuletin, 2008).
Measuring the size of the informal economy is important for many reasons. First, there seems to be strong evidence that suggests a direct and clear link between the size of the informal economy and tax evasion. Second, the informal economy, as a job provider, has an impact on the viability of social security institutions, specifically in terms of the latter’s ability to provide protection while receiving enough financial support. Third, inaccurate perceptions about the actual size of an economy could seriously decrease the effectiveness of a wide variety of policies.
This paper estimates the size of the informal economy and the relative contribution of each underlying factor, in Egypt for the period 1980-2012. For this purpose, a structural equation model approach that considers the informal economy as a latent variable with multiple causes and indicators is used.
The organization of the rest of this paper will be as follows; section 2 presents some studies about the informal economy in Egypt. Methodology will be presented in section 3. Section 4 introduces data.Section five and six discuss the results. Conclusions are shown in section 7.
2.
INFORMAL ECONOMY IN EGYPTAll the studies agreed on the large size of the Egyptian informal market which has grown fast over the last decades, but this sector was often ignored. However, more recently with the start of the Arab spring after the Tunisian vendor "`Mohamed Bouazizi"' set himself on _re, the experience of informal workers came under the media spot. With the future elections coming and the replacement of Hosni Moubarak's government, new labor laws could take place. It is very important for the people who will be in charge to make the necessary change in labor regulations and tax regulations that can encourage employers and employees to start working on a formal basis (Rawaa, 2012).
The limited literature on the informal sector in Egypt has focused on measuring the size of the informal sector and trying to understand its characteristics, see for example, El Mahdi (2000).
El Mahdi (2000) investigated the changing role of the informal sector in providing work opportunities to the growing labor force in Egypt in the late 90s. One of the main issues of concern was whether, and the extent to
which, workers have become informalised during the period of reform.
For example, in an earlier study, Moktar & Wahba & (2000) attempted to measure the degree of informality in the Egyptian labor market and found that the proportion of non-agricultural workers (over 18 years old) engaged in informal jobs — whether measured as a lack of job contract or social security coverage — has increased by 5 to 6 percentage points in the 1990s. They also found that new entrants to the labor market in the 90s have been drawn into informal employment.
Schneider (2002) measured the informal economy in 110 countries and he found that the size of the informal economy in Egypt (in percent of GDP) was 35.1% for the years 1999/2000.
International Labor Organization (ILO) ( 2012) ,argued that the percentage of employment in informal economy in non-agricultural activities in Egypt was around 51.2% in 2011.
3.
METHODOLOGYBy definition, the underground (informal) economy cannot be directly observed so its magnitudes have to be estimated (Breusch, 2005).
Many alternative methods have been used to measure the size of the informal economy. Some approaches use direct methods based on surveys, but most studies use indirect methods based on:
(a) the discrepancy between national expenditure and income statistics; (b) the discrepancy between the official and actual labor force;
(c) the “electricity consumption” approach of Kauffman and Kaliberda (1996); (d) the “monetary transaction” approach of Feige (1979);
(e) the “currency demand” approach of Cagan (1958) and others; and
(f) the “Multiple Indicators, Multiple Causes” (MIMIC) approach of Frey and Weck-Hanneman (1984).
The methodology in this paper uses Multiple Indicators, Multiple Causes (MIMIC) approach. All methods
consider only one indicator or manifestation of the informal economy, e.g., electricity consumption, money or cash demand. However, there often exist several manifestations or symptoms showing up simultaneously. The MIMIC approach explicitly considers several causes, as well as the multiple effects of the informal economy. The methodology makes use of the associations between the observable causes and the observable effects of an unobserved variable, in this case the informal economy, to estimate the unobserved factor itself (Loayza, 1997).
The model for one latent variable can be described as follows:
𝑦=𝛼𝐼𝐸+𝜀 (1)
𝐼𝐸=𝛽′𝑥+𝑢 (2)
Where IE is the unobservable scalar latent variable (the size of the informal economy),𝑦′= (𝑦1,……..,𝑦𝑝 ) is a vector of indicators for IE ,𝑥′= (𝑥1,……..,𝑥𝑝 ) is a vector of causes of IE , αand βare the (px1) and (qx1) vectors of the parameters and ε and u are the (px1) and scalar errors.
Equation (1) links the informal economy with its observable, exogenous indicators or symptoms, while equation (2) associates the informal economy with a set of observable, exogenous causes.
Assuming that these errors are normally distributed and mutually
uncorrelated with var(u)= 𝜎𝑢2 and cov(ε) =𝜃𝜀, the model can be solved for the reduced form as a function of observable variables by combining equations (1) and (2):
𝑦=𝜋𝑥+𝜔 (3)
where𝜋=𝛼𝛽′ ,𝜔=𝛼𝑢+𝜀and cov(𝜔) =𝛼𝛼′𝜎𝑢2+𝜃𝜀
Because y and x are observable data vectors, equation (3) can be estimated by maximum likelihood estimation
using the restrictions implied in both the coefficient matrix𝜋and the covariance matrix of the error𝜔. Since the reduced form parameters of equation (3) remain unaltered when αis multiplied by a scalar and βand 𝜎𝑢2
are divided by the same scalar, the estimation of equations (1) and (2) requires a normalization of the parameters in equation (1), and a convenient way to achieve this is to constrain one element of αto some pre-assigned value.
Since the estimation of αand βis obtained by constraining one element of αto some arbitrary value, it is useful to standardize the regression coefficients 𝛼� and 𝛽̂as follows:
𝛼�𝑠=𝛼� �𝜎�𝐼𝐸
𝜎�𝑦� 𝛽̂
𝑠=𝛽� �𝜎�𝑥
𝜎�𝐼𝐸�
The standardized coefficient measures the expected change (in standard-deviation units) of the dependent variable due to a one standard-deviation change of the given explanatory variable, when the other variables are held constant. Using the estimates of the𝛽𝑠vector and setting the error term u to its mean value of zero, the
information regarding the specific value of informal activity for Egypt or for some point in time, obtained from some other source, the ordinal within-sample predictions for IE can be converted into absolute series.
The MIMIC approach is chosen as the most appropriate method to calculate the size of the informal economy for Egypt because of the following reasons:
1- Tax auditing and other similar survey-based methods are unavailable for Egypt.
2- The methods based on statistical and labor force discrepancies present, as described before, serious limitations and weaknesses.
3- Aside from the above-mentioned critiques, the electricity, transaction, and currency demand approaches share a common crucial limitation. Since the three approaches are based on time series regressions, extra information12 for each country is required in order
This paper only focuses on real cause and indicator variables, as opposed to monetary ones, which might underestimate and misrepresent the relevance of the informal economy in countries subject to a high degree of dollarization in circulating currency.
4.
DATAThis paper depends on the data from the International Financial Statistics (IFS) published by the IMF, World Development indicators and the Ministry of Planning in Egypt for the period 1980-2012. According to this paper, there are two different kinds of variables: cause variables and indicator variables. Both of these two kinds will be explained as follows:
4.1 Cause Variables
Following Vuletin (2008), there are three cause variables; first, the tax burden is proxied by the average of corporate and personal marginal income tax rate. The hypothesis is that an increase of the tax burden boosts the incentive to work in the informal economy.
Second, the importance of agriculture in the Egyptian economy is included, since many studies endorse the
idea that informal work is highly segmented by sector, with clear prevalence for the agricultural and related sectors. One of the most important reasons for this is the minimum enforcement capacity of government prevalent in rural areas. The importance of agriculture measured as agriculture and food output as a percentage of GDP. The more prominent the agriculture sector, the larger the expected size of the informal economy.
Third, following Giles (1999) the inflation rate is included to allow for the upward “creep” of tax brackets, and the associated incentive for taxpayers to engage in informal activities. A more pervasive effect of inflation is that, as it tends to be uneven across sectors, it alters the income distribution, and this may induce disrespect for tax law. The higher inflation, the larger the expected size of the informal economy.
4.2 Indicator Variables
Following Vuletin (2008)), there are two indicator variables; First, the percentage of the labor force contributing to the social security system is included. The larger the informal economy, the lower the expected number of contributors to the social security system.
Second, the gross enrollment ratio for secondary school is included as an informal economy indicator, however,
one of the most well-recognized consequences of the informal economy is related to child labor and the effect it has on rates of education enrollment. Thus, the larger the informal economy, the lower the expected enrollment rate.
5.
MIMICESTIMATION RESULTSTax burden, importance of agriculture, and inflation are the cause variables of the informal economy; while the
number of contributors to the social security system and the gross enrollment ratio for secondary school are the
indicator variables.
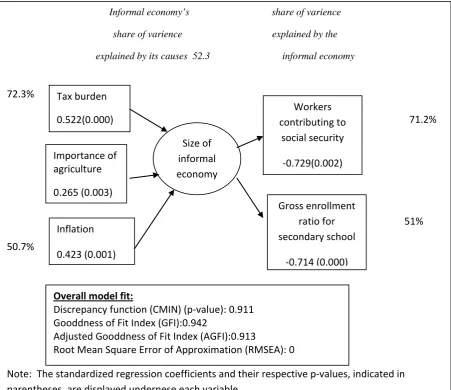
Before analyzing the estimation results, it is important to remark that several goodness-of-fit statistics support the underlying model (see box in Figure 1). These goodness-of-fit measures are based on fitting the model to sample moments, which means to compare the observed covariance matrix to the one estimated on the assumption that the model being tested is true.
The Discrepancy function (CMIN) is one of the most common fit tests, and is the minimum value of the discrepancy function between the sample covariance matrix and the estimated covariance matrix. The chi-square value should not be significant if there is a good model fit, while a significant chi-chi-square indicates lack of satisfactory model the goodness-of-fit index (GFI) and the adjusted goodness-of-fit index (AGFI) tests are also
measures of discrepancy between the predicted and observed covariances. The GFI can be interpreted as the percent of observed covariances explained by the covariances implied by the model. The AGFI is a variant of the GFI which adjusts GFI for degrees of freedom. By convention, both GFI and AGFI should by equal to or greater than 0.90 to accept the model. The root mean square error of approximation (RMSEA) is also a fit test that some authors argue is less sensitive to sample size than the above mentioned tests (see for example Fan et al. (1999)). By convention, there is good model fit if the RMSEA is less than or equal to 0.05.
The coefficients on the causal and indicator variables have the expected signs, and are statistically significant (mostly at the 1 percent level).
Specifically, a one standard deviation increase in the tax burden, importance of agriculture and inflation increase the size of the informal economy by 0.52, 0.42 and 0.27 standard deviations, respectively. Importantly, the joint influence of these four causal variables explains approximately 72 percent of the variance of the informal economy (Figure 1).
We find that increases in the informal economy reduce the number of workers contributing to the social security system and the secondary enrollment ratio, and explains 71 and 51 percent of their respective variances.
Figure 1 MIMIC Estimation Resul
Informal economy’s share of varience share of varience explained by the explained by its causes 52.3 informal economy
72.3%
71.2%
51%
50.7%
Note: The standardized regression coefficients and their respective p-values, indicated in parentheses, are displayed undernese each variable.
Note: All of these estimations are Author's calculations
Overall model fit:
Discrepancy function (CMIN) (p-value): 0.911 Gooddness of Fit Index (GFI):0.942
Adjusted Gooddness of Fit Index (AGFI):0.913
Root Mean Square Error of Approximation (RMSEA): 0 Tax burden
0.522(0.000)
Importance of agriculture
0.265 (0.003)
Inflation
0.423 (0.001)
Size of informal economy
Workers contributing to
social security
-0.729(0.002)
Gross enrollment ratio for secondary school
6.
ESTIMATION OF THE SIZE OF THE INFORMAL ECONOMYUsing the estimates of the MIMIC model, Table 1 shows the standardized ordinal values of the size of the
informal economy for Egypt.
As detailed above, the absolute values of the informal economy, unlike the ordinal measures, rely on extra
information pinning down the absolute value of the informal economy for one country Since the order of
countries according to the size of the informal economy is independent of this extra information but the Absolute
values of the informal economy do depend on this data, caution is advised regarding use of the latter values as accurate measures of the degree of informality.
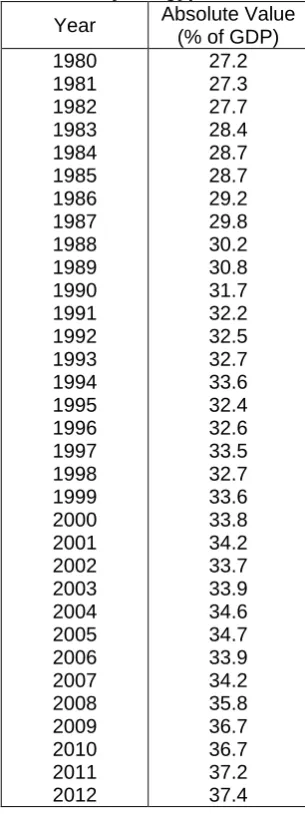
According to MIMIC model, the absolute size of the informal economy value (absolute values as a percentage of GDP) are shown in table 1.
As shown in table 1 the size of the informal economy has been increased over the time. The increase of the unemployment rate from 5% in 1980 to 12% in 2012 was the most important reasons behind the increase of the size of the informal economy size in Egypt for the period 1980-2012. Moreover, the volume of the informal economy activities has notably increased after the 25 January Revolution as a result of the absence of entities that monitor economic activities and increased insecurity.
The average annual growth rate for the size of informal economy in Egypt was around 1%for the period 1980-2012.
Table 1: Estimated Size of the Informal Economy in Egypt
Year Absolute Value
(% of GDP) 1980 1981 1982 1983 1984 1985 1986 1987 1988 1989 1990 1991 1992 1993 1994 1995 1996 1997 1998 1999 2000 2001 2002 2003 2004 2005 2006 2007 2008 2009 2010 2011 2012 27.2 27.3 27.7 28.4 28.7 28.7 29.2 29.8 30.2 30.8 31.7 32.2 32.5 32.7 33.6 32.4 32.6 33.5 32.7 33.6 33.8 34.2 33.7 33.9 34.6 34.7 33.9 34.2 35.8 36.7 36.7 37.2 37.4
Note: All of these estimations are Author's calculations
7.
CONCLUSIONSThis paper estimates the size of the informal economy in Egypt during the period 1980-2012, using a structural equation model approach that considers the informal economy as a latent variable with several causes and effects, I find that a burdensome tax system, higher inflation, and dominance of the agriculture sector are the key factors in determining the informal economy, representing altogether around 72 percent of the informal economy variance.
The results also confirm that a higher degree of informality reduces the number of contributors to social security schemes, and enrollment rates in education.
The size of the informal economy differs considerably across time. The average annual growth rate for the size of informal economy in Egypt was around 1%for the period 1980-2012.
The above analysis has important policy implications for authorities striving to reduce the degree of informality. For instance, in Egypt where the informal economy is related to a high tax burden, policy options include lowering and homogenizing effective tax rates across all sectors in the economy.
In countries where inflation is the key factor, priority should be given to tightening monetary policy and stabilizing prices.
REFERENCES
Angel‐Urdinola and Tanabe, 2012 , “Micro‐Determinants of Informal Employment in The Middle East and North Africa Region”, Social Protection and Labor Working Paper, SP/1201 (World Bank: Washington DC)
Breusch,T., 2005, “Estimating the Underground Economy using MIMIC Models,” Discussion Paper, School of Economics, Faculty of Economics and Commerce ,The Australian National University.
Cagan, P., 1958, “The Demand for Currency Relative to the Money Supply,” Journal of Political Economy, Vol. 66, pp. 302– 28.
El Mahdi, A., 2000, “The Labor Absorption Capacity of the Informal Sector in Egypt,” in Assaad, R. (ed.) The Labor Market in a Reforming Economy: Egypt in the 1990s, Ch. 3, Cairo: The American University in Cairo Press, 2002.
Fan, X., B. Thompson, and L. Wang, 1999, “Effects of Sample Size, Estimation Method, and Model Specification on Structural Equation Modeling Fit Indexes”, StructuralEquation Modeling, Vol. 6, pp. 56–83.
Feige, E., 1979, “How Big is the Irregular Economy?” Challenge, Vol. 22, pp. 5–13.
Frey, B., and H. Weck-Hanneman, 1984, “The Hidden Economy as ‘Unobserved Variable’,”European Economic Review, Vol. 26, pp. 33–53.
International Labor Organization (ILO), 2012, Statistical update on employment in the informal economy
Loayza, N., 1997, “The Economics of the Informal Sector: a Simple Model and Some Empirical Evidence from Latin America”, World Bank Policy Research Working Paper, WPS 1727 (World Bank: Washington DC).
McCormick, B. and J. Wahba, 2004, “Migration and Mobility in the Egyptian Labor Market,” , ERF Research Report No. 401, (ERF: Egypt)
Rawaa, H. 2012 “Heterogeneity in the Egyptian informal market,choice or obligation? ” Discussion Paper,
Schneider, F. “Size and Measurement of the Informal Economy in 110 countries around the world”, Discussion Paper Australian National Tax Centre, ANU, Canberra, Australia
Vuletin, G., 2008, “Measuring the Informal Economy in Latin America and the Caribbean”, International Monetary Fund Research Working Paper, WP/08/102 (IMF: Washington DC).