Original Research Article
Prevalence of lymphatic filariasis in a tribal area of Maharashtra
Vasant Ramraoji Lunge*
INTRODUCTION
Filariasis is of great public importance in India next only to malaria amongst the mosquito transmitted diseases. It continues to remain a major parasitic infestation in India. The disease is known for its acute manifestations as well as the sequelae producing considerable suffering to its victims. The number of cases of lymphatic filariasis (mostly caused by Wuchereria bancrofti) in India is greater than in any other country. In India, it is estimated that there are at least six million attacks of acute filarial disease per year and at least 15 million persons currently have one or more chronic filarial lesions.1
About 304 million persons are living in the known endemic areas and are exposed to the risk of filariasis. Of these about 222 million live in rural areas and 82 million in urban areas. A total of about 22 million persons are harboring microfilaria in their blood and about 16 million persons show clinical manifestations. In India, filariasis is mostly caused by Wuchereria bancrofti. Brugian filariasis has a localized and restricted distribution, mainly in the central part of Kerala due to the vector control measures with or without chemotherapy. Smaller foci of B. malayi infection are known to exist in Andhra Pradesh, Tamil Nadu, Assam, Odisha and Madhya Pradesh.2
ABSTRACT
Background: About 304 million persons are living in the known endemic areas and are exposed to the risk of filariasis. About 22 million persons are harboring microfilaria in their blood and 16 million persons show clinical manifestations. The objective of the study was to study the prevalence of lymphatic filariasis in a tribal area.
Methods: A community based cross sectional study was carried out. Night blood smears were obtained between 9-11.30 pm by finger prick method and thick smears were prepared and usual staining procedure was performed. 451 people out of (enumerated) 565 could be covered excluding infants. Diethyl carbamazine (DEC) provocative test was performed the next day by administering 100 mg DEC orally and collecting blood sample after one hour with usual method. DEC could be administered to only 200 individuals in spite of utmost efforts to ensure cooperation.
Results: Out of 451 persons examined, 20 (4.4%) were showing clinical manifestations. Overall microfilaria rate was 14.4%. Total endemicity rate was 17.3%. The lowest number of microfilaria was seen in 5 in 20 cumm of blood while the highest count was 78 in the 20 cumm of the blood. 13 smears (20%) showed that microfilaria count was in the range of 41-50. Maximum average infestation rate was 33.3 per 20 cumm of the blood. The most prominent clinical manifestation seen was hydrocele in males constituting 35% of the total clinical cases.
Conclusions: The prevalence of filariasis in this tribal area was high. Mf rate was 14.4%. Endemicity rate was 17.3%. Hydrocele was the commonest clinical manifestation.
Keywords: Prevalence, Filariasis, Tribal area
Department of Community Medicine, Dr. Panjabrao Deshmukh Memorial Medical College, Amravati, Maharashtra, India
Received: 21 December 2018
Accepted: 07 January 2019
*Correspondence:
Dr. Vasant Ramraoji Lunge, E-mail: [email protected]
Copyright: © the author(s), publisher and licensee Medip Academy. This is an open-access article distributed under the terms of the Creative Commons Attribution Non-Commercial License, which permits unrestricted non-commercial use, distribution, and reproduction in any medium, provided the original work is properly cited.
Surveys carried out over the year have revealed that the areas previously known to be free from bancroftian filariasis are showing the evidence of low degree of transmission. Filariasis is found in all the states including Rajasthan and Punjab which were previously considered to be non filarious. But the heavily infected areas are situated in the south and middle India, so also along the coastal regions of the country i.e. Andhra Pradesh, Odisha, Kerala and Tamil Nadu and also certain areas in Uttar Pradesh, Madhya Pradesh, Bihar and Maharashtra.3 The magnitude of the problem has resulted intense efforts being made to control and if possible eradicate the problem. The National Filariasis Control Program was launched in the year 1955 and it is being attempted, attacking the problem from all the angles. This has included mosquito control, population survey and mass treatment methods as well as treatment of positive cases with intensive therapeutic regimens and environmental control measures. In spite of all the time, money and manpower and efforts having been put in, large population groups are being infected over the years, because of his huge natural reservoir of the disease both in natural environment and circumstances.4
The factors that prevent a large percentage of population living in endemic area from being infected or becoming positive for microfilaria are not well understood. Though the disease is not fatal, it is responsible for considerable amount of morbidity, disfigurement and disability. The disease also carried a social stigma with it. The disease is spreading fast because of industrialization and unplanned urbanization providing mosquito breeding places.5 As a matter of fact everybody is concerned for water supply but nobody bothers where the waste water goes. This has resulted in collection of water, leading to breeding of culex mosquitoes, so also breeding of mansonides in lakes and water ponds harboring aquatic weeds. In Maharashtra, filariasis due to W. bancrofti occurs in western coastal zones and in various areas towards the north east. Out of the total population of 62.72 million in Maharashtra (1981 census) population at risk was 11.18 million and there were 0.73 million microfilaria carriers and 0.14 million persons with disease in the state. The available reports show that 4.5 million people in six districts of Vidarbha region in Maharashtra state are exposed to the risk of filariasis. Nine districts in Maharashtra were said to be endemic. According to filarial report of district Gadchiroli (1989), the overall endemicity rate for whole district was 11.1%.4 The epidemiological study of filariasis in Dongargaon village of PHC Potegaon in district Gadchiroli was undertaken to determine the different indices and prevalence of filariasis.
The present study was conducted to study awareness and perception about dog bite among the population in the rural area of Maharashtra.
METHODS
Study design
Community based cross sectional study.
Study period
From January 1988 to December 1988.
Study settings
Lymphatic filariasis has been reported to be endemic in Nagpur, Chandrapur, Bhandara, Yeotmal and Gadchiroli districts in Vidarbha. Out of these Gadchiroli district is a tribal district. Since there had been very few studies on filariasis in the tribal area, it was decided to take up a study on lymphatic filariasis in Gadchiroli district. Since it was not possible to plan study for the whole district, because of shortage of resources, it was decided to carry out the study in one of the villages in this district.
Sample size
The preliminary survey carried out in the headquarter village of primary health centre (PHC) Potegaon in the district gave a microfilaria rate of 17%. On the basis of this prevalence rate, with an acceptable error of 20%, the sample size for the present study worked out to be 488. Keeping in mind, the sample size and resources at hand, a village Dongargaon in this district with a population of 565 was selected for the present study.
To start with, the whole population of the village was enumerated through house to house survey utilizing the opportunity for health education, to ensure the cooperation of the people for night blood survey.
Through house to house visits, data on age, sex, occupation, clinical disease etc was collected on a pre testee proforma. Night blood smears were obtained between 9 pm to 11.30 pm by finger prick method and thick smears were prepared and usual staining procedure was performed. 451 people out of (enumerated) 565 could be covered excluding infants.
Diethyl carbamazine (DEC) provocative test was performed the next day by administering 100 mg DEC orally and collecting blood sample after one hour with usual method. DEC could be administered to only 200 individuals in spite of utmost efforts to ensure cooperation.
RESULTS
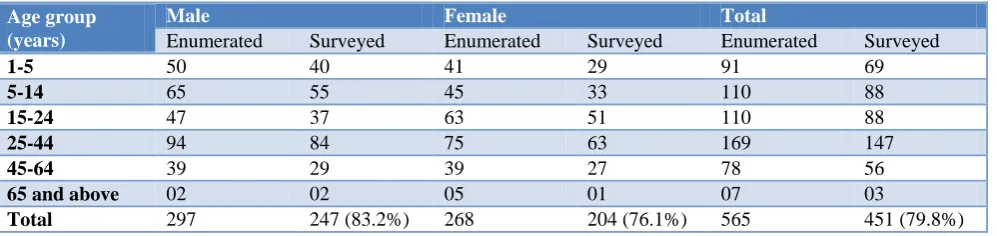
proposed to cover the entire population for survey. However only 451 out of 565 i.e. 79.8% of the total
population could be surveyed. 83.2% males and 76.13% females were covered in the survey.
Table 1: Age and sex distribution of population (enumerated and surveyed).
Age group (years)
Male Female Total
Enumerated Surveyed Enumerated Surveyed Enumerated Surveyed
1-5 50 40 41 29 91 69
5-14 65 55 45 33 110 88
15-24 47 37 63 51 110 88
25-44 94 84 75 63 169 147
45-64 39 29 39 27 78 56
65 and above 02 02 05 01 07 03
Total 297 247 (83.2%) 268 204 (76.1%) 565 451 (79.8%)
Table 2: Age and sex distribution of persons with clinical manifestations (C/M) of filariasis.
Age group (years)
Male Female Total
No. examined C/M % No. examined C/M % No. examined C/M %
1-4 40 0 0 29 0 0 69 0 0
5-14 55 2 3.6 33 1 3 88 3 3.4
15-24 37 3 8.1 51 1 2 88 4 4.5
25-44 84 3 3.6 63 2 3.2 147 5 3.4
45-64 29 4 13.8 27 2 7.4 56 6 10.7
65 and above 02 1 50 01 1 100 3 2 66.7
Table 3: Distribution of persons showing microfilaria in blood by age and sex
Age group (years)
Male Female Total
No. examined
Mf
+ve %
No.
examined Mf +ve %
No.
examined Mf +ve %
1-4 40 0 0 29 0 0 69 0 0
5-14 55 09 16.4 33 05 15.1 88 14 15.9
15-24 37 10 27.1 51 05 9.8 88 15 17.1
25-44 84 14 16.7 63 07 11.1 147 21 14.3
45-64 29 10 34.5 27 02 7.4 56 12 21.4
65 and above 02 02 100 01 1 100 3 3 100
Total 247 45 18.2 204 20 9.8 451 65 14.4
Table 4: Microfilaria endemicity and other indicators age wise
Age group (years)
No.
examined Mf +ve
Clinical
cases Total
Endemicity rate
Mf +ve clinical cases
Mf –ve clinical cases
1-4 69 0 0 0 0 0 0
5-14 88 14 03 16 18.2 01 02
15-24 88 15 04 17 19.3 02 02
25-44 145 21 05 23 15.9 03 02
45-64 56 12 06 17 30.4 01 05
65 and above 05 03 02 05 100 0 02
Total 451 65 20 78 17.3 07 13
Table 2 shows age and sex distribution of persons with clinical manifestations (C/M) of filariasis. Out of 451 persons examined, 20 (4.4%) were showing clinical manifestations. Out of which 13 (5.3%) were males and 7 (3.4%) were females. maximum cases were seen in both
Table 3 shows distribution of persons showing microfilaria in blood by age and sex. It is seen that 65 persons were having Microfilaria in blood, giving the overall microfilaria rate of 14.4%. It is also seen that the microfilaria rate in male was 18.2% and in female it was
9.8%. It is seen that as the age advanced, the observed microfilaria rate tended to increase. This is particularly marked in males. The highest microfilaria rate was observed in age group of 45 years and above. Microfilaria was not seen in the age group of 1-4 years.
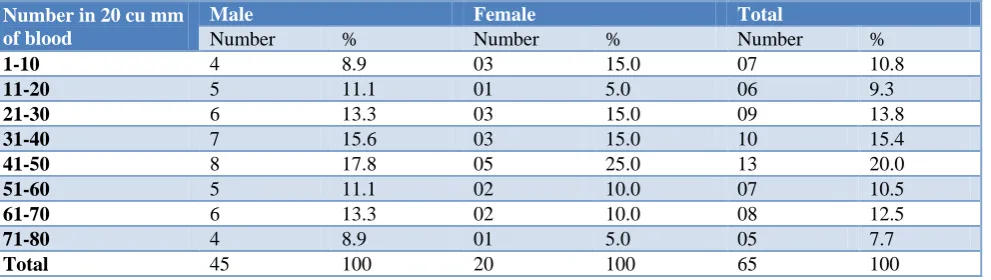
Table 5: Age wise distribution of cases according to microfilaria density
Number in 20 cu mm of blood
Male Female Total
Number % Number % Number %
1-10 4 8.9 03 15.0 07 10.8
11-20 5 11.1 01 5.0 06 9.3
21-30 6 13.3 03 15.0 09 13.8
31-40 7 15.6 03 15.0 10 15.4
41-50 8 17.8 05 25.0 13 20.0
51-60 5 11.1 02 10.0 07 10.5
61-70 6 13.3 02 10.0 08 12.5
71-80 4 8.9 01 5.0 05 7.7
Total 45 100 20 100 65 100
Table 6: Average infestation rate (AIR) according to age and sex.
Age group (years)
Male Female Total
No. of cases
Total no. of
Mf in group AIR
No. of cases
Total no. of
Mf in group AIR
No. of cases
Total no. of
Mf in group AIR
1-4 0 0 0 0 0 0 0 0 0
5-14 9 378 42.0 05 88 17.6 14 466 33.3
15-24 10 388 38.8 05 90 18.0 15 478 31.9
25-44 14 412 29.4 07 128 18.3 21 540 25.7
45-64 10 315 31.5 02 40 20 12 355 29.6
65 and above 02 42 21.0 01 28 28.0 03 70 23.3
Total 45 1535 34.1 20 374 18.7 65 1909 29.4
Table 7: Distribution of filarial cases according to clinical manifestations.
Clinical manifestations Male Female Total
Number % Number % Number %
Swelling of upper limb only 0 0 03 42.9 03 15
Swelling of lower limb only 02 15.4 03 42.9 05 25
Swelling of both upper and lower limbs 02 15.4 01 14.2 03 15
Hydrocele 07 53.8 0 0 07 35
Lymphadenitis 02 15.4 0 0 02 10
Total 13 100 07 100 20 100
Table 4 shows microfilaria endemicity and other indicators age wise. Total number of persons with microfilaria positive in the smear was 65 out of 451. Total number of clinical cases was 20 out of 451 persons, out of which seven had microfilaria positive in the smear and 13 were microfilaria negative. Total endemicity rate was 17.3%. Highest endemicity rates were seen in the age group of 45-64 years (30.4%) and in the age groups of 65 and above (100%).
Table 5 shows age wise distribution of cases according to microfilaria density. The lowest number of microfilaria was seen in 5 in 20 cumm of the blood while the highest
count was 78 in the 20 cu mm of the blood. 13 smears (20%) showed that microfilaria count was in the range of 41-50.
Table 7 shows distribution of filarial cases according to clinical manifestations. 15% of the total clinically manifested persons showed swelling in the upper limb only. 25% had shown the swelling in the lower limb only. 15% of the cases had swelling in both the upper and lower limbs. The most prominent clinical manifestation seen was hydrocele in males constituting 35% of the total clinical cases. Only 10% were having lymphadenitis.
DISCUSSION
The overall microfilaria rate was 14.4% in this study. This rate is consistent with 17.9% obtained by Chandra et al who surveyed three villages in Lucknow district.6 Bhattacharya et al in their work in Calcutta and Howrah got the microfilaria rate of 13.6% and 7.8% respectively.7 Mishra et al at Reva found that the microfilaria rate was 7.1%.8 Thus the microfilaria rate in the present study was consistent with other studies as mentioned above.6-8 The microfilaria rate was 18.22% in males and 9.8% in females. Chandra et al had similar observations in their work around Lucknow and they reported that it was 18.6% in males and 16.9% in females.6 Bhattacharya et al in their Howrah survey observed high microfilaria rate of 15.9% in males compared to 9.8% in females.7 Higher rates in males may be attributed to outdoor habits and scanty clothing providing more opportunities for infected mosquito bites. Penaia et al observed that the average microfilaria prevalence in males was 2.3 times higher than in females.9 This finding is in conformity with our study in which prevalence was two times higher in males than females.9
The transmission in an area depends upon microfilaria density in peripheral blood. The minimum level of microfilaria which will infect mosquito is not definitely known but at least 2 per 40 cu mm of blood can infect 2.6% mosquitoes fed on man. When mosquitoes were fed on carriers having as many as 80 or more microfilaria per 20 cu mm of blood the heavily infected mosquitoes did not survive when a number of microfilaria began to reach maturity.10
In the present study 10.8% of cases have 1-10 microfilarias per 20 cu mm of blood, 9.2% have 11-20 mf per 20 cu mm of blood and 13.8% of cases have 121 to 30 mf per 20 cu mm of blood. But Shrivastava et al study has shown that 56.9% of the cases 1-10 mf per 20 cu mm of blood and 43.1% of the cases had mf 11-30 per 20 cu mm of blood.11
In this study, average infestation calculated as number of mf per positive slide was found to be 29.36. Average infestation for male and female was 34.1% and 18.7% respectively. Bhattacharya et al observed that the average microfilarial densities of 16.5 and 5 respectively in Howrah and Calcutta.7
In the present study, out of 451 persons examined, 20 showed clinical evidence of the disease, the overall rate being 4.43%. Gawda et al observed a disease rate of only 0.03% in the slums of Bangalore city.12 Mishra et al obtained disease rate of 2.7%.8 Shrivastava et al observed no disease in the age group of 0-10 years and then upward trend similar to the present study findings with the age.13
We found that hydrocele was the most common clinical presentation. Maltola et al noted in Tanazania that a prevalence rate of leg elephantiasis was 0.4% i.e. only two cases of elephantiasis of breast were seen and no cases of elephantiasis of the arm were encountered.14 But these findings are not in accordance with our findings as no case of breast elephantiasis was noted. We found 15% cases of arm elephantiasis.14
The overall endemicity rate in the present study was 17.3%. Srivastava et al observed the endemicity rate of 15.4% and also observed progressive increase with the age.13 Mishra et al observed endemicity rate of 7.6%.8 Thus our findings of endemicity rate (17.4%) are in conformity with Srivastava et al but not with Mishra SS et al.8,13
In the present study from 30 persons, who were mf+ve in night blood smear, after administration of DEC; 21 were positive. From 62 persons who were mf-ve night blood smear, 51 persons were mf+ve after DEC.
CONCLUSION
The prevalence of filariasis in this tribal area was high. Mf rate was 14.4%. Endemicity rate was 17.3%. Hydrocele was the commonest clinical manifestation. The sensitivity of DEC provocative test was found to be 70% and the specificity was found to be only 17.7%. Thus the DEC provocative test cannot be totally relied upon but can be performed in emergency situations.
Funding: No funding sources Conflict of interest: None declared
Ethical approval: The study was approved by the Institutional Ethics Committee
REFERENCES
1. Basu PC. Filariasis in India: facts and figures. Part X. Tamil Nadu J Communicable Dis. 1972;3:113-25.
2. World Health Organization. Lymphatic filariasis: 4th report of WHO Expert Committee on Filariasis. Tech Rep Series 702. 1984
3. Singh B. Filariasis in India: facts and figures. Bull Mal Other Communicable Dis. 1967;4:260.
5. Hii J. Bancroftian filariasis and malaria in island and Hinterland. Trop J Med Res. 1985;37(2):93-101.
6. Chandra S. Observation in filariasis in some villages around Lucknow. Indian J Med Res. 1979;61:1127. 7. Bhattacharya NC. Tropical diseases. Bulletin
1964;2:171.
8. Mishra SS. An epidemiological study of filariasis in Reva Town (MP). Indian J Public Health. 1979;1:7-16.
9. Kimura E. Penaia L, Spears GFS. Epidemiology of sub periodic bancroftian filariasis in Samoa 8 years
after control by mass treatment with
diethylcarbamazine. Bull World Health Organ. 1985;63(5):869-80.
10. Omri N. Periodicity of Wucherian Bancrofti infection. Bull World Health Organ. 1963;27:586.
11. Shrivastava BV. Human filariasis in slums of Bengal Ore Corporation. Indian J Med Res. 1973;15:589.
12. Gawda B. Filariasis in Mysore state, Bharkal town. Facts and figures. Bull Mal Other Communicable. Dis 1961;4:137.
13. Shrivastava RM, Prasad BC. Epidemiology of bancroftian filariasis. Indian J Med Res. 1969;3:57. 14. Maltola YG. Prospect of human filariasis. Trop J
Med Res. 1985;37(2):108-13.