Genetics and Molecular Research 17 (1): gmr16039880
Development and characterization of twenty-eight
polymorphic microsatellite for rice field eel
(Monopterus
albus)
using RAD tag sequencing
Feifei Zhang1*, Yulan Wang2, Min Xu1, Lili Wei3*, Qiwang Zhong1* 1
College of Biological Science and Engineering, Jiangxi Agricultural University, Nanchang, P.R. China
2
Nanchang Academy of Agricultural Sciences, 330038, Nanchang, P.R. China
3
College of Animal Science and Technology, Jiangxi Agricultural University, 330045, Nanchang, P.R. China Corresponding author: Qiwang Zhong and Lili Wei
E-mail: [email protected]; [email protected] Genet. Mol. Res. 17 (1): gmr16039880
Received November 14, 2017
Accepted February 04, 2018
Published February 12, 2018
DOI http://dx.doi.org/10.4238/gmr16039880
Copyright © 2018 The Authors. This is an open-access article distributed under the terms of the Creative Commons Attribution ShareAlike (CC BY-SA) 4.0 License.
ABSTRACT. Monopterus albus is a special economic aquatic animal in China. Most of cultured M. albus are wild species captured from different areas, and this makes the wild resources of M. albus are under great threat. Microsatellite markers can help us understand the genetic resources of M. albus in different areas. In this study, using RAD-seq (restriction site associated DNA sequencing) protocol, a total of 9,897 microsatellites were identified in the genome with average frequency of 195 microsatellites per megabase of genomic sequences. Among these SSRs, the dinucleotide repeat motif was the most abundant type representing 61.77% of the total microsatellite loci, followed by pentanucleotides (13.91%), trinucleotides (12.08%), tetranucleotides (9.30%) and hexanucleotides (2.94%). A total of 100 SSR primers were designed for PCR amplification. The polymorphism analysis showed that 28 primer pairs could successfully amplify the polymorphic fragments and the number of alleles per polymorphic locus ranged from 2 to 13, with an average of 5.70 alleles/locus. The values of observed and expected heterozygosity are ranged from 0.0333 to 0.8000 and 0.0333 to 0.8887, respectively. This microsatellite locus will be useful to understand the structure, genetic diversity, and genetic difference of this species.
Genetics and Molecular Research 17 (1): gmr16039880
INTRODUCTION
The swamp eel (Monopterus albus), belongs to Order Synbranchiformes, Family Synbranchidae, and is widely distributed in the muddy ponds, swamps, canals, and rice fields (Chew SF, et al. 2015). Because of its great growth performance and rich nutrient content, swamp eel has become a commercially important farmed species in China (Chen D, et al. 2016). Due to the difficulties in artificial breeding, all cultured M. albus come from wild species, and this makes the wild resources of M. albus are under great threat. Proper conservation management of this species is of interest to ensure the sustainable exploitation. Knowledge of the population genetic structure and genetic resources condition is vital for conservation endeavors of this species. Microsatellites are very suitable markers for such studies because of their high frequency of distribution (Tóth G, 2000) co-dominance, reproducibility, and high level of polymorphism
(
Wang S, 2009). Recently, some microsatellites have been isolated for M. albus (Li WT, 2007). However, additional loci will facilitate high-resolution analyses such as pedigree reconstruction and assignment test.The traditional development of microsatellite markers, based on probe hybridization, is time-consuming and expensive (An HS, 2012; Ekblom R, 2011). Current next generation sequencing (NGS) technologies can generate a large number of sequences and provide a great convenient for the acquisition of genetic markers [8]. Especially the “Restriction-site Associated DNA” (RAD) method, using the Illumina platform, it has been proved an efficient and cost-effective method for SSRs discovery
(
Castoe TA, et al. 2012)In this study, the de novo RAD-seq of M. albus were performed to discovery microsatellite markers. Furthermore, we developed 28 polymorphic microsatellite markers which could provide an effective tool for population genetic structure and conservation genetics researches of this species.
MATERIAL AND METHODS
DNA extraction
Sample of M. albus were collected from wild population from Jiangxi Province, China (n=30). Genomic DNA was extracted from muscle tissue, using the traditional phenol chloroform method. Extracted DNA were dissolved in ddH2O and assessed by loading on a 1.5% agarose gel, stored at -20°C.
RAD-seq sequencing and contigs assembly
The RAD library was constructed at Meiji Inc (China) according to the protocol described by Etter et al. Briefly, genomic DNA was digested with PstI, then the P1 adapter (an adapter contains a matching sticky-end, Illumina sequencing priming sites, and the “barcoding” a nucleotide 4 or 5 bp long for sample identification) was ligated to the products of the restriction reaction. The reactions were then pooled, randomly sheared to a mean size of 500 bp, the DNA in the rage 300-800 bp was selected following electrophoresis. After end repair and the addition of 3’-adenine overhangs, DNA was then ligated to a second adapter (P2). PCR amplification was performed using P1-and P2-adapter primes, enriching for RAD tags that contain both adapters, and preparing them to be hybridized to HiSeq 2000 sequencer. Illumina raw data were processed using Stacks process_radtags. pl script (Catchen J, 2013), and then the high quality first and second reads were retained for de novo assembly using Velvet (Namiki T, 2012).
SSR identification and primer design
All assembly contigs were used to identify SSR motifs by MISA (Beier S, 2017). The search criteria were that the minimum repetitions of di-, tri-, tetra-, penta-, and hexa-nucleotides were 6, 5, 4, 3 and 3, respectively. Mononucleotide repeats were excluded. Using primer premier 5.0 software (Premier Biosoft International), 100 pairs of primers were then designed flanking the repeat regions of interest and the target amplicon size was in the range of 100-250 bp. All the primer pairs were subject to the temperature gradient PCR system for annealing temperature optimization. Only the primers which could successfully amplify the target fragments were used for the next polymorphism analysis.
Microsatellite polymorphism verification and data analysis
Genetics and Molecular Research 17 (1): gmr16039880
followed by 30 cycles with 94°C for 30 s, annealing temperature 30 s, 72°C for 60 s and an additional extension at 72°C for 10 min. Polymorphic amplification products were separated on 12% non-denaturing polyacrylamide gel and stained with ethidium bromide. After establishing the AB matrix, the software Genepop v1.32 (Rousset F, 2008). was applied to estimate microsatellite alleles, observed heterozygosities, HWE and expected heterozygosities. Polymorphic information content (PIC) was obtained by PIC_CALC software. Micro-Checker was used to test for the presence of null alleles (Oosterhout CV, 2004).
RESULTS AND DISCUSSION
RAD-seq sequencing and contigs assembly
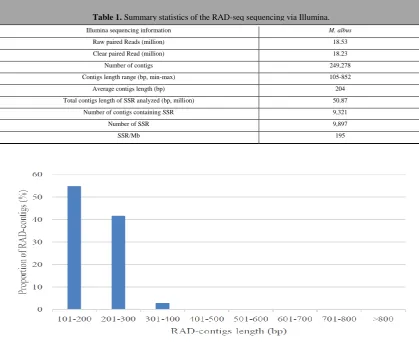
Compared with the traditional enrichment library, RAD-seq technology is more convenient and less time consuming in SSRs identification (Miller MR, 2007). In this study, the sequencing procedure generated 18.53 million raw reads, and after filtering using process_radtags. pl script, 18.23 million clean paired reads were retained (Table 1). These clean reads were assembled into 249,278 contigs (105-852 bp) using Velvet. The average contigs length was 204 bp, and most contigs was 101-300 bp (96.7%) (Figure 1). Raw data have been made available through the Sequence Read Archive (SRA) repository at NCBI (SRR5980345).
Illumina sequencing information M. albus
Raw paired Reads (million) 18.53
Clear paired Read (million) 18.23
Number of contigs 249,278
Contigs length range (bp, min-max) 105-852
Average contigs length (bp) 204
Total contigs length of SSR analyzed (bp, million) 50.87
Number of contigs containing SSR 9,321
Number of SSR 9,897
SSR/Mb 195
Figure 1. Contigs length distribution of RAD-seq.
Characterization of SSRs
A total of 9,897 microsatellites were identified with average frequency of 195 microsatellites per megabase of genomic sequences (Table 1), which was little higher than that documented in swamp eel whole genome (179/Mb) (Li Z, 2017), but low than that in Clarias batrachus (247/Mb) (Srivastava S, 2016), This difference may be due to the sizes of the databases and bioinformatics software tools.
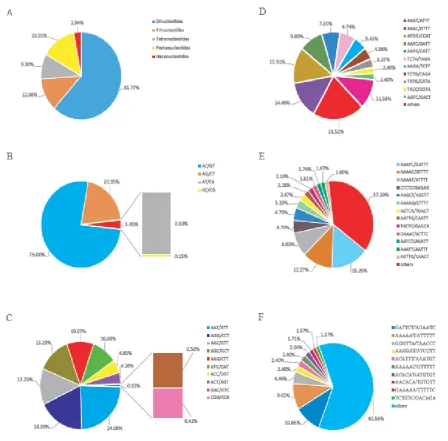
Among these SSRs, the most abundant repeat motif were dinucleotides (61.77%), followed by pentanucleotides (13.91%), trinucleotides (12.08%), tetranucleotides (9.30%) and hexanucleotides (2.94%) (Figure 2A). Similar results were found in many other creatures, such as Buhalus Bubalis (Qi WH, 2015), Panulirus guttatus
Genetics and Molecular Research 17 (1): gmr16039880
(Truelove N, 2016) Clarias batrachus (Srivastava S, 2016) and Scophthalmus maximus (Pardo BG, 2007) in which the dinucleotides were the most abundant repeat motif.
Similar to other fishes (Zhang J, 2014;Kim KS, 2016) in dinucleotides repeat motif, AC/GT motifs (76.00%) were most abundant and GC/CG (0.15%) repeats were extremely rare in M. albus (Figure 2B). Among the trinucleotides, AAT/ATT (24.08%) was most abundant motifs, followed by AGG/CCT (18.39%), AAC/GTT (13.29%) and AGC/GCT (13.29%), whereas CGG/CCG (0.42%) motifs were the least (Figure 2C). Three most frequent repeats in tetranucleotide were AAAT/ATTT (21.52%), AAAC/GTTT (14.46%) and ATGG/CCAT (13.91%) (Figure 2D). Among pentanucleotide repeats, the top three types of repeat motifs are AAATC/GATTT (15.25%), AAAAC/GTTTT (12.27%) and AAAAT/ATTTT (8.93%) (Figure 2E). In hexanucleotides, GATTCT/AGAATC (10.65%), AAAAAT/ATTTTT (9.62%) and GGGTTA/TAACCC (4.46%) were the most abundant repeats (Figure 2F). The abundance of A-rich repeat motifs in genome SSRs indicated its significant evolution role in fish species (Li Z, 2017).
Figure 2. Distribution of repeat types in the M. albus. The proportion of five different nucleotide repeat types to total SSR (A). Proportion distribution of selected motifs of dinucleotide repeats (B), trinucleotides repeats (C), tetranucleotides (D),
Genetics and Molecular Research 17 (1): gmr16039880
Development of polymorphic microsatellite markers
A total of 100 SSR primers were designed for PCR amplification and the results showed that 28 primer pairs could successfully amplify the polymorphic fragments. The polymorphic percentage was 28%, which was lower than Ichthyoelephas longirostris (60%) (Landinez-Garcia RM, 2016) Lateolabrax japonicus (42%) (Li BB, 2016) and Geophagus brasiliensishigh (36%) (Ferreira DG, 2013), but higher than Clarias batrachus (17%) [18], hybrid giant tiger grouper (20%) (Huang YS, 2015) and Girella elevate (22%) (McWilliam RA, 2016).
Across 30 individuals surveyed, the number of alleles at these informative loci varied from 2 (SSRSZ78, SSRSZ92, SSRSZ98) to 13 (SSRSZ97), with an average of 5.70 alleles/locus (Table 2).
Locus Accession no.
Primer sequences (5'-3') Repeat motif
Ta (℃)
Allele size (bp)
Na Ho He PIC P
SSRSZ2 MF773693 F:TGTCAGTGAGCAGAGAGCAGGC
R:GATAAGGGTTAGGTTAGGCAGGTAG
(AC)11 59.5 135~180 9 0.7812 0.7981 0.7569 0.44
SSRSZ10 MF773694 F:CTGCTGCTACTTAATAAGACTTTCG
R:TTTCAGACTACACCATATGCCTCAC
(CA)12 65.3 182~215 10 0.4333 0.7429 0.6899 0.21
SSRSZ14 MF773695 F:CTCTCTAATCACCTCACCGTCAAAC
R:CTACCTTACTTCCGTTCCTTCATTC
(TC)8 59 130~150 3 0.1000 0.3678 0.3310 <0.05
SSRSZ15 MF773696 F:ATGTGTTTTCTGAGCATCTGTGGAC
R:TCTGTAAGTCTGTGCAAGGTTCCTG
(TG)15 67 185~205 7 0.5185 0.7065 0.6465 0.57
SSRSZ16 MF773697 F:ACAAACTTAACCGCAGAAATCTCAG
R:GGAACAGACATACTGATGGAGAGAC
(AC)12 65.3 184~195 8 0.5122 0.7823 0.7371 0.18
SSRSZ26 MF773698 F:CTTTGACCTTAGAGAGTAAATGCTG
R:TCTGGTACATTAAGCTCACAAGTTC
(TTTG)4 58.3 188~205 5 0.1500 0.2291 0.2138 0.20
SSRSZ33 MF773699 F:CCTTTGCTGAGTGTGGTTTTGAATG
R:ATGTGACAAACTGATGTGAGGATGC
(TG)9 63.2 164~200 3 0.0333 0.3678 0.3310 <0.05
SSRSZ38 MF773700 F:CTTTTCACTACCGGATGAGAGCTTG
R:ATTCAGCCTGGTACAGTGTAAGTGC
(GT)14 56.6 160~173 6 0.6000 0.7706 0.7186 0.09
SSRSZ44 MF773701 F:GTGGCTGAAGTCTCTACTCCTCTGC
R:CGTCTTAACGTGAAACTGCCCATAC
(CTG)11 60.9 130~150 5 0.0345 0.5632 0.4925 <0.05
SSRSZ45 MF773702 F:CTCAGGTTTTGATAGAAAGGTGCAG
R:GCTTCATATACATTCACTCGTTGCG
(TG)16 60.9 145~190 8 0.5667 0.7616 0.7222 0.07
SSRSZ54 MF773703 F:GAGGCAGTTCAGAAGCAGAGTGGAG
R:AAACGCTGCCACCAACACCTAC
(AGC)7 63 150~153 3 0.1000 0.4367 0.3706 <0.05
SSRSZ57 MF773704 F:CAAACACTGTAAAGCAATGGAGC
R:GCGAAAATAGGGTAGACGACAC
(CA)10 61.8 171~190 4 0.1000 0.3418 0.3054 <0.05
SSRSZ58 MF773705 F:CTGAAACACATCATGCCAAACAAC
R:GTGCCATTGCTACGAGGGTTTC
(GT)9 59.6 170~205 4 0.5357 0.6617 0.5828 <0.05
SSRSZ62 MF773706 F:CTTCTGAGACCTTGTCCTGCTG
R:GGTGGACGCAACAACTTCTACTG
Genetics and Molecular Research 17 (1): gmr16039880
Notes: Ta, annealing temperature; Na, observed number of alleles; Ne, Effective number of alleles; Ho, observed heterozygosity; He, expected heterozygosity; PIC, Polymorphic information content; P, P-value for deviation from Hardy-Weinberg equilibrium (p<0.05).
CONCLUSION
The expected heterozygosity ranged from 0.0333 to 0.8887, while the observed heterozygosity varied from 0.0333 to 0.8000. The average value of PIC was 0.4987, indicating the high level of polymorphism of these loci. After Bonferroni correction in Genepop v1.32, ten loci showed significant deviation from HWE. The microsatellite markers characterized here would contribute to the investigation of the genetic diversity and population structure in this species.
SSRSZ65 MF773707 F:AGAGGACAAGAGGTATGGGACAAGC
R:TCCGCCCTCCTGCCTTTTTC
(AGGAG)8 63 130~170 10 0.7692 0.8531 0.8234 0.62
SSRSZ73 MF773708 F:CATCAAGCCACGAAAGTGTCAAAG
R:CTCGGGAATGAAACAGGATGTAAAC
(TG)10 62.6 113~168 7 0.6500 0.7782 0.7304 0.61
SSRSZ75 MF773709 F:GGATAGAGTTAGGTGGAAACAAATG
R:ATCCCTGGTGGAATCTTTGAC
(AAG)9 59.3 144~170 12 0.7179 0.9048 0.8831 0.15
SSRSZ78 MF773710 F:GCAAAAATCAGGGAGGAGAGAATG
R:AGCAAGGTTATGCCAGACCAGAGG
(ATTT)4 64.2 181~190 2 0.0250 0.0250 0.0244 1.00
SSRSZ81 MF773711 F:TACTAACAGAGGATGCCTTCACCAG
R:ATTGGTGTATTGCTGGGAAGTGGTC
(GT)7 62.3 140~175 3 0.2000 0.1873 0.1769 0.93
SSRSZ82 MF773712 F:TACCTGTTGCCACTGTGACCTG
R:GGATTTGATGGGTGTTTCTGTG
(ATGG)8 60.1 140~170 3 0.2000 0.3452 0.3129 <0.05
SSRSZ84 MF773713 F:GGCAGTCATCGCACACCAGGTATTC
R:AAGGAAGAGCAGGTCAAGAAGGTGG
(TGTCAG)3 61.5 166~175 3 0.2000 0.1859 0.1711 0.90
SSRSZ85 MF773714 F:GTGTGCGTGATACAGTGATTTGAAC
R:CGCTCTGACGCAGTGGTTTC
(TGA)6 62.9 146~153 4 0.1000 0.6627 0.5972 <0.05
SSRSZ87 MF773715 F:GTTCTCCATTGCTGCTGAAACACTG
R:GGTTCTCATTCACCCTGGCTACAC
(TACC)6 61.5 186~210 8 0.6829 0.7696 0.7241 0.64
SSRSZ89 MF773716 F:GATGAGTAGCCACCGACCAC
R:CTTACAGGGAGTTTCTTCTTCTACC
(CTTTT)3 59.4 130~135 3 0.8000 0.5757 0.4747 <0.05
SSRSZ92 MF773717 F:TCTTCTTTCCTCCTACCCGCCACTG
R:ATTTCCCTCTTCCTTCCCTTCCATC
(AAAAT)3 61.4 150~160 2 0.0333 0.0333 0.0323 1.00
SSRSZ96 MF773718 F:TACAGCAGGGTCAAGAGGAAAACAG
R:AACCAGCATCACATACCAGCCTCC
(TGC)7 63.8 180~200 5 0.0667 0.4689 0.4347 <0.05
SSRSZ97 MF773719 F:GGTGTTCAGCCCTTATTATTACTTG
R:CAGTGAAGTCAGGGAGAAATGCTAC
(TG)13 57.1 156~170 13 0.8718 0.8868 0.8640 0.08
SSRSZ98 MF773720 F:GCTTTGGGTGGTAATCACTGCTG
R:AAGATTGTTGTCACACAGCCAGGAG
(TCTA)4 63.8 145~160 2 0.3793 0.3128 0.2602 0.12
Genetics and Molecular Research 17 (1): gmr16039880
ACKNOWLEDGMENT
This work was supported by grants from the National Natural Science Foundation of China (No. 31160530 and No. 31360634), the National Natural Science Foundation of Jiangxi Province (20114BAB214003), the Science and Technology Support Program of Jiangxi Province (20122BBF60074) and the Project of Education Department in Jiangxi Province (GJJ13289).
REFERENCES
Chew SF, Gan J (2005). Nitrogen metabolism and excretion in the swamp eel, Monopterus albus, during 6 or 40 days of estivation in mud. Physiological and Biochemical Zoology. 78, 620-629. https://doi.org/10.1086/430233
Chen D, Chu W, He Y, Liang XF, et al. (2016) Characteristics and phylogenetic studies of complete mitochondrial DNA based on the rice field eel (Monopterus albus) from four different areas. Mitochondrial DNA. 27: 2419-2420.
https://doi.org/10.3109/19401736.2015.1030623
Tóth G, Gáspári Z, Jurka J (2000) Microsatellites in Different Eukaryotic Genomes: Survey and Analysis. Genome Research. 10: 967-981.
https://doi.org/10.1016/j.gene.2011.08.016
Wang S, Zhang L, Matz M (2009). Microsatellite Characterization and Marker Development from Public EST and WGS Databases in the Reef-Building Coral Acropora millepora (Cnidaria, Anthozoa, Scleractinia). Journal of Heredity. 100 329-337.
https://doi.org/10.1093/jhered/esn100
Li WT, Liao XL, Yu XM, Cheng L, et al. (2007). Isolation and characterization of polymorphic microsatellites in a sex-reversal fish, rice field eel (Monopterus albus). Molecular Ecology Notes. 7: 705-707. https://doi.org/10.1111/j.1471-8286.2007.01683.x
An HS, Lee JW (2012). Development of microsatellite markers for the Korean Mussel, Mytilus coruscus (Mytilidae) using next-generation sequencing. International Journal of Molecular Sciences. 13: 10583-10593. https://doi.org/10.3390/ijms130810583
Iniguez-Luy FL, Voort AV, Osborn TC (2008). Development of a set of public SSR markers derived from genomic sequence of a rapid cycling Brassica oleracea L. genotype. Theoretical and Applied Genetics. 117: 977-985. https://doi.org/10.1007/s00122-008-0837-9.
Ekblom R, Galindo J (2011). Applications of next generation sequencing in molecular ecology of non-model organisms. Heredity. 107: 1-15. https://doi.org/10.1038/hdy.2010.152
Castoe TA, Poole AW, de Koning AP, Jones KL, et al. (2012). Rapid microsatellite identification from Illumina paired-end genomic sequencing in two birds and a snake. PLoS One. 7:e30953. https://doi.org/10.1371/journal.pone.0030953
Etter PD, Bassham S, Hohenlohe PA, Johnson EA, et al. (2011) SNP discovery and genotyping for evolutionary genetics using RAD sequencing. Methods in molecular biology. 772: 157-178. https://doi.org/10.1007/978-1-61779-228-1_9
Catchen J, Hohenlohe PA, Bassham S, Amores A, et al. (2013). Stacks: an analysis tool set for population genomics. Molecular Ecology. 22, 3124-3140. https://doi.org/10.1111/mec.12354
Namiki T, Hachiya T, Tanaka H, Sakakibara Y (2012). MetaVelvet: an extension of Velvet assembler to de novo metagenome assembly from short sequence reads. Nucleic Acids Research. 40: e155. https://doi.org/10.1093/nar/gks678 .
Beier S, Thiel T, Munch T, Scholz U (2017). MISA-web: a web server for microsatellite prediction. Bioinformatics. 33: 2583-2585.
https://doi.org/10.1093/bioinformatics/btx198
Rousset F (2008). genepop'007: a complete re-implementation of the genepop software for Windows and Linux. Molecular Ecology Resources. 8: 103-106. https://doi.org/10.1111/j.1471-8286.2007.01931.x
Oosterhout CV, Hutchinson WF, Wills DPM, Shipley P (2004). micro-checker software for identifying and correcting genotyping errors in microsatellite data. Molecular Ecology Notes. 4: 535-538. https://doi.org/10.1111/j.1471-8286.2004.00684.x
Miller MR, Dunham JP, Amores A, Cresko WA, et al. (2007). Rapid and cost-effective polymorphism identification and genotyping using restriction site associated DNA (RAD) markers. Genome Research. 17: 240-248. https://doi.org/10.1101/gr.5681207
Li Z, Chen F, Huang C, Zheng W, et al. (2017). Genome-wide mapping and characterization of microsatellites in the swamp eel genome. Scientific Reports. 7:3157. https://doi.org/10.1038/s41598-017-03330-7 .
Srivastava S, Kushwaha B, Prakash J, Kumar R, et al. (2016). Development and characterization of genic SSR markers from low depth genome sequence of Clarias batrachus (magur). Journal of Genetics. 95: 603-609. https://doi.org/10.1007/s12041-016-0672-8
Qi WH, Jiang XM, Du LM, Xiao GS, et al. (2015). Genome-Wide Survey and Analysis of Microsatellite Sequences in Bovid Species. PLoS One. 10: e0133667. https://doi.org/10.1371/journal.pone.0133667
Truelove N, Behringer DC, Butler Iv MJ, Preziosi RF (2016). Isolation and characterization of eight polymorphic microsatellites for the spotted spiny lobster, Panulirus guttatus. Peer J. 4: e1467. https://doi.org/10.7717/peerj.1467
Pardo BG, Fernandez C, Hermida M, Vazquez-Lopez A, (2007). Development and characterization of 248 novel microsatellite markers in turbot (Scophthalmus maximus). Genome. 50, 329-332. https://doi.org/10.1139/g06-154
Genetics and Molecular Research 17 (1): gmr16039880
Kim KS, Noh CH, Moon SJ, Han SH (2016). Development of novel tetra- and trinucleotide microsatellite markers for giant grouper Epinephelus lanceolatus using 454 pyrosequencing. Molecular Biology Reports. 43: 541-548. https://doi.org/10.1007/s11033-016-3980-4
Landinez-Garcia RM, Marquez EJ (2016). Development and characterization of 24 polymorphic microsatellite loci for the freshwater fish Ichthyoelephas longirostris (Characiformes: Prochilodontidae). Peer J. 4: e2419. https://doi.org/10.7717/peerj.2419
Li BB, Li ZB, Shangguan JB, Ning YF (2016). Screening and characterization of novel microsatellite loci in Lateolabrax japonicus. Genetics and Molecular Research.15 https://doi.org/10.4238/gmr15048378
Ferreira DG, Galindo BA, Alves AN, Almeida FS (2013). Development and characterization of 14 microsatellite loci in the Neotropical fish Geophagus brasiliensis (Perciformes, Cichlidae). Journal Fish Biology. 83:1430-1438. https://doi.org/10.1111/jfb.12227
Huang YS, Li ZB, Ning YF, Shangguan JB, et al. (2015). Isolation and characterization of microsatellite loci in hybrid giant tiger grouper. Genetics and Molecular Research. 14: 14706-14710.
McWilliam RA, Adams KR, Minchinton TE, Ayre DJ (2016). Characterization of 11 Polymorphic Microsatellite Markers for Black Drummer (Girella elevata) Developed Using 454 Next-Generation Sequencing. Journal of Heredity. 107: 670-673.