Determining the Prevalence and Causes of Cesarean
Section in the Ahvaz Amir-a-lmomenin Hospital affiliated to
the Social Security Organization in 2009
NASRIN SAADATI
1*, MOSTAFA ALBOKORDI
2and MOHAMAD HADI MOHAMADI
31Department of Community Medicine, School of Medicine, Fertility and Infertility Research Center, Ahvaz Jundishapur University of Medical Sciences, Ahvaz, Iran.
2Social Medicine Department, Medical School, Ahvaz Jundishapur University of Medical Sciences, Ahvaz, Iran.
3School of Medicine, Ahvaz Jundishapur University of Medical Sciences, Ahvaz, Iran. DOI: http://dx.doi.org/10.13005/bpj/873
(Received: September 15, 2015; accepted: November 03, 2015) ABSTRACT
Cesarean section is the commonest surgery in gynecology and it is one method of pregnancy termination. An overview of cesarean section status in world shows that its rate is very high. The published reports of cesarean status in Iran also indicate very high rate. Therefore, this study aimed to investigate cesarean section rate and the main influencing factors among patients referred to Amiralmomenin Hospital in Ahvaz, Iran. This is a descriptive and cross sectional retrospective study. The data’s from all of patients that undergo cesarean section in year 2009 registered in questionnaire arranged before. Then the data’s analyzed with descriptive indexes and spss-16 program. Of 9753 case that %51.6 of those was natural delivery and 48.4% of those was performed by cesarean section. In this study 59.27% of women had a history of previous cesarean section. Majority of cesarean section indications arranged by rate were previous cesarean section (59.27%), thick meconium stain (11.5%), non-cephalic presentation (6.26%), dystocia (5.47%), CPD (3.8%) and fetal distress (2.64%). Near half of pregnancy termination is performed by cesarean section where the most common cause of this rate is previous history of cesarean section.
Key words: Cesarean section, Indication, Rate.
INTRODUCTION
Pregnant women delivery happens in vaginal and Caesarean ways. Four common reason for cesarean are repeated cesarean, dystocia or disorder in the development of vaginal delivery, breech presentation and fetal distress (1). The cesarean rate is different in different statistics. In Brazilian government centers, it is 25 percent in Chile, 27 to 28% and in 19 countries in Latin America, cesarean rates have been reported between 16.8 and 40% (2-4). Given that international acceptable level for Caesarean section delivery is 25 percent (5), statistics show higher percent of cesarean rate in Iran (6-9).
Repeating cesarean now includes more than 35% of Caesarean sections in the United States. Dystocia, fetal distress, breech presentation and other obstetric conditions are the most common indication for primary cesarean delivery in most cases. Recently, indications such as meningomyelocele and special degrees of hydrocephalus, which are of treatable anomalies of the fetus, have been added to previous indications (10, 12, 13, 16). Some side post-delivery effects such as unexplained fever, endometritis, wound infection, bleeding, aspiration, atelectasis, urinary tract infection and thrombophlebitis and pulmonary embolism are seen in 25 percent of women who delivered by cesarean delivery.
Late complications of cesarean delivery in the mother include bowel obstruction due to adhesions and cutting uterine rupture in subsequent pregnancies. Both of these complications are more common in the traditional cutting than lower uterine segment incision (16). There is no doubt that in case of emergency, cesarean delivery is necessary to reduce maternal and neonatal mor tality, but as research and investigations have shown natural childbirth with all its identified benefits is replaced by the surgeries with greater complications. According to statistics
provided, the prevalence of caesarean section in private hospitals is significantly greater than in academic hospitals (8). On the other hand, because of the lack of cooperation from the private hospitals in providing accurate statistics and lack of access to their real information, this study has been conducted in Imam Ali Hospital of social security of Ahwaz that is referral hospital for families covered by social security and has a state between university and private hospitals so that intermediate statistics results are obtained, and prospects for cesarean status in these centers is drawn as well.
MATERIALS AND METHODS
This study is a descriptive cross-sectional study, in which the population under study is all women referring to Imam Ali Hospital (pbuhs) of Social Security in 2009 for childbirth. Completing the form data collection was through referring to patients’ medical records and the data was analyzed by statistical software spss16. Data collection form was based on the views of a number of social medicine specialists, women, and by referring to studies of the same kind and content validity.
Table 1: Relative and absolute frequency distribution of the subjects according to
the type of delivery
Type of delivery Frequency Percent
Natural 5026 51.6
Caesarian 4727 48.4
Total 9753 100
Table 2: Relative and absolute frequency distribution of the subjects by age
Age Frequency Percent
≤≤≤≤≤19 496 10.5
20-24 1986 42
25-29 2005 28.5
30-34 661 14
≤≤≤≤≤34 236 5
Total 4727 100
Table 3: Absolute and relative frequency of cesarean women by location Location Frequency Percent
Village 993 21
City 3734 79
Total 4727 100
Table 4: Absolute and relative frequency distribution of cesarean women based on
their jobs
Pregnant Frequency Percent women job
Housewife 3947 83.5
Employed 780 16.5
Table 5: Absolute and relative frequency of cesarean women in terms education Level of education Frequency Percent
Illiterate 345 7.3
Elementary 1277 27
Guidance 1049 22.2
Diploma 1281 27.1
University education 775 16.4
Total 4727 100
Table 6: Absolute and relative frequency of cesarean women based on maternal, fetal,
maternal-fetal causes Reason Frequency Percent
Maternal 3223 68.2
Fetal 1065 9.3
Maternal-fetal 439 22.5
Total 4727 100
Table 7: Absolute and relative frequency of maternal causes in women undergoing
cesarean for maternal causes Maternal causes Frequency Percent
Previous caesarian 2802 87.2
Medical and surgical causes 150 4.66
Late delivery 118 3.67
Lack of delivery progression 97 3 Lack of response to induction 26 0.8
Advanced maternal age 20 0.62
Total 3213 100
Table 8: Absolute and relative frequency of cesarean delivery of women for fetal causes
membranes
Reason Frequency Percent
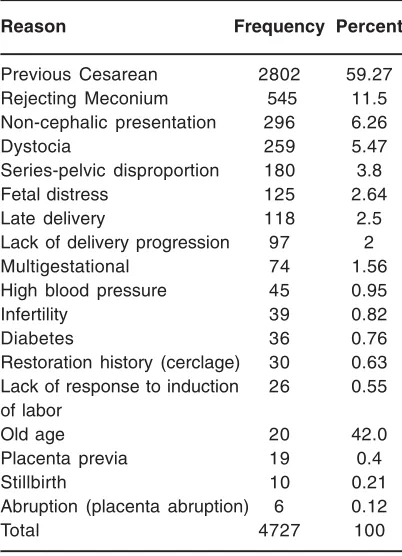
Previous Cesarean 2802 59.27
Rejecting Meconium 545 11.5
Non-cephalic presentation 296 6.26
Dystocia 259 5.47
Series-pelvic disproportion 180 3.8
Fetal distress 125 2.64
Late delivery 118 2.5
Lack of delivery progression 97 2
Multigestational 74 1.56
High blood pressure 45 0.95
Infertility 39 0.82
Diabetes 36 0.76
Restoration history (cerclage) 30 0.63 Lack of response to induction 26 0.55 of labor
Old age 20 42.0
Placenta previa 19 0.4
Stillbirth 10 0.21
Abruption (placenta abruption) 6 0.12
Total 4727 100
RESULTS
This study examined 9753 pregnant women referring to a government center in Ahvaz for giving birth. Patients were divided into two groups based on the delivery method (Table 1).
Mothers in the study were categorized according to age as well (Table 2).
In the next step of evaluating cases, cesarean section women were classified based on the location (Table 3).
Cesarean section women were evaluated according to their job as well (Table 4).
Caesarean women were classified in terms of level of education (Table 5).
Causes of Caesarean section were evaluated in separation for maternal, fetal and maternal-fetal in mothers who were delivered by cesarean section (Table 6).
The frequency of maternal causes in women undergoing cesarean section are shown in Table 7
The frequency of fetal causes in cesarean women is shown in Table 8.
Table 9: Absolute and relative frequency of cesarean delivery in women with
maternal-fetal causes
Fetal causes Frequency Percent
Rejecting Meconium 545 51.17
Non-cephalic presentation 296 27.79
Fetal distress 125 11.73
Multigestational 74 6.94
Placenta previa 19 1.78
Abruption 6 0.56
Total 1065 100
Table 10: Relative and absolute frequency of overall causes of cesarean section in women Percent Frequency Causes
41 180 Failure to comply
pelvic series
59 259 Other dystocia cases
100 439 Total
Mothers studied were also classified by overall cesarean section reasons.
DISCUSSION AND CONCLUSION Cesarean birth is a way of birth for emergency and should not be thought that it is an alternative to natural childbirth. Cesarean birth side effects made the World Health Organization consider the favorable horizon of cesarean section in 2000 as 15% (5). In this study, 9753 women were admitted for delivery, of whom included 5026 patients (51.6 percent) had normal delivery, and 4727 patients (48.4 percent) had cesarean delivery. According to the results of other similar studies, the results of this study are consistent with the results of similar studies in our country, but the rate was higher than that of the United States (1, 9,15-18).
In this study, the mean age of women undergoing cesarean was 27.7 ± 5.2 years ranging from 14 to 44 years that was similar to some similar studies conducted in the country (1, 9, 17, 20).
In this study, the most common cause of cesarean were repeated cesarean delivery, rejecting thick meconium, non-cephalic presentations, dystocia, series-pelvic disproportion, fetal distress, and delayed delivery.
In the present study, like other similar studies, the most common obstetric cause of
cesarean section was repeated cesarean section (8, 20, 19).
In the process of investigating cases of cesarean in Amir Almomenin Hospital, no cesarean was seen by mother’s choice. Based on the above, it can be concluded that the most common cause of cesarean delivery in this study, like other studies, is repeated cesarean. However, unlike other studies, where a high percentage of cesarean sections was on maternal request, in this study, no cases of cesarean section has happened at the request of the mother, and investigation on the cause, can reduce the chance of cesarean section in the other medical centers.
The results showed that out of 4272cesarean sections, 3223 cases (68.2%) had maternal indications, 1065 cases (9.3%) fetal perfusion and 439 cases (22.5 %) maternal - fetal indication.
The prevalence of maternal indications were previous cesarean, surgery and medical causes including diabetes, maternal hypertension, infertility, uterine repair history, late delivery, lack of delivery progression, no response to induction and high mater nal age. The most common fetal indications were meconium rejection, noncephalic presentation, fetal distress, multiple pregnancy, placenta previa and placental abruption. Of maternal-fetal indications, 3.8% was related to mismatched pelvic series and 5.47% percent was due to other causes of dystocia.
determine the relationship between cesarean section and demographic characteristics. It is also recommended that this study be repeated in other hospitals and in this hospital in the years before or
after the study and the results be compared to get more information of the increase or decrease in the cesarean rate in this Hospital.
REFERENCES
1. Naseh, N. Prevalence of Cesarean and its complications in women referring to Vali Asr Hopital. Modern Care, Nursing and Midwifery Journal of Birjand University of Medical Sciences. 2010; 7: 17-1.
2. Nuttal CH. The cesarean culture or Brazil. Br Med J 2000; 320(12): 1080-1083.
3. Murray SF. Relation between private health insurance and high rates of cesarean section in Chile: qualitative and quantities study. Br med J 2000; 321(202): 1501-1505.
4. Belzian JM, Althabe F. Rate and implicationof cesarean section in Latin America Ecological study. Br med J 1999; 31(9): 1397-1400.
5. World Health Organization. Appropriate technology for brith. Lancet 1985; 4(5): 436-437.
6. Motamedi B, the Janghorban, M. Cesarean Prevalence and associated factors of Kerman. Journal of Medical Faculty Guilan University of Medical Sciences 2000; 33 and 34; 88.
7. Afshar, S. Dastfan F. Prevalence of vaginal delivery, cesarean section and its causes in the public and private treatment centers in Khorasan province. Journal of Obstetrics and Gynecology and Infertility 2008; 1: 45-40. 8. Shariat, M. The cesarean rate and its
influencing factors in the maternity hospital in Tehran. Monitoring. 2002; 1 (3): 10-5 9. Mohammad, A. The incidence of cesarean
section and demographic factors associated with it in Tabriz, 2006. Medical Journal of Tabriz University of Medical Sciences. 2006; 28: 105 101.
10. Liford RJ, Van Cooeverden de Groot HA, Moor PJ. The relative risk of cesarean section and pre-existing physiological disturbsnces. Br J of Obst&Gyn 1990; 9 (7): 833.
11. Bolbol Haghighi, N. Frequency of delivery
and its causes in the city anymore, 2000. Reproduction and fertility 2002; 1: 58-50. 12. Scott RJ, Philip J, Charles BH. Danforths
obstetr ic and gynecology. 7th ed. Philadelphia: JB Lippincott Company; 1994; 818.
13. Jodatti, AR. The study of 76 cases of cesarean section in East Azerbaijan province in Tabriz University of Medical Sciences. Summer 2000; 34 (46): 24-19. 14. NokhostinRouhi, P, Abbasgholizadeh N.
Investigate the causes of caesarean section in the first half of 2001 in Alavi hospital. Professional doctorate (thesis). Ardabil University of Medical Sciences; 2001. 15. Shakerian, B. Frequency of Cesarean doing
in Chaharmahal Bakhtiari year 2001. Monitoring. Journal of Medical Sciences. 2004; 6 (1): 24-1.
16. F. Gray Cunningham. Cesarian delivery and post partum hysterectomy. In:Cunningham f et al. Editor. Williams obstetrics.22nd ed.united states of america: prentice-hall international inc.2005. 619-630.
17. Tamouk, A. The cesarean rate and indications of the social security hospital, Ardabil, 2003. Journal of Ardabil University of Medical Sciences 1382; 8: 31-1.
18. James R. Scott, T. Flint Porter. Cesarian delivery. In: Danforth d et al. , editor. Danforth‘s obstetrics and gynecology. 9th ed. United states of America;2008. 680-695.
19. Tatari, F. Comparison of the frequency of cesarean section in pregnant women admitted to private hospitals and training of Mashhad. Journal of Medical Sciences 2006; 12 (42 and 43): 30-1.