Infogain Publication (Infogainpublication.com) ISSN: 2454-1311
Cooperative Spectrum Sensing Technique Based
on Blind Detection Method
B. Vijayalakshmi
1, P. Siddaiah
21GVP College of Engineering for Women, Visakhapatnam, India,
2Acharya Nagarjuna University (ANU), Guntur, India
Abstract— Spectrum sensing is a key task for cognitive radio. Our motivation is to increase the probability of detection of spectrum sensing in cognitive radio. The spectrum-sensing algorithms are proposed based on the statistical methods like EVD,CVD of a covariance matrix. In this Two test statistics are then extracted from the sample covariance matrix. The decision on the signal presence is made by comparing the two test statistics.The Detection probability and the associated threshold are found based on the statistical theory. In this paper, we study the collaborative sensing as a means to improve the performance of the proposed spectrum sensing technique and show their effect on cooperative cognitive radio network. Simulations results and performances evaluation are done in Matlab and the results are tabulated.
Keywords— Cooperative Spectrum, Cognitive radio, Spectrum Sensing, Eigenvalue-based Detection.
I. INTRODUCTION
The electromagnetic spectrum comprises of frequency spectrum with varied bandwidths. The radio frequency spectrum involves electromagnetic radiation with frequencies between 300 Hz to 3000 GHz. The use of electromagnetic spectrum is licensed by governments for wireless and communication technologies. Spectrum scarcity is the main problem as the demand for additional bandwidth is going to increase. Measurement studies have shown that the licensed spectrum is relatively unused across
many time and frequency slots. The Federal
Communications Commission (FCC) published a report prepared by Spectrum Policy Task Force (SPTF) This report indicates that most of the allotted channels are not in use most of the time and some are partially occupied while others are used most of the time. One of the most important and recommended solution for the problem of spectrum scarcity is cognitive radio (CR) as described by Joseph Mitola in his doctoral dissertation Cognitive radio technology is considered as the best solution because of its ability to rapidly and autonomously adapt operating
parameters to changing requirements and conditions Main functions of cognitive radio are spectrum sensing, spectrum management, spectrum mobility and spectrum sharing. Spectrum sensing detects the unused spectrum. There are several spectrum sensing techniques that were proposed for cognitive radio. These techniques are mainly categorized into two:
1) Blind sensing techniques
2) Signal specific sensing techniques
While the blind sensing techniques don’t need any prior knowledge about the transmitted signal, signal specific sensing techniques need some information about the features of the signal such as carrier frequency, symbol period, modulation type, etc. This classification leads to decide whether one of these choices best fit the CR.The method does not need channel and signal information as prior knowledge. has better performance compared with eigenvalue without noise power. The proposed method has a higher probability of detection at low SNR compared with Maximum eigenvalue. In this paper a new scheme of the algorithms are implemented using random matrix theories (RMT) which produce accurate results. The sensing based on the concept of sample covariance matrix and eigenvalues is proposed. The ratios of distributions and probabilities of detection (Pd) and the probabilities of false alarm (Pfa) are calculated for the proposed algorithms. Thresholds values for given Pfa are also established Also several simulations are done based on the sample covariance matrix we extract the test statistics and compare the results..
International Journal of Advanced Engineering, Management and Science (IJAEMS) [Vol-2, Issue-10, Oct- 2016] Infogain Publication (Infogainpublication.com) ISSN: 2454-1311
II. SPECTRUM SENSING BASED ON
STATISTICAL MODEL
The system comprises of a receiver/detector with an antenna which is connected to signal processing unit to process the signal. The received signal is sent to the processing unit by an antenna. For detecting the signal, we have used hypothesis testing. There are two hypothesis namely H0 or null hypothesis and H1 or alternate hypothesis. H0 is the representation for signal which is not present or the signal which only has noise. H1 is the representation where both signal and noise are present at same time. The probability of detection and the probability of false alarm are important for channel sensing. Probability of false alarm(Pfa) describes the presence of the primary user at the hypothesis H0 where as probability detection(Pd) describes the presence of the primary user signal at the hypothesis H1.Blind Signal Processing is one of the spectrum sensing approaches which do not depend on the information of the primary signal or noise and hence they are called as blind detection schemes. Two of the most popular blind detection schemes are the following :
• Covariance based spectrum sensing
• Eigen value based spectrum sensing
III. COVARIANCE BASED SPECTRUM
SENSING
Let xc(t) = sc(t) + ηc(t) be the continuous-time received signal, where sc(t) is the possible primary user’s signal and
ηc(t) is the noise. ηc(t) is assumed to be a stationary process satisfying
E(ηc(t)) = 0, E(η2c (t)) = σ2η, and E(ηc(t)ηc(t +τ )) = 0 for any τ _= 0.
We are interested in the frequency band with central frequency fc and bandwidth W. We sample the received signal at a sampling rate fs, where fs ≥ W. Let Ts = 1/fs be the sampling period. For notation simplicity, we define x(n) Δ= xc(nTs), s(n) Δ= sc(nTs), and η(n) Δ= ηc(nTs).
There are two hypotheses:
1) H0, i.e., the signal does not exist, and 2) H1, i.e., the signal exists.
The received signal samples under the two hypotheses are given by
H0 : x(n) =η(n) (1) H1 : x(n) =s(n) + η(n) (2)
respectively, where s(n) is the transmitted signal samples that passed through a wireless channel consisting of path loss, multi path fading, and time dispersion effects; and η(n) is the white noise, which is having mean zero and variance
σ2η. s(n) can be the superposition of the received signals from multiple primary users. No synchronization is needed here. diagonal elements of Rx should be nonzeros.
3.1 Covariance Based Spectrum Sensing Algorithm outline
Step 1 : The received signal is sampled, as described above. Step 2 : Choose a smoothing factor L and a threshold γ1, where γ1 should be chosen to meet the requirement for the probability of false alarm.
Step 3: Compute the autocorrelations of the received signal
λ(l), l = 0, 1, L − 1, and form the sample covariance matrix. Step 4; Compute rnn(Ns)) where rnm(Ns) are the elements of the sample covariance matrix ˆrx(Ns). Step 5: Determine the presence of the signal based on T1(Ns), T2(Ns), and threshold γ1. That is, if T1(Ns)/T2(Ns) > γ1, the signal exists; otherwise, the signal does not exist.
3.2 Eigen value based detection Eigen values are scalar values called lambda (λ) of a square matrix A, if there is a nontrivial solution of a vector x called eigen vector such that: (A -λI) x=0 Or (A- λI) =0. The idea of Eigen values is used in signal. Detection is to find the noise in signal samples by finding the correlation between samples. Ideally noise samples are uncorrelated with each other. When there is no signal, the received signal covariance matrix become identity matrix multiply by noise power (2I) which results all Eigen values of the matrix become same as noise power.The main advantage of Eigen value based technique is that it does not require any prior information of the PU’s signal and it outperforms Energy detection techniques, especially in the presence of noise covariance uncertainty. 3.3 Eigen value Detection Algorithms:
3.3.1 Maximum-Minimum Eigen value (MME)
Detection:
The algorithm steps for this detection method is as follow:
Step 1: Covariance Matrix of the received signal is calculated
Step 2: Maximum and Minimum Eigen values of the Matrix (λmax, λmin) are computed
Step 3: Decision: If λmax/λmin >γ1 “Signal exists”else “Signal doesn’t exit”whereγ1 Threshold value for MME Threshold value (γ) is set using Tracy-widom distribution which is adaptive technique to set the threshold and it is given by
Infogain Publication (Infogainpublication.com
The algorithm steps for this detection method is as follow:
Step 1: Covariance Matrix of the received signal is calculated
Step 2: Average power Pavgof received matrix is calculated
Step 3: Minimum Eigen values of the Matrix ( computed
Step 4: Decision: If Pavg/λmin >γ2 “Signal exists”
else “Signal doesn’t exit” whereγ2 Threshold value EME
Threshold value (γ2) is set using yamma distribution which is adaptive technique to set the threshold and it is given by
3.5Cooperative Spectrum Sensing
In data combination method, each SU make local decision based on its observed values compared with the chosen threshold, and then forward the local decision, denoted Di∈{0,1},to the FC to identify the PU is present or not. There are usually three combination method based on the decisions come from different cooperative users, such as OR rule, AND rule and K-out-of-N rule.For OR rule, if there just one SU to identify that the PU is active, the FC will declare the PU active. Thus the cooperative probability of detection Qd and probability of false alarm
where Pd,iPf,i are the SU local probability of detection and
probability of false alarm, N is the number of cooperative users.
Assume each SU achieves identical Pd and P
spectrum sensing (i.e., Pd=Pd,i ,Pf=Pf,i
cooperative probability of detection and probab alarm are
The cooperative missing probability is
Where Pm is the missing probability of local sensing user.
3.5.1 AND Rule:
AND rule is just opposite to OR rule, in which the FC will declare the PU active only when all cooperative users
Infogainpublication.com)
The algorithm steps for this detection method is as follow:
received signal is
of received matrix is calculated Step 3: Minimum Eigen values of the Matrix (λmin) is
2 “Signal exists”
2 Threshold value for
2) is set using yamma distribution which is adaptive technique to set the threshold and it is given by:
In data combination method, each SU make local decision d with the chosen threshold, and then forward the local decision, denoted {0,1},to the FC to identify the PU is present or not. There are usually three combination method based on the decisions come from different cooperative users, such as N rule.For OR rule, if there just one SU to identify that the PU is active, the FC will declare the PU active. Thus the cooperative probability of detection Qd and probability of false alarm Qfare
probability of detection and probability of false alarm, N is the number of cooperative
and Pf in the local
i=1,2,…N). The and probability of false
is the missing probability of local sensing user.
AND rule is just opposite to OR rule, in which the FC will declare the PU active only when all cooperative users
identify that the PU is present. Qd and Qf under AND rule are written as follows.
3.5.2 K-out-of-N rule : K-out-of-N rule is a trade
rule. In this rule, when more than K users show that the PU is active, the final decision of cooperative sensing is that the channel is occupied. So under K
Qf are
The cooperative missing probability is
Where Pm is the missing probability of local sensing user
IV. SIMULATION RESULTS
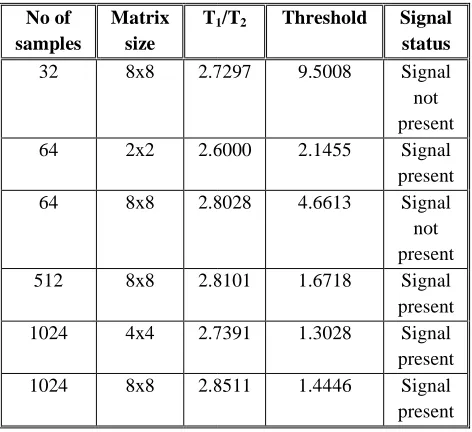
Covariance based detection
Table for covariance based detection
No of samples
Matrix size
T1
32 8x8 2.7297
64 2x2 2.6000
64 8x8 2.8028
512 8x8 2.8101
1024 4x4 2.7391
1024 8x8 2.8511
) ISSN: 2454-1311 identify that the PU is present. Qd and Qf under AND rule
N rule is a trade-off between OR rule and AND rule. In this rule, when more than K users show that the PU is active, the final decision of cooperative sensing is that the channel is occupied. So under K-out-of-N rule, the Qd and
The cooperative missing probability is
is the missing probability of local sensing user
SIMULATION RESULTS ovariance based detection
Table for covariance based detection
1/T2 Threshold Signal
status
2.7297 9.5008 Signal
not present
2.6000 2.1455 Signal
present
2.8028 4.6613 Signal
not present
2.8101 1.6718 Signal
present
2.7391 1.3028 Signal
present
2.8511 1.4446 Signal
International Journal of Advanced Engineering, Management and Science (IJAEMS) [Vol-2, Issue-10, Oct- 2016] Infogain Publication (Infogainpublication.com) ISSN: 2454-1311 EME:
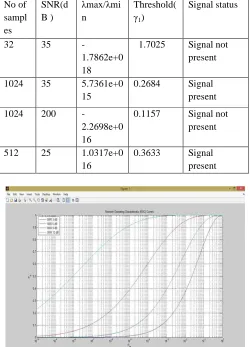
Table for maximum minimum eigen value method No of
samples SNR (dB )
λmax/λ min
Thresho ld(γ1)
Signal status
32 35
-1.7862e +018
1.7025 Signal not present
1024 35 5.7361e
+015
0.2684 Signal present
1024 200
-2.2698e +016
0.1157 Signal not present
MME:
Table for energy with minimum eigen value method
Fig 7.5 MME: PD V/S PF for different SNR value
Fig 7.6: COOPERATIVE: PM V/S PF for single SNR value
Fig. 7.7: COOPERATIVE: PM V/S PF for different SNR value
Fig.7.8: COOPERATIVE: PD V/S PF (AND, OR FUSION TECHNIQUE
V. CONCLUSIONS
In this paper, several blind spectrum sensing methods based on dimension analysis is explained in detail. Specifically, collaborative sensing is considered as a solution to problems in the presented sensing method.The sensing detector of spectrum space create new opportunities and challenges for this type of cooperative spectrum sensing while it solves some of the traditional problems .We also propose a new eigenvalue spectrum sensing algorithm based on covariance matrix. The ratio of the minimum eigenvalue No of
sampl es
SNR(d B )
λmax/λmi n
Threshold( γ1)
Signal status
32 35
-1.7862e+0 18
1.7025 Signal not present
1024 35 5.7361e+0
15
0.2684 Signal
present
1024 200
-2.2698e+0 16
0.1157 Signal not
present
512 25 1.0317e+0
16
0.3633 Signal
Infogain Publication (Infogainpublication.com) ISSN: 2454-1311 to noise power is used as test statistic the method need only
noise power. The proposed method is better than maximum eigenvalue detection and the energy detection for correlated signals. By use of several parameters we have performed simulations investigated the detection time of the analysis.
REFERENCES
[1] Yonghong Zeng, and Ying-Chang Liang “Eigenvalue based Spectrum Sensing Algorithms for Cognitive Radio” Communications,IEEE Transactions on June 2009.
[2] Yonghong Zeng, and Ying-Chang Liang “Spectrum-Sensing Algorithms for Cognitive Radio Based on Statistical Covariances ” IEEE
[3] “Discrete Wavelet Packet Transform based Energy Detector for Cognitive Radios” by Youngwoo Youn, Hyoungsuk Jeon, Hoiyoon Jung and Hyuckjae Lee [4] Mr. Pradeep Kumar Verma, Mr. Sachin Taluja,Prof.
Rajeshwar Lal, “Performance analysis of Energy detection, Matched filter detection & Cyclostationary feature detection Spectrum Sensing Techniques [5] A. M. Tulino and Sergio Verdu, Random Matrix
Theory and Wireless Communications. Hanover, USA: now Publisher Inc. 2004.
[6] Andrzej Cichocki and Shun ichi Amari, Adaptive Blind Signal and Image Processing. West Sussex,England: John Wiley & Sons Ltd. 2002. [7] YongHong Zeng and Ying-Chang Laing,
“Maximum-Minimum Eigenvalue Detection forCognitive Radio”, IEEE PIMRC, 2004.
[8] B. Rawat, B. B. Bista, S. Shetty, and G. Yan. Waiting Probability Analysis for Dynamic Spectrum Access in Cognitive Radio Networks. In Proceedings of the 7th International Conference on Complex, Intelligent, and Software Intensive System (CISIS 2013) July 3rd - July 5th, 2013, Taichung, Taiwan.