Analyzing a few Heuristic Algorithms Considering
Machine Idle Time and Processing Time in Permutation
Flow Shop Scheduling Problems
Baskar A
Research Scholar SMBS, VIT UniversityVellore, India
Anthony Xavior M
Professor SMBS, VIT UniversityVellore, India
ABSTRACT
Flow Shop Scheduling has been an interesting field of research for over six decades. They are easy to formulate, yet difficult to solve. In a shop, there are ‘m’ machines arranged in series to process a set of ‘n’ jobs having different processing times. Each job has to pass through each machine, in order. The problem is to find a sequence of jobs to be processed in all the machines, so that a given performance parameter is optimized. The total number of schedules is (n!)m. If the order of machines is not to be changed, the problem is simplified, and the overall number of solutions is reduced to n!. This problem is referred to a permutation flow shop scheduling problem, or PFSP in short. Starting from two machines, ‘n’ jobs, various Heuristics have been proposed over the years. After the invention of meta heuristics and evolutionary algorithms, and increased computational capabilities available today, finding optimal/ near optimal solutions become comparatively easier. In this paper, a few heuristic algorithms have been analyzed for makespan criterion considering machine idle time and processing time, by comparing the results with the well known CDS algorithm. Benchmark problems proposed by Taillard and Ruben Ruiz are used for the performance analysis.
Keywords
Heuristic Algorithm, Flow Shop Scheduling, Makespan, Benckmark Problems.
1.
INTRODUCTION
A typical permutation flow shop scheduling problem involves the determination of the order of processing the required jobs with different processing times over different machines. The parameter to be optimized may be anything; the most popular one being, minimizing the makespan. The sequence is not changed and kept the same for all the machines. For the makespan minimization, the problem is NP-complete, if the number of machines is greater than two [1].
In the simplified PFSP, a number of assumptions are usually made [2]:
All the jobs are independent, and available for processing at time zero.
All the machines are continuously available.
Each machine can process at most one job at a time, and each job can be processed only on one machine at a time.
No preemption is allowed.
Setup times are sequence independent, and are included in the processing times or are otherwise ignored.
An infinite in-process storage buffer is assumed. If a given job needs an unavailable machine, then it joins a queue of unlimited size waiting for that machine.
Most of the optimization criteria are based on the completion times of the jobs at the different machines, which are denoted by Cj,i, where Cj refers the time at which job j is completed at the last machine. The completion times Cj,i can be easily calculated as follows:
For a given permutation π of n jobs, where π(j) denotes the job in the j-th position, the completion times are calculated with the following expression:
C π(j),i=max[C π(j),i-1, C π(j-1),i] + p π(j),i
This paper considers minimization of maximum completion time (makespan, Cmax). Under this objective, the problem is denoted as F/prmu/Cmax. Johnson’s [3] paper mainly studied problems with two machines and provides the optimal solution. Slope Index algorithm was proposed by Palmer [4]. The CDS algorithm [5] proposed by Campbell et al. is based on the Johnson’s algorithm and obtains the solution in (m-1) enumerations. The algorithm proposed by Dannenbring [6] reduces the ‘m’ machines, ‘n’ jobs problems in to a two machine, ‘n’ jobs problem and then uses the Johnson’s rule to obtain the solution.
The NEH algorithm proposed by Nawaz et al. [7] is considered as the best among the simple heuristics, according to many studies conducted over the past decades, like by Turner and Booth [8], Taillard [9] and Ruiz and Maroto [10]. The number of enumerations in NEH algorithm is [n(n+1)/2]-1 and applies insertion technique. The solution is built from first two jobs selected from the initial sequence obtained by arranging all the jobs in ascending order of their total processing times. The NEH Algorithm for the minimization of the makespan can be stated as follows:
Step 1:
Ordering the jobs by non increasing sums of processing times on the machines;
Taking the first two jobs, and scheduling them in order to minimize the partial makespan, as if there were only these two jobs
Step 3:
For k= 3 to n, Step 4 to be repeated Step 4:
Inserting the kth job at the place, which minimizes the partial makespan among the possible ones.
Total number of sequences to be enumerated = [n(n+1)/2] – 1. Many researchers have analyzed and modified the NEH algorithm to improve the makespan. The authors have also proposed a family of NEH heuristics to improve the makespan further.
In addition to the processing time, machine idle time is also another important element in deciding the quality of the solution. Framinan et al. [11] considered 176 approaches for every objective function. Additionally, for every objective function, the RANDOM choice of a sequence is considered. For the 177 different approaches to generate the initial sequences, and for every combination of n = 5, 6, 7, 8, 10, 15, 20, 25, 30, 50, 75, 100 jobs, and m = 5, 10, 15, 20, 25 machines, 100 problem instances were generated. Therefore, 6000 problem instances were considered. The processing times were drawn randomly as integers from a discrete uniform distribution between 1 and 99. It was concluded that for the makespan, the best five heuristic algorithms consists of the NEH-insertion approach using the following five initial sequences:
SUM PIJ / DECR (i.e. original NEH) Rank 1. SS SRA/2SRN / DECR Rank 3.
SS SRS/RCN / DECR Rank 4. SS SRA/RCN / DECR Rank 5. RA C3 / INCR Rank 7.
It may be noted that in the top four cases, the decreasing order proves to be better.
SUM PIJ/ DECR: total processing times of the jobs, decreasing order (This indicator value is exactly the one used in the original NEH approach.)
SS SRA/2SRN/ DECR: sum of the absolute residuals with negative residuals weighted double, no carryover, decreasing order
SS SRS/RCN/ DECR: sum of the squared residuals with negative residual carryover, decreasing order
SS SRA/RCN/ DECR: sum of the absolute residuals with negative residual carryover, decreasing order
RA C3/INCR: sum of possible waiting time of jobs and idle time of machines, increasing order.
The sorting sequences are unlimited, and important were covered by Framinan et al. The authors have considered twenty three starting sequences, combining the total processing time, and the total Machine Idle Time. In all the cases, the insertion technique was used. However, unlike the original NEH, which selects the first two jobs as the initial
sequence, the first and the last jobs, the middle two jobs and the last two jobs were also considered for the analysis.
This paper analyzes a few heuristic algorithms built using various combinations of the machine idle time and the processing time. They are different from the above discussed algorithms.
2.
HEURISTIC ALGORITHMS
ANALYZED
Many classic heuristics consider only the processing time, and give the result using different approaches. As all are aware of, the heuristic algorithms are approximate methods, and the PFSP is NP complete, it cannot be explicitly stated that a particular heuristic can always report an optimal/ near optimal solution. In addition to the NEH heuristic, which is the best among the available simple heuristics, CDS also performs reasonably better. The complexity level and the quality of the simple heuristics have been studied in detail by Taillard [9], and are briefly given below:
Complexity Quality
Problems - 500 100 100 100 50 50
Jobs n 9 10 20 20 40 50
Machines m 10 10 10 20 10 10
Gupta nlog(n) + nm
13.4 12.8 19.6 18.8 18.9 17.1
Johnson nlog(n) + nm
10.9 11.8 16.7 16.8 17.3 16.3
RA nlog(n) + nm
8.5 9.1 12.5 13.4 13.5 11.2
Palmer nlog(n) + nm
8.3 9.0 13.3 12.5 10.9 10.7
CDS nm2+ nlog(n)
4.5 5.2 9.7 8.6 9.9 9.3
NEH n2m 2.1 2.2 3.9 3.8 2.6 2.1
NEH appears to be the best polynomial heuristic in practice. The CDS algorithm which is in the second place also performs better. The heuristics, RA or Palmer may also be useful when short computation times are required.
For the algorithms considered, the overall performance is assessed using a set of benchmark problems totaling 120 in number proposed by Taillard [12], and 250 in number proposed by Ruben Ruiz (2009). The processing time varies from 1 to 99 units and generated using a random number generator for a given seed. Codes were generated, run in an i5 PC with 4 GB RAM, and the following nine cases were analyzed:
1. CDS original algorithm
2. Total idle time in ascending order for all the machines, when a particular job is processed 3. Total idle time in descending order for all the
machines when a particular job is processed 4. Total processing time in ascending order for a
particular job
5. Total processing time in descending order for a particular job (NEH initial sequence)
6. Total Machine idle time + Total processing time (IT+PT), in ascending order
8. Ratio of machine idle time to total processing time (IT/PT), in ascending order
9. Ratio of machine idle time to total processing time, in descending order
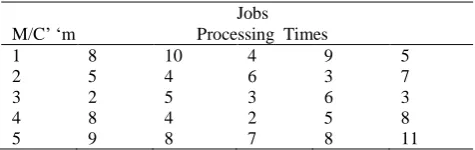
The jobs were scheduled based on the above and the corresponding makespans were computed. The method of computing a special category of total machine idle time and the usual total processing time is illustrated using an example given in Table 1.
Table 1, Example PFSP (5 machines, 5 jobs)
Jobs M/C’ ‘m Processing Times
1 8 10 4 9 5
2 5 4 6 3 7
3 2 5 3 6 3
4 8 4 2 5 8
5 9 8 7 8 11
Processing of Job 1: 0-8 units (M1) 8-13 units (M2) 13-15 units (M3) 15-23 units (M4) 23-32 units (M5).
Total machine Idle Time if job 1 is processed first: M1-0; M2-8; M3-13; M4-15; M5-23 and
Total Machine Idle Time: (0+8+13+15+23) = 59 units. Similarly,
Total Machine idle time when Job No. 2 is processed first: 66 units
Total Machine idle time when Job No. 3 is processed first: 42 units
Total Machine idle time when Job No. 4 is processed first: 62 units
Total Machine idle time when Job No. 5 is processed first: 55 units
Total processing time for finishing Job no. 1: (8+5+2+8+9) = 32 units and
Total processing time for finishing Job no. 2: 31 units Total processing time for finishing Job no. 3: 22 units Total processing time for finishing Job no. 4: 31 units Total processing time for finishing Job no. 5: 34 units
The total machine idle time array for the problem is, [59 66 42 62 55] for the jobs from 1 to 5 respectively.
Similarly, the total processing time array is [32 31 22 31 34].
In the algorithm using the ratio of machine idle time to total processing time (IT/PT), in ascending order (serial number 8 above), the ratio array is [1.8438 2.1290 1.9091 2.0000 1.6176]. The ratio array is sorted in ascending order, and a sequence of (5 1 3 4 2) with a makespan of 66 units (Table 2) is obtained. In the similar way, other procedures can easily be converted in to algorithms for computing the sequence and the corresponding makespan. The problem instances proposed by Taillard and Ruben Ruiz are used for the complete analysis of all the nine heuristic algorithms.
Table 2, Makespan for the sequence 5-1-3-4-2
Machines Job Processing Times
5 0-5 5-12 12-15 15-23 23-34
1 5-13 13-18 18-20 23-31 34-43
3 13-17 18-24 24-27 31-33 .43-50
4 17-26 26-29 29-35 35-40 50-58
2 26-36 36-40 40-45 45-49 58-66
3.
ANALYSIS OF THE PERFORMANCE
USING THE TAILLARD BENCHMARK
PROBLEMS
Initially, all the algorithms were tested for the makespan requirement. The complete results are shown for twenty Taillard problem instances in Tables 3 and 4. MS1 represents the makespan obtained using the first algorithm, the CDS algorithm and so on. It was found that, the CDS, and the algorithm based on the ratio of machine idle time to total processing time in ascending order, perform better in most of the cases for the makespan objective. Hence, other results are not listed. Only the results from these two algorithms are completely tabulated from Tables 5 to 8, and the summary for the problems are shown in Table 11. It may be noted that Taillard listed the lower bounds for the 120 number problem instances and the lower bounds for the Ruben Ruiz problems are calculated by the authors. However, since the makespan values obtained from the CDS algorithm are taken as the reference values, these lower bounds are not considered anywhere in this paper.
4.
ANALYSIS OF THE PERFORMANCE
USING THE TAILLARD BENCHMARK
PROBLEMS
Ruben Ruiz (2009) bench mark problems are available on web page for the research group "Sistemas de Optimización Aplicada SOA" [13] or Applied Optimization Systems: http://soa.iti.es. Taillard benchmark is composed of 12 groups of 10 instances each, totaling 120 instances. The groups, presented in the form of (jobs x machines), are {20, 50, 100}×{5, 10, 20}, 200× {10, 20} and 500× 20. As this is incomplete as on today, in the sense that some combinations of ‘n’ and ‘m’ are missing, Ruben Ruiz problems are also used in addition. They were developed originally for no-idle flow shop scheduling problem, and are adapted for our permutation flow shop scheduling analysis. The benchmark has 250 instances, where 10 combinations of, n = {50, 100, 150, 200, 250, 300, 350, 400, 450, 500} jobs, and five combinations of, m = {10, 20, 30, 40, 50} machines. There are five replicates per combination. The processing times are uniformly distributed in the range [1, 99], similar to the Taillard instances.
Table 3, Makespans for first set of 10 problems
Instance MS1 MS2 MS3 MS4 MS5 MS6 MS7 MS8 MS9
ta001 1390 1377 1589 1472 1556 1377 1601 1384 1691
ta002 1424 1469 1661 1538 1594 1481 1690 1437 1699
ta003 1249 1463 1464 1499 1408 1473 1461 1191 1747
ta004 1418 1466 1781 1640 1723 1547 1773 1420 1854
ta005 1323 1395 1635 1437 1592 1387 1594 1338 1718
ta006 1312 1372 1655 1457 1604 1373 1625 1313 1668
ta007 1393 1516 1560 1504 1479 1547 1554 1360 1549
ta008 1341 1426 1647 1422 1531 1415 1593 1300 1837
ta009 1360 1352 1682 1585 1538 1396 1669 1426 1873
ta010 1164 1325 1604 1365 1387 1329 1551 1208 1690
Table 4, Makespans for last set of 10 problems
Instance MS1 MS2 MS3 MS4 MS5 MS6 MS7 MS8 MS9
ta111 28246 29075 31898 30694 30363 28914 31836 28149 33365
ta112 29131 29928 31994 31435 31061 29898 31986 29326 34607
ta113 28618 29700 31862 30786 30205 29826 32004 28187 34177
ta114 29029 29119 32346 30546 31071 29263 32621 27884 33438
ta115 28234 29139 32128 30570 30376 28963 32027 27891 34389
ta116 28687 28885 32264 30072 30811 28735 32141 28257 33811
ta117 28322 28624 32191 30640 30698 28834 32251 28029 33796
ta118 28897 29223 32640 30804 30658 29065 32296 28632 33635
ta119 28294 28639 32226 30239 30442 28718 32228 27775 33784
ta120 28710 28966 31630 30070 30936 29053 31827 28122 33874
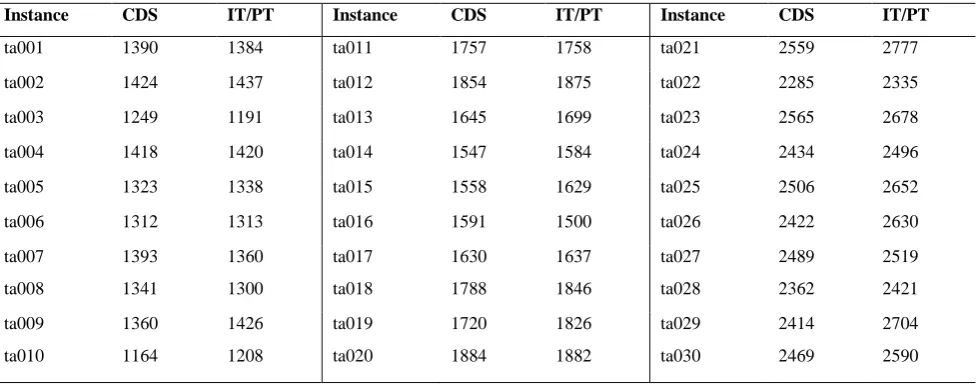
Table 5, Twenty Jobs PFSPs
Instance CDS IT/PT Instance CDS IT/PT Instance CDS IT/PT
ta001 1390 1384 ta011 1757 1758 ta021 2559 2777
ta002 1424 1437 ta012 1854 1875 ta022 2285 2335
ta003 1249 1191 ta013 1645 1699 ta023 2565 2678
ta004 1418 1420 ta014 1547 1584 ta024 2434 2496
ta005 1323 1338 ta015 1558 1629 ta025 2506 2652
ta006 1312 1313 ta016 1591 1500 ta026 2422 2630
ta007 1393 1360 ta017 1630 1637 ta027 2489 2519
ta008 1341 1300 ta018 1788 1846 ta028 2362 2421
ta009 1360 1426 ta019 1720 1826 ta029 2414 2704
Table 6, Fifty Jobs PFSPs
Instance CDS IT/PT Instance CDS IT/PT Instance CDS IT/PT
ta031 2816 2743 ta041 3421 3415 ta051 4328 4291
ta032 3032 2943 ta042 3246 3286 ta052 4216 4250
ta033 2703 2698 ta043 3280 3403 ta053 4189 4214
ta034 2884 2913 ta044 3393 3461 ta054 4280 4278
ta035 3038 2945 ta045 3375 3366 ta055 4122 4382
ta036 3031 3065 ta046 3400 3404 ta056 4267 4202
ta037 2969 2821 ta047 3520 3543 ta057 4134 4355
ta038 2835 2779 ta048 3387 3275 ta058 4262 4394
ta039 2784 2706 ta049 3251 3278 ta059 4212 4390
ta040 2942 2915 ta050 3429 3341 ta060 4270 4239
Table 7, Hundred Jobs PFSPs
Instance CDS IT/PT Instance CDS IT/PT Instance CDS IT/PT
ta061 5592 5716 ta071 6209 6028 ta081 6920 7158
ta062 5563 5328 ta072 5873 5877 ta082 6977 7173
ta063 5493 5299 ta073 6024 6014 ta083 7229 7105
ta064 5273 5074 ta074 6377 6416 ta084 7062 7117
ta065 5461 5438 ta075 6018 6000 ta085 7113 7304
ta066 5259 5241 ta076 5744 6091 ta086 7283 7019
ta067 5557 5275 ta077 6201 6280 ta087 7147 7554
ta068 5387 5221 ta078 6234 6042 ta088 7235 7646
ta069 5758 5571 ta079 6349 6139 ta089 7196 7282
ta070 5723 5363 ta080 6387 6365 ta090 7164 7279
Table 8, Two Hundred and Five Hundred Jobs PFSPs
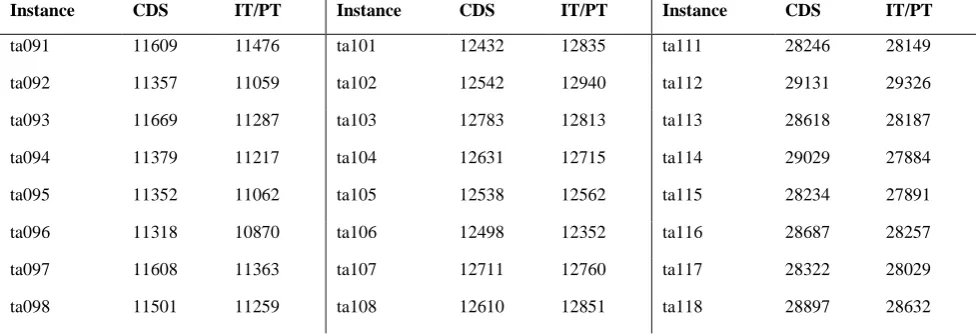
Instance CDS IT/PT Instance CDS IT/PT Instance CDS IT/PT
ta091 11609 11476 ta101 12432 12835 ta111 28246 28149
ta092 11357 11059 ta102 12542 12940 ta112 29131 29326
ta093 11669 11287 ta103 12783 12813 ta113 28618 28187
ta094 11379 11217 ta104 12631 12715 ta114 29029 27884
ta095 11352 11062 ta105 12538 12562 ta115 28234 27891
ta096 11318 10870 ta106 12498 12352 ta116 28687 28257
ta097 11608 11363 ta107 12711 12760 ta117 28322 28029
ta099 11252 10923 ta109 12639 12624 ta119 28294 27775
ta100 11509 11102 ta110 12949 12751 ta120 28710 28122
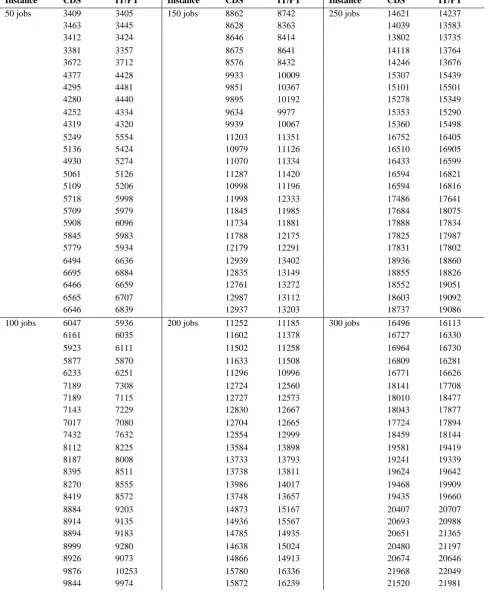
Table 9, 1 – 150 number of Ruben Ruiz Problems
Instance CDS IT/PT Instance CDS IT/PT Instance CDS IT/PT
50 jobs 3409 3405 150 jobs 8862 8742 250 jobs 14621 14237
3463 3445 8628 8363 14039 13583
3412 3424 8646 8414 13802 13735
3381 3357 8675 8641 14118 13764
3672 3712 8576 8432 14246 13676
4377 4428 9933 10009 15307 15439
4295 4481 9851 10367 15101 15501
4280 4440 9895 10192 15278 15349
4252 4334 9634 9977 15353 15290
4319 4320 9939 10067 15360 15498
5249 5554 11203 11351 16752 16405
5136 5424 10979 11126 16510 16905
4930 5274 11070 11334 16433 16599
5061 5126 11287 11420 16594 16821
5109 5206 10998 11196 16594 16816
5718 5998 11998 12333 17486 17641
5709 5979 11845 11985 17684 18075
5908 6096 11734 11881 17888 17834
5845 5983 11788 12175 17825 17987
5779 5934 12179 12291 17831 17802
6494 6636 12939 13402 18936 18860
6695 6884 12835 13149 18855 18826
6466 6659 12761 13272 18552 19051
6565 6707 12987 13112 18603 19092
6646 6839 12937 13203 18737 19086
100 jobs 6047 5936 200 jobs 11252 11185 300 jobs 16496 16113
6161 6035 11602 11378 16727 16330
5923 6111 11502 11258 16964 16730
5877 5870 11633 11508 16809 16281
6233 6251 11296 10996 16771 16626
7189 7308 12724 12560 18141 17708
7189 7115 12727 12573 18010 18477
7143 7229 12830 12667 18043 17877
7017 7080 12704 12665 17724 17894
7432 7632 12554 12999 18459 18144
8112 8225 13584 13898 19581 19419
8187 8008 13733 13793 19241 19339
8395 8511 13738 13811 19624 19642
8270 8555 13986 14017 19468 19909
8419 8572 13748 13657 19435 19660
8884 9203 14873 15167 20407 20707
8914 9135 14936 15567 20693 20988
8894 9183 14785 14935 20651 21365
8999 9280 14638 15024 20480 21197
8926 9073 14866 14913 20674 20646
9775 9753 15841 15841 21819 21965
9642 10189 15785 16023 21743 22048
9747 10079 15713 16190 21829 21487
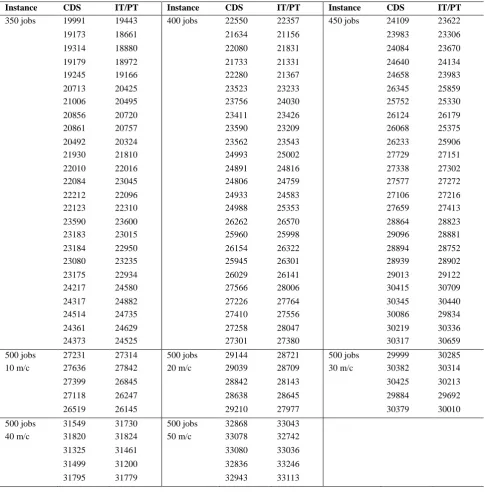
Table 10, 151 – 250 number of Ruben Ruiz Problems
Instance CDS IT/PT Instance CDS IT/PT Instance CDS IT/PT
350 jobs 19991 19443 400 jobs 22550 22357 450 jobs 24109 23622
19173 18661 21634 21156 23983 23306
19314 18880 22080 21831 24084 23670
19179 18972 21733 21331 24640 24134
19245 19166 22280 21367 24658 23983
20713 20425 23523 23233 26345 25859
21006 20495 23756 24030 25752 25330
20856 20720 23411 23426 26124 26179
20861 20757 23590 23209 26068 25375
20492 20324 23562 23543 26233 25906
21930 21810 24993 25002 27729 27151
22010 22016 24891 24816 27338 27302
22084 23045 24806 24759 27577 27272
22212 22096 24933 24583 27106 27216
22123 22310 24988 25353 27659 27413
23590 23600 26262 26570 28864 28823
23183 23015 25960 25998 29096 28881
23184 22950 26154 26322 28894 28752
23080 23235 25945 26301 28939 28902
23175 22934 26029 26141 29013 29122
24217 24580 27566 28006 30415 30709
24317 24882 27226 27764 30345 30440
24514 24735 27410 27556 30086 29834
24361 24629 27258 28047 30219 30336
24373 24525 27301 27380 30317 30659
500 jobs 27231 27314 500 jobs 29144 28721 500 jobs 29999 30285
10 m/c 27636 27842 20 m/c 29039 28709 30 m/c 30382 30314
27399 26845 28842 28143 30425 30213
27118 26247 28638 28645 29884 29692
26519 26145 29210 27977 30379 30010
500 jobs 31549 31730 500 jobs 32868 33043
40 m/c 31820 31824 50 m/c 33078 32742
31325 31461 33080 33036
31499 31200 32836 33246
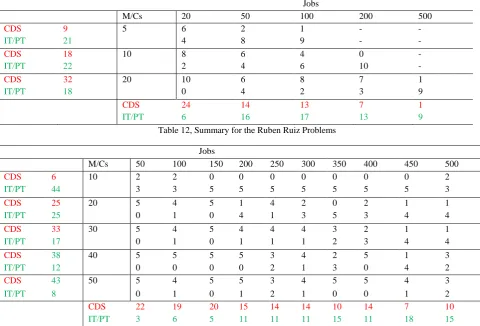
Table 11, Summary for the Taillard Problems
Jobs
M/Cs 20 50 100 200 500
CDS 9 5 6 2 1 - -
IT/PT 21 4 8 9 - -
CDS 18 10 8 6 4 0 -
IT/PT 22 2 4 6 10 -
CDS 32 20 10 6 8 7 1
IT/PT 18 0 4 2 3 9
CDS 24 14 13 7 1
IT/PT 6 16 17 13 9
Table 12, Summary for the Ruben Ruiz Problems
Jobs
M/Cs 50 100 150 200 250 300 350 400 450 500
CDS 6 10 2 2 0 0 0 0 0 0 0 2
IT/PT 44 3 3 5 5 5 5 5 5 5 3
CDS 25 20 5 4 5 1 4 2 0 2 1 1
IT/PT 25 0 1 0 4 1 3 5 3 4 4
CDS 33 30 5 4 5 4 4 4 3 2 1 1
IT/PT 17 0 1 0 1 1 1 2 3 4 4
CDS 38 40 5 5 5 5 3 4 2 5 1 3
IT/PT 12 0 0 0 0 2 1 3 0 4 2
CDS 43 50 5 4 5 5 3 4 5 5 4 3
IT/PT 8 0 1 0 1 2 1 0 0 1 2
CDS 22 19 20 15 14 14 10 14 7 10
IT/PT 3 6 5 11 11 11 15 11 18 15
5.
CONCLUSION
Table 3 to Table 8 show the results obtained for the nine heuristic algorithms when Taillard bench mark problems are used. To compute the sequence and the corresponding makespan, these algorithms use different combinations of total machine idle time while processing a job and total processing time of the corresponding job. The codes were run in an i5 PC with 4GB RAM.
From Table 3 and 4, it is clear that except the CDS and the (Idle Time/ Processing Time) based algorithm, all others fail to produce optimal/ near optimal results. Hence, the other values are ignored in other Tables.
It may be noted that for the 20x20 PFSPs, CDS completely outperforms the other one for all ten problem instances. Whereas, for the 10x200 problems set, the other algorithm gives better makespans than the CDS for all the ten instances. CDS performs better in the problem sets 10x20, 20x50, 20x100 and 20x200; and at the same time, problem sets 5x50, 5x100 and 20x500 are dominated by the other one. The performance is more or less same for other problem instances. In total, CDS produces better makespans in 59 instances, and the IT/PT heuristic algorithm, in 61 instances.
The case is different in case of Ruben Ruiz problems. Out of the 250 problems, CDS reports better makespans for 145 problems, whereas, IT/PT accounts for 106 only. Unlike the Taillard problems where, the lower bounds are listed along
problems. The authors have computed the lower bounds. It can be seen that, ten machine problems are dominated by the IT/PT algorithm whereas; forty and fifty machine problems are dominated by the CDS algorithm.
If the summary in both the cases are analyzed, following conclusions could be drawn:
For Taillard Problems:
IT/PT algorithm fares better in the case of n x {5, 10} group of problems. Also, it outperforms CDS in {50, 100, 200, 500} x m problems.
The CDS algorithm reports better makespans in the other cases.
For Ruben Ruiz Problems:
The performance of IT/PT is better for n x {10, 20} group of problems. Also, it reports better makespans for {350, 400, 450, 500} x m problems.
CDS algorithm reports better results in all the other sets of problems.
Hence, for smaller problems involving manual computations, the better choice is the algorithm based on the IT/PT ratio. For computations involving computers, both can be used for the makespan and the better sequence can be selected from the results. Also, the result could be used as the candidate solution for refining the solution further, using any meta heuristic.
6.
REFERENCES
[1] Rinnooy Kan, A. H. G. 1976. Machine Scheduling Problems: Classification, Complexity, and Computations (The Hague: Martinus Nijhoff).
[2] Baker, K. R. 1974. Introduction to Sequencing and Scheduling. John Wiley & Sons, New York.
[3] Johnson, S. M. 1954. “Optimal two- and three-stage production schedules with setup times included”, Naval Research Logistics Quarterly, vol. 1, pp. 61-68.
[4] Palmer, D. S. 1965. “Sequencing jobs through a multi-stage process in the minimum total time - a quick method of obtaining a near optimum”, Operational Research Quarterly, vol. 16, No.1, pp. 101-107.
[5] Camperll, H. G., Campbell, Dudek, R. A., and Smith, M. L. 1970. “A heuristic algorithm for the n job, m machine sequencing problem”, Management Science, vol. 16, No. 10, pp. B630–B637.
[6] Dannenbring, D. G. 1977. “An evaluation of flow shop sequencing heuristics”, Management Science, vol. 23, No. 11, pp. 1174–1182.
[7] Nawaz, M, Enscore, Jr, E. E., and Ham, I. (1983). “A heuristic algorithm for the m- machine, n-job flow-shop sequencing problem”, OMEGA, The International Journal of Management Science, vol. 11, No. 1, pp. 91– 95.
[8] Turner, S. and Booth, D. 1977. “Comparison of heuristics for flow shop sequencing”, OMEGA, The International Journal of Management Science, vol. 15, No. 1, pp. 75-78.
[9] Taillard, E. 1990. “Some efficient heuristic methods for the flow shop sequencing problem”, European Journal of Operational Research, vol. 47, pp. 67–74.
[10] Ruiz, R. and Maroto, C. 2005. “A comprehensive review and evaluation of permutation flowshop heuristics”, European Journal of Operational Research, vol. 165, pp. 479–494.
[11] Framinan, J. M., Leisten, R., and Rajendran, C. 2003. “Different initial sequences for the heuristic of Nawaz, Enscore and Ham to minimize makespan, idletime or flowtime in the static permutation flowshop sequencing problem”, International Journal of Production Research, vol. 41, No. 1, pp. 121–148.
[12] Taillard, E. 1993. “Benchmarks for basic scheduling problems”, European Journal of Operational Research, vol. 64, pp. 278–285.