7
Chemical sciences
INvESTIGATION GaTe-CaTe SySTEM
yagubov N.I., Ahmadli J.S.Baku State University, General and Inorganic Chemistry Department, Baku, e-mail: [email protected]
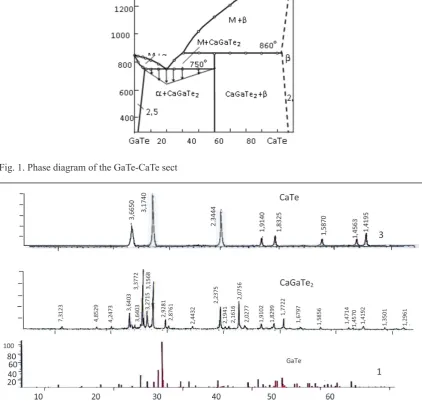
The GaTe-CaTe system is analyzed and its phase diagram is sketched. It is defined that phase diagram of the
system is quasi-binary and it is characterized with the production of CaGaTe2, melts incongruently at 860 °C based
on primary components. It is found that solid solution exists in restricted space. Based on the microstructure analysis
it is evident that at room temperature 2.5moll % CaTe dissolves in GaTe, while based on CaTe chemical compound
the area of solid solution is 2.0 moll % GaTe. Based on x-ray phase analysis CaGATe2 compound’s crystal type is
found and its cell properties are calculated. The CaGaTe2 crystallizes in the tetragonal crystal system with the cell
parameters: a = 7,31Ả; c = 6,75Ả, Z = 3, сpik = 4,82∙103 kg/m3; сrent. = 4,88 ∙103 kg/m3 spatial group –I4/mms.
Keywords: eutectic, quasi-binary, incongruity, micro hardness, solid solution
Calcium chalcogenides and the triple phases obtained on their basis are related to promising substances for the development of luminescent and photoelectrical materials. Sol-id solutions of calcium and gallium
chalcoge-nides exhibit luminescent properties of practi
-cal interest [3-8]. In the interaction of alkaline earth metal chalcogenides with gallium chalco-genides, threecomponent compounds and solid solutions are formed, which must preserve the properties of the initial binary compounds, and at the same time have more pronounced
com-plex properties.
The synthesis of the system of the GaTe-CaTe alloys consists of GaTe and GaTe-CaTe com-ponents, which are synthesized at around 850-900 °C in an quartz ampoule that has 0.13333p air sucked from it. The process of the synthesis
is done in two stages: In the first stage the mix
-ture is heated up to 900 °C and maintained the same temperature for twenty four hours. In the second stage temperature is raised from 900 to 1000 °C and synthesized for two hours [1, 2]. The alloys which are rich of GaTe compound are tending to show dark brown color and the alloys which are rich of CaTe compound tend to show dark ash color. The alloys which are rich of GaTe compound are resistant to air and water. They tend to well dissolve in mineral solvents. On the other hand the alloys which are rich of CaTe compound are resistant to air while they can absorb moisture from air and changing their appearance in process.
To homogenize the system of GaTe-CaTe alloys is maintained during 500 hours at 650 °C temperature which thermally processes the al-loys. Then the system GaTe-CaTe alloys is analyzed by physical and chemical methods of analysis and phase diagrams are plotted. The system GaTe-CaTe is the quasi-binary crop of Ca-Ga-Te three way systems, and it is char-acterized by using peristaltic compound and
limited dilution of components. In this system components make a three way compound Ca-GaTe2 in ratio of 1:1 and melts incongruently at 860 °C.
M + CaTe ↔ CaGaTe2.
The GaTe-CaTe system was studied by dif-ferential thermal analysis (DTA), x-ray diffrac-tion (xRD), micro structural analysis, density measurements, and micro hardness tests. DTA curves were obtained at a heating rate of 8 °C/min on a NTR-73 low-regency thermal analyzer. Dif-fraction patterns were collected on a D2PHASER x-ray diffract meter with CuKα radiation. Micro
hardness values were determined on a Thixomet
Smart Drive micro hardness tester at indentation loads chosen after micro hardness measurements for each of the phases present. The microstruc-ture of the alloys was investigated by MIM-8 microscope. Glory sections of the alloys were
etched with a 1:2 mixture of concentrated HNO3
and H2O2. The DTA, microstructural analysis, xRD, micro hardness and density data were used to map out the T-x phase diagram of the GaTe-CaTe system (Fig. 1).
Based on gallium monotellurid dilution of CaTe is 2.5 mol %.The solid percentage of CaTe olution is not detected, the solid part of the solution GaTe is 2.0 moll %.
Microstructure analysis revealed that, GaTe based dilution at room temperature is 2.5 %mol
CaTe, at 750 °C approximately 9 moll % CaTe.
Based on CaTe compound solid matter cannot be detected that is why solid matter is
considered approximately as 2,0 moll % and its
border is represented as jerky lines. CaGaTe2 compound makes eutectics with gallium mono-tellurid and its coordinates is 20 %moll CaTe its melting point is 750 °C. Tamman triangle should
be assembled in order to find the exact location
of eutectics. To find the existence of CaGaTe2
8
Chemical sciences
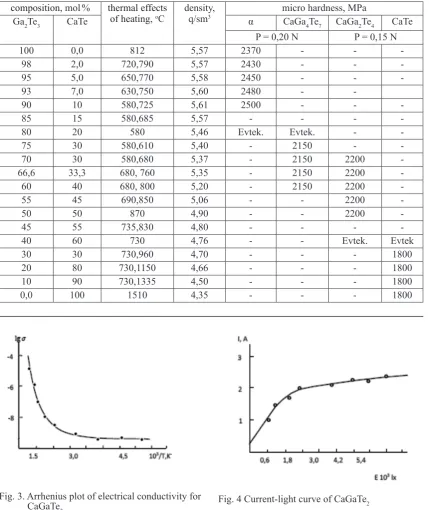
According to the results of x-ray phase
analysis calculated distance between planes
and diffraction maximum’s intensity are being
compared to CaGaTe2 compound and primary
components. (Fig. 2) As seen from figure 2 in
the difractogram of CaGaTe2 compound
deter-mined diffraction maximums differ from pri
-mary components based on the difference be-tween planes and intensity.
This proves that, inside of GaTe-CaTe sys-tem new three way compound CaGaTe is
pro-duced. CaGaTe2 compound’s x-ray results are
shown in table 1.
It is defined that, CaGaTe2 is crystallized in
tetragonal syngony and its cell properties are a = 7.31, c = 6.75; Z = 3; ppikn = 4.82 g/cm3;
pprent = 4.92 g/cm3.
During the measurement of micro strength in the system, it tends to show three different
values. From six hundred to seven hundred
MPa values represent the alpha solid solu-tion which is obtained from Gate compound,
Fig. 1. Phase diagram of the GaTe-CaTe sect
9
Chemical sciences
Table 1
The interlunar spacing∙s (dαẢ), hkl indices, and relative peakintensities
in the xRD pattern of the CaGaTe2
№ I 2θ d exp. d count. 1/d2 exp. 1/d2 count. hkl
1 3,5 12,094 7,3123 7,3123 0,0187 0,0187 100
2 3,6 18,266 4,8529 4,9752 0,0425 0,0404 101
3 4,1 20,898 4,2473 4,1416 0,0554 0,0583 111
4 26,2 24,432 3,6403 3,6564 0,0755 0,0748 200
6 100 26,369 3,3772 3,3748 0,0877 0,0878 002
6 29,7 27,237 3,2715 3,2686 0,0934 0,0936 212
7 78,5 28,248 3,1568 3,0642 0,1035 0,1065 102
8 15,5 30,505 2,9280 2,9424 0,1166 0,1155 211
9 5,7 31,070 2,8761 2,8375 0,1209 0,1242 112
10 1,7 36,755 2,4432 2,4368 0,1675 0,1684 300
11 37,7 40,274 2,2375 2,2502 0,1997 0,1975 003
12 2,5 41,108 2,1940 2,1874 0,2077 0,2090 311
13 3,7 41,752 2,1616 2,1507 0,2140 0,2162 103
14 48,6 43,571 2,0756 2,0677 0,2321 0,2339 113
15 5,3 44,654 2,0277 2,0274 0,2432 0,2433 320
16 9,0 47,564 1,9102 1,9163 0,2740 0,2723 203
17 9,2 49,790 1,8299 1,8276 0,2986 0,2994 400
18 16,3 51,528 1,7722 1,7730 0,3184 0,3181 410
19 2,6 54,597 1,6797 1,6874 0,3544 0,3512 004
20 4,1 58,131 1,5856 1,5887 0,3977 0,3962 421
21 1,6 63,136 1,4714 1,4711 0,4619 0,4621 422
22 1,8 63,835 1,4570 1,4621 0,4711 0,4678 500
23 6,1 65,747 1,4191 1,4186 0,4966 0,4969 403
24 3,5 69,575 1,3501 1,3500 0,5486 0,5487 005
25 3,3 72,929 1,2961 1,2929 0,5953 0,5988 440
(1500-1550) MPa values represent the strength
of CaGaTe2 compound, while (1800-1860)
values of micro strength represent beta solid solution which is made from CaTe compound. GaTe-CaTe system’s liquids is made from al-pha solid solution’s slope when the liquid is
released in the first crystallization process, and
beta solid solution’s slope in monotype
equi-librium. The mixture of alpha – phase and Ca
-GaTe2 compounds crystallize in double eutec-tics point, its composition is 20 moll % CaTe at 750 °C. In between 2.5-50 moll % CaTe con-centration interval downwards the solidus line
two phase alloys (α+ CaGaTe2) and at 50-98
moll % CaTe concentration interval two phase alloys (b+ CaGaTe2) precipitate.
Thus, The GaTe-CaTe system is analyzed
and its phase diagram is sketched. It is defined
that phase diagram of the system is quasi- bina-ry and it is characterized with the production of CaGaTe2. CaGaTe2 melts incongruently at
860 °C. According to the primary components
it is found that solid solution exists in restrict
-ed space. The microstructure analysis reveal-ed that at room temperature 2.5 moll % CaTe dis-solves in GaTe while, based on CaTe chemi-cal compound the area of solid solution is 2.0 moll % GaTe. According to the x-ray analysis the crystal type of CaGATe2 compound was found and its cage properties are calculated.
103/T,K Single crystals of the CaGaTe 2
compound were first grown by chemical va
-pour transport, with I2 as a transport agent, but such crystals were unsuitable for physical property measurements, so we prepared sin-gle crystals of the CaGaTe2 compound by the Bridgman-Stock Barger method. These single crystals were used in electrical measurements. Fig. 3 shows the Arrhenius plot of electrical conductivity for the CaGaTe2 compound. The data demonstrates intrinsic conduction with
10
Chemical sciences
Table 2
Results of DTA, micro hardness and density data for alloys GaTe-CaTe system
composition, mol % thermal effects
of heating, oC density,q/sm3 micro hardness, MPa
Ga2Te3 CaTe α CaGa4Te7 CaGa2Te4 CaTe
P = 0,20 N P = 0,15 N
100 0,0 812 5,57 2370 - -
-98 2,0 720,790 5,57 2430 - -
-95 5,0 650,770 5,58 2450 - -
-93 7,0 630,750 5,60 2480 -
-90 10 580,725 5,61 2500 - -
-85 15 580,685 5,57 - - -
-80 20 580 5,46 Evtek. Evtek. -
-75 30 580,610 5,40 - 2150 -
-70 30 580,680 5,37 - 2150 2200
-66,6 33,3 680, 760 5,35 - 2150 2200
-60 40 680, 800 5,20 - 2150 2200
-55 45 690,850 5,06 - - 2200
-50 50 870 4,90 - - 2200
-45 55 735,830 4,80 - - -
-40 60 730 4,76 - - Evtek. Evtek
30 30 730,960 4,70 - - - 1800
20 80 730,1150 4,66 - - - 1800
10 90 730,1335 4,50 - - - 1800
0,0 100 1510 4,35 - - - 1800
Fig. 4 presents a room-temperature current light curve of a CaGaTe2 single crystal at an applied voltage of 100 v. at low light intensity, there is only one type of recombination level between quasi-Fermi levels, which has
iden-holes. Another type of level is too deep to be regarded as a recombination level.
The triple compounds CaGaSe2,
Ca-GaTe2, and solid solutions based on them ex
-hibit intensely luminescent properties. When
Fig. 3. Arrhenius plot of electrical conductivity for
11
Chemical sciences
(Eu, Ce, Gd, Th, Sm, Nd) are added to the Ca-GaSe2, CaGaTe2 alloy and solid solutions based
on them, the luminescence efficiency increases
by a factor of 5-3. The spectra of photolumines-cent crystals CaGaSe2, CaGaTe2 taken during
the excitation of the crystal by laser radiation of
medium power of excitation of the crystal by la
-ser radiation of average power 0.8 Bm.
The long-wave edge of the photolumi-nescence spectrum of the CaGaTe2 crystal is
formed by annihilation of excitons. The en
-ergy of the exciton peak is 1.34 eV. The radia
-tion intensity of exciton radiative recombina
-tion varies quadratically with the intensity of
the exciting laser radiation. Taking into ac
-count that the photon energy of laser radiation is 1.167 ev, then it can be assumed that the
excitation of nonequilibrium electrons occurs
due to two absorption photons. The observed peaks in the photoluminescence spectra in the high-energy region attest to the reliability of this assumption.
References
1. yagubov N.I., Aliyev I.I., Ilyasly T.M. Research in the Te-CaGa2Te4 system. “Modern Scientist” № 2. 2016 Belgorod,
Р. 30-38.
2. Huseynova G.A., yagubov N.I., Ilyasly TM, Aliyev O.A.
Research in the YbTe-İnTe system. Scientific Almanac 2016 No. 5-3 (19). Р. 384-388.
3. Chartier C., Barthou C., Benalloul P., Chenot S., Frigerio J.M. Structural and luminescent properties of green emitting SrGa2S4:Eu thin films prepared by RF- sputtering // J. Cryst.
Growth 2003.V. 256. Р. 305-316.
4. Benalloul P.,Georgobiani A., Tagiev O., Dzhabborrov R. Luminescence of Eu2+ in CaGa
2S4 mono and polycrystals //
Ja-pan. J. Appl. Phys. 2000. 39S1. р. 121-122.
5. Do y.R., Ko K.y., Na S.H., Huh y.D. Luminescence properties of potential Sr1-xCaxGa2S4:Eu green- and
greenish-yel-low-emitting phosphors for white LED // J. Electrochem. Soc.
2006. V.153 H142-H146. Materials. 2010. № 3. Р. 2877-284.
6. Duan x.x., Huang S.H., you F.T., Kang K. Hydrother-mal preparation and persistence characteristics of nanosized phosphor SrS:Eu2+, Dy3+ // J. Rare Earths. 2009. V. 27. Р. 43-46.
7. Lin J., Huang y., Bando y., Tang C.C., Golberg D. BN tubular layer-sheathed CaS:Eu2+ nanowires as stable
red-light-emitting nanophosphors // Chem. Commun. 2009. Р. 6631-6633.
8. van Haecke J.E., Smet P.F., De Keyser K., Poelman D. Single crystal CaS: Eu and SrS:Eu luminescent particles ob-tained by solvothermal synthesis // J. Electrochem. Soc. 2007.