http://www.sciencepublishinggroup.com/j/ijnfs doi: 10.11648/j.ijnfs.20190804.12
ISSN: 2327-2694 (Print); ISSN: 2327-2716 (Online)
Development of the Soft Canned Taro (
Colocasia
esculenta
)
Yan Chen
1, 2, Zhenhua Duan
1, 2, *, Meiling Tang
1, 2, Qiuxia Duan
1, 2, Yuyan Pan
21School of Food Science and Technology, Dalian Polytechnic University, Dalian, China 2
School of Food and Bioengineering, Hezhou University, Hezhou, China
Email address:
*
Corresponding author
To cite this article:
Yan Chen, Zhenhua Duan, Meiling Tang, Qiuxia Duan, Yuyan Pan. Development of the Soft Canned Taro (Colocasia esculenta). International Journal of Nutrition and Food Sciences. Vol. 8, No. 4, 2019, pp. 63-70. doi: 10.11648/j.ijnfs.20190804.12
Received: September 12, 2019; Accepted: October 7, 2019; Published: October 20, 2019
Abstract:
Canned taro (Colocasia esculenta) products on the market are tinplate cans with large capacity, which are difficult to carry. In order to develop a convenient and edible soft canned product of taro, the optimum formula of soft canned taro was studied by single factor and orthogonal test with sensory score and soluble solids content as indicators in this experiment. The same formulation technology was used to make soft canned taro and glass canned taro, and the two cans were compared with commercially available canned tinplate taro products. The results showed that the formulation technology of soft canned taro was as follows: with the addition of 0.6% honey, the solid -liquid ratio was 2.00:1, the sugar addition was 24% and the salt addition was 0.15%. The sensory evaluation of three kinds of canned taro was carried out by the method of fuzzy comprehensive evaluation. According to the comprehensive sensory evaluation, physical and chemical indexes and microbial indexes, the soft canned taro had the best sensory evaluation. Most of the other physical and chemical indexes were better than glass canned and tinplate canned, and reaches the commercial sterilization standard. The research on the processing conditions of soft canned taro provides a theoretical basis for the development of related products of taro.Keywords:
Colocasia esculenta, Soft Canned, Formulas, Fuzzy Comprehensive Evaluation1. Introduction
Taro (Colocasia esculenta) belongs to the genus Araceae [1], which is spherical in shape and has very clear purple-red markings. It is a common rhizome economy in tropical humid areas such as Guangxi and Fujian. Taro is a traditional famous brand product in Hezhou, which is sold well in Guangxi and Guangdong with its "taste, quality and crispy". Taro is rich in nutrition, color, aroma and taste. The main food of taro is corm, which contains rich starch, protein, dietary fiber, vitamins and minerals and so on [2]. Its taste is soft, sweet and glutinous, and its nutritional value is similar to that of potatoes, but it does not contain Solanin [3]. It not only has nutritional and healthy function, but also is people's favorite food [4].
Most of the canned taros currently on the market are large-capacity tinplate cans, and tinplate cans take longer to reach
the sterilization temperature during sterilization, which will make the food darker [5]. However, the small size of soft cans and the thin composite film used, the time to reach the sterilization temperature in the center of cans is shorter than that of tinplate, which can maintain good color, aroma, taste and nutrition [6]. And the soft canned products have many advantages, such as simple production process, low cost, easy to carry, easy to eat and so on, and have a broader market prospects.
2. Materials and Methods
2.1. Materials
Taro, honey, sugar and salt were provided by Baijiafu supermarket in Hezhou, Guangxi; Retort Pouch (PA+CPP) was purchased from Shijiazhuang Xilong Packaging Co., Ltd; Canned taro for comparison was purchased from Guangzhou Tiancong Food Co., Ltd; Food-grade calcium chloride was purchased from Henan Shengside Industrial Co., Ltd; Copper sulfate, Potassium sulfate, 95% Ethanol, Crystal violet, Ammonium oxalate, Methyl red and Bromocresol green were purchased from Guangdong Guanghua Technology Co., Ltd.; Sodium hydroxide and Sulfuric acid were purchased from Xilong Science and Technology Co., Ltd.. All chemical reagents were AR pure.
CR-400 color difference meter was purchased from Konica Minolta (China) Investment Co., Ltd; PTX-FA110S electronic balance was purchased from Fuzhou Huazhi Scientific Instruments Co., Ltd; AS-ZOL vacuum packaging machine was purchased from Quanzhou Ansen Mechanical and Electrical Co., Ltd; FE28 pH meter was purchased from Mettler-Toledo Instruments (Shanghai) Co., Ltd; LH-B55 digital refractmeter was purchased from land. Evergreen Biotechnology Co., Ltd; YXQ-LS-50S11 vertical pressure steam sterilizer and ZD-85 Gas Bath Constant Temperature Oscillator was purchased from Shanghai Boxun Industrial Co., Ltd. Medical Equipment Factory; TA. XT Plus Physical Property Tester was purchased from Stable Micro System Ltd, UK; ATN-300 Automatic Kjeldahl Nitrogen Determiner and KDN-08D Constant Temperature Heating and Cooking Furnace was purchased from Shanghai Hongji Instruments and Equipment Co., Ltd., the HH-S2 digital display constant temperature water bath pot was purchased from Jiangsu Jinyi Instrument Technology Co., Ltd., and the BA210 biological microscope was purchased from Motic China Group Co., Ltd.
2.2. Soft Canned Taro Processing
Material selection → Cleaning → Peeling → Cutting → Hardening → Pre-cooking → Cooling and draining water → Seasoning → Bagging and sealing → Exhaust → Sterilization → Cooling → finished product → quality inspection
2.3. Experimental Design
According to the process of making soft canned taro, refer to the method of Lou Wenjuan [7] slightly modified, because honey can inhibit PPO activity, can inhibit the browning effect [8], although honey is easy to change after heating, but the fructose and Glucose [9] can bring a good taste to the soup. A small amount of salt can protect the color of the product, and a proper amount of salt combined with sugar can enhance the flavor of the product. Therefore, according to the preliminary test results, the ratio of the taro and the sauce were selected to be 0.5:1, 1:1, 1.5:1, 2:1 and 2.5:1; The
amount of white sugar added were 16%, 20%, 24%, 28% and 32%; The amount of honey added were 0.2%, 0.4%, 0.6%, 0.8% and 1%; The amount of salt added were 0.05%. 0.1%, 0.15%, 0.2% and 0.25% were tested for single factor test. The soluble solids and comprehensive sensory scores were used as indicators to study the effects of various factors on the quality of soft canned taro.
2.4. Determination of the Optimum Technological Conditions of Soft Canned Taro
On the basis of single factor test, in order to further study the optimum processing conditions of soft canned taro, that the orthogonal experiment was designed with three factors: solid -liquid ratio, the addition of sugar and salt. Orthogonal test factors and levels were shown in Table 1.
Table 1. Orthogonal test factor level.
Level
Factor A Solid -liquid ratio/(g/mL)
B Sugar addition/%
C Salt addition/%
1 1.75:1 22 0.13
2 2.00:1 24 0.15
3 2.25:1 26 0.17
2.5. Contrast Test
The sensory evaluation of three kinds of canned taro was carried out by the method of fuzzy comprehensive evaluation, Physicochemical (Chroma, Hardness, pH, Total solid, Soluble solids and Protein) and microbial (Commercial sterilization) indexes were detected. The same formulation technology was used to make canned taro glass. The soft canned taro, glass canned taro and tinplate canned taro products were compared.
2.6. Determination of Indicators
Table 2. Test criteria for sensory evaluation of soft canned taro.
Project weight Grading score
Color 0.2
The taro cubes are bright and shining in color, partly purple 16~20 Excellent
The taro cubes are slightly discolored, yellowish 12~15 Medium
The taro cubes are heavily discolored and turns brown <12 Poor
Taste and
smell 0.4
It tastes great and has a distinct aroma of taro and honey syrup. 32~40 Excellent
Taste incongruous, but slightly sour or sweet or salty, taro taste is not obvious, honey and syrup
taste is heavy, has a slightly bad taste. 24~31 Medium
Taste incongruous, and taste serious acidic or sweet or salty, no taro taste, only honey and syrup
taste, has a bad taste. <24 Poor
Soup 0.1
The soup is clear and transparent, and contains no taro crumbs. 8~10 Excellent
The soup is slightly opaque, with a small amount of taro that does not cause turbidity. 6~7 Medium
The soup contains a large amount of taro crumbs and causes turbidity. <6 Poor
Shape 0.3
The taro has appropriate hardness and complete cubes shape. 24~30 Excellent
The taro cubes are slightly soft or hard, and the cubes shapes in the package are mostly intact. 18~23 Medium
The taro cubes are too soft or too hard, and the cubes shaped in the package are loose. <18 Poor
3. Results and Analysis
3.1. Effect of Different Solid-liquid Ratio on Quality of Soft Canned Taro
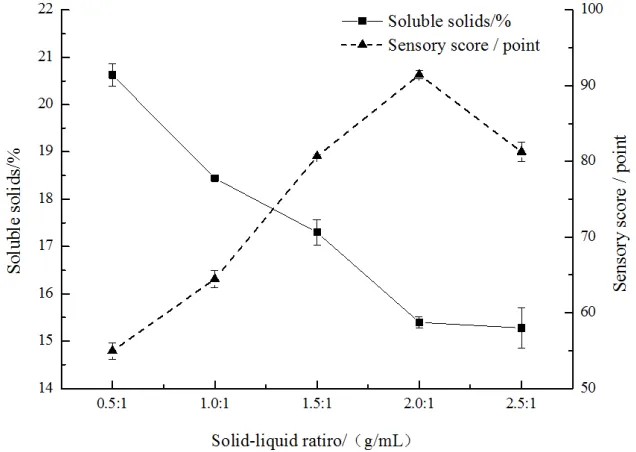
Different solid-liquid ratio had different effects for soft canned taro of color, Taste and smell, Soup, and Shape. It reflected in Figure 1, suitable solid-liquid ratio could make soft canned taro preserve its cubes shape integrity through vacuum packaging, but with the increase of the proportion of condiment juice, the soft canned taro cubes will become more and more soft and loose. The aroma of taro gradually declined and was replaced by the taste of honey or syrup. When the ratio of solid to liquid was 2:1, the taro cubes were bright and shining in color, it tastes great and had a distinct aroma of taro and honey syrup. The soup was clear and transparent, without taro crumbs, with moderate hardness and intact cubes shape in the package. When the ratio of solid to liquid was 2.5:1, the flavoring juice in soft canned taro was the least, and the taro lump was easy to coke because of high
temperature, which made the color of taro lump brown. When the ratio of solid to liquid was 0.5:1 and 1:1, the soft canned taro was too sweet, yellowish in color, loose in lump, with the lowest sensory score and unacceptable taste.
The Soluble Solids was an important index for evaluating canned cans. Figure 1 shows that with the solid-liquid ratio from 0.5:1 to 2.5:1, the soluble solids gradually decrease. The mainly reason was the content of honey syrup decreases with the ratio of material to liquid changing, resulting in the decrease of the total soluble solids in soft canned taro. However, the national standard GB/T 7098-2015 has no requirement on Soluble solids in soft canned taro, but in the textbook "Storage and Processing of Fruits and Vegetables", the requirements for soluble solids in canned sugar, fruit and vegetable are usually within the range of 8%-22% [15]. Soluble solids could be used as a reference for orthogonal test screening.
Comprehensive sensory evaluation and soluble solids, the solid-liquid ratio of soft canned taro were 1.75:1, 2.00:1 and 2.25:1 as the screening level of orthogonal test.
3.2. Effect of Different Sugar Additions on the Quality of Soft Canned Taro
Adding sugar can improve the taste of soft canned taro [16]. The sweetness of soft canned taro varies with the amount of sugar. It reflected in Figure 2, the sensory score increases with the increase of sugar content, but beyond a certain limit, the sensory score decreases greatly. The sweetness of soft canned taro was acceptable to most people with 24% sugar content, which made the taste of taro and syrup coordinated, and the sensory score was the highest. However, when the sugar content exceeds 28%, it was too sweet and the sweetness was unacceptable to most people. When the sugar concentration was too much, the maillard
reaction will occur in the sterilization process, resulting in yellowish overall color of soft canned taro [17], so the sensory score was low.
It can be seen from Figure 2 that the soluble solids of soft canned taro increase with the addition of white sugar, because the increase of sugar concentration leads to an increase in the refractive index of soft canned syrup, and soluble solids in the range of 8% ~22%. However, the soluble solids content in soft canned taro cannot be increased only by increasing sugar, which will increase the sweetness of soft canned taro and lead to the decrease of sensory score.
Comprehensive sensory evaluation and soluble solids, the sugar additions of soft canned taro were 22%, 24% and 26% as the screening level of orthogonal test.
Figure 2. Effect of different sugar additions on the quality of soft canned taro. 3.3. Effect of Different Honey Additions on the Quality of
Soft Canned Taro
Adding honey could increase the flavor of soft canned taro and coordinate the sauce with taro. It could increase the content of soluble solids without too sweet. Figure 3 shows
that when honey was added more than 1%, the soft canned taro will be yellowish, so the sensory score was low. Adding 0.4% and 0.6% honey could make the soft canned taro had better flavor, but the sensory difference was not obvious, but people cannot feel the obvious difference.
It can be seen from Figure 3 that soluble solids in soft canned taro increased with the increase of honey content, because honey contains fructose and glucose. With the increase of honey concentration, the refractive index of sauce increased in the range of 8%-22%. However, there was no significant difference in sweetness by sensory evaluation, and there was no significant difference in sensory score.
Comprehensive sensory evaluation and soluble solids, in order to improve the content of soluble solids in soft canned taro, 0.6% honey addition was selected for orthogonal test, but it was not the factor of orthogonal test.
3.4. Effect of Different Salt Additions on the Quality of Soft Canned Taro
Salt could improve the taste of soft canned taro, so that the sauce will not be too sweet [18]. Figure 4 shows that the
sensory score increased with the increase of salt addition in the appropriate range of salt concentration. When the salt addition was 0.15%, the soft canned taro had the most harmonious flavor and the best taste. If the salt addition was less than 0.05%, it will feel too sweet without salty taste. And because people's acceptance of salty taste was very poor, they had a strong ability to perceive. As long as the salt addition exceeds 0.25%, the sensory evaluator tastes too salty and feels bad.
It could be seen from Figure 4 that with the increase of salt addition, the refractive index of sauce increased in the range of 8%-22%. But because the amount of salt added was too small, it had little effect on soluble solids.
Comprehensive sensory evaluation and soluble solids, the salt additions of soft canned taro were 0.13%, 0.15% and 0.17%as the screening level of orthogonal test.
Figure 4. Effect of different salt additions on the quality of soft canned taro. 3.5. Orthogonal Test Results
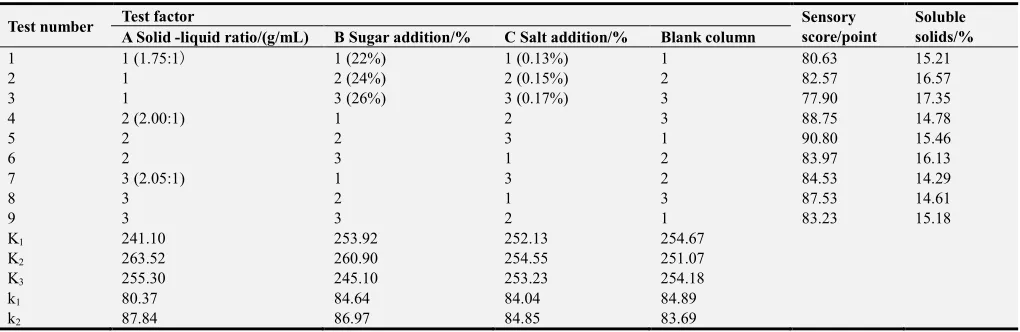
According to the results of single factor test, it was concluded that the solid-liquid ratio, sugar and salt additions had great influence on the sensory quality of soft canned taro. Therefore, orthogonal experiments were carried out to optimize the processing technology of soft canned taro. The results are shown in Table 3.
Table 3. Orthogonal test results of soft canned taro.
Test number Test factor Sensory
score/point
Soluble solids/% A Solid -liquid ratio/(g/mL) B Sugar addition/% C Salt addition/% Blank column
1 1 (1.75:1) 1 (22%) 1 (0.13%) 1 80.63 15.21
2 1 2 (24%) 2 (0.15%) 2 82.57 16.57
3 1 3 (26%) 3 (0.17%) 3 77.90 17.35
4 2 (2.00:1) 1 2 3 88.75 14.78
5 2 2 3 1 90.80 15.46
6 2 3 1 2 83.97 16.13
7 3 (2.05:1) 1 3 2 84.53 14.29
8 3 2 1 3 87.53 14.61
9 3 3 2 1 83.23 15.18
K1 241.10 253.92 252.13 254.67
K2 263.52 260.90 254.55 251.07
K3 255.30 245.10 253.23 254.18
k1 80.37 84.64 84.04 84.89
Test number Test factor Sensory score/point
Soluble solids/% A Solid -liquid ratio/(g/mL) B Sugar addition/% C Salt addition/% Blank column
k3 85.10 81.70 84.41 84.73
R1 7.47 5.27 0.81
Factor primary and secondary A>B>C
Optimal combination A2B2C2
K1 49.13 44.28 45.95 45.86
K2 46.37 46.63 46.53 46.99
K3 44.08 48.67 47.11 46.73
k1 16.38 14.76 15.32 15.29
k2 15.46 15.54 15.51 15.66
k3 14.69 16.22 15.70 15.58
R2 1.68 1.46 0.39
Factor primary and secondary A>B>C
Optimal combination A1B3C3
From the range R value of Table 3, it could be concluded that the solid-liquid ratio, the sugar and salt additions had effect on the quality of soft canned taro. The order of influence was: A (solid -liquid ratio) > B (sugar addition) > C (salt addition). That was, the most significant factor affecting the sensory evaluation and soluble solids of soft canned taro was the ratio of material to liquid, while the salt content had the least significant effect. The optimum sensory evaluation process was A2B2C2, which indicated that the solid -liquid
ratio was 2.00:1, the sugar addition was 24%, and the salt addition was 0.15%. The optimum process of soluble solids was A1B3C3, which indicated that the solid -liquid ratio was
1.75:1, the sugar addition was 26%, and the salt addition was 0.17%. Table 3 shows that the orthogonal test results of soluble solids are in the range of 8%~22%. Therefore, sensory evaluation was selected as the main evaluation index for soft canned taro.
3.6. Verification Test Results
The optimal A2B2C2 test group was compared with the
highest sensory score A2B2C3 test group in the orthogonal test
table, and the validation test was carried out on the premise of 0.6% honey addition. The results are shown in Table 4.
Table 4 shows that the sensory score of the experimental
group of A2B2C2 optimized by validation test is 92.33, which
is higher than that of the experimental group of A2B2C3
orthogonal test, and the soluble solids are in the range of 8%-22%. The results showed that the optimum technological combination by orthogonal test was more reliable, so the final technological conditions of soft canned taro were as follows: A2B2C2, with the addition of 0.6% honey, the solid -liquid ratio was 2.00:1, the sugar addition was 24% and the salt addition was 0.15%.
Table 4. Verification test of soft canned taro.
Test plan Sensory score/point Soluble solids/%
A2B2C3 89.77 15.92
A2B2C2 93.07 15.78
3.7. Comparative Test Results
The soft canned taro, glass canned taro and tinplate canned taro products were compared.
3.7.1. Fuzzy Comprehensive Evaluation Results
The sensory indexes of three kinds of canned taro were synthetically evaluated by the method of fuzzy comprehensive evaluation. The evaluation results are shown in Table 5.
Table 5. Comparison of sensory evaluation of canned taro (Unit: Number).
Canned taro types Test factor Excellent Medium Poor
(A) Soft canned
Color 8 2 0
Taste and smell 9 1 0
Soup 7 3 0
Shape 9 1 0
(B) Glass canned
Color 0 4 6
Taste and smell 3 4 3
Soup 2 2 6
Shape 9 1 0
(C) Tinplate canned
Color 0 6 4
Taste and smell 0 3 7
Soup 0 8 2
Shape 6 4 0
Table 5 shows that, taking the color of soft canned taro as an example, 8 people give excellent evaluation, 2 people give middle evaluation and 0 people give poor evaluation. In order to obtain the fuzzy matrix of A, B and C for different types of canned taro, the number of the number of people who agree
with the sensory evaluation grades were divided by 10, and the comprehensive evaluation sets YA, YB and YC of the
= 0.2,0.4,0.1,0.3 ∙
0.8 0.2 0.0 0.9 0.1 0.0 0.7 0.3 0.0 0.9 0.1 0.0
= 0.2,0.4,0.1,0.3 ∙
0. 0 0.4 0.6 0.3 0.4 0.3 0.2 0.2 0.6 0.9 0.1 0.0
= 0.2,0.4,0.1,0.3 ∙
0.0 0.6 0.4 0.0 0.3 0.7 0.0 0.8 0.2 0.6 0.4 0.0
That is YA1 =(0.2 ˄ 0.8) ˅ (0.4 ˄ 0.9) ˅ (0.1 ˄ 0.7) ˅ (0.3 ˄
0.9) =0.2 ˅ 0.4⋁ (0.1 ˅ 0.3) = 0.4. Similarly, YA2=0.2,
YA3=0.0. YA= {0.4, 0.2, 0.0}, normalized YA= {0.67, 0.33,
0.00}. The peak value of the comprehensive evaluation of fuzzy relationship is 0.67, and YA1>YA2>YA3, which shows
that 67% of the people approve of the excellent evaluation of soft canned taro. Therefore, the comprehensive evaluation grade of soft canned taro was excellent.
YB1=0.3, YB2=0.4, YB3=0.3, YB= {0.3, 0.4, 0.3},
normalized YB= {0.3, 0.4, 0.3}. The peak value of the
comprehensive evaluation of fuzzy relationship is 0.4, and YB2>YB1=YB3, which shows that 40% of the people approve
of the medium evaluation of glass canned taro. Therefore, the comprehensive evaluation grade of glass canned taro was medium.
YC1=0.3, YC2=0.3, YC3=0.4, YC= {0.3, 0.3, 0.4},
normalized YC= {0.3, 0.3, 0.4}. The peak value of the
comprehensive evaluation of fuzzy relation is 0.4, and YC3>YC1=YB2, which shows that 40% of the people approve
of the poor evaluation of tinplate canned taro. Therefore, the comprehensive evaluation grade of tinplate canned taro was poor.
The comprehensive evaluation results were multiplied by their corresponding scores (excellent 100 points, medium 80 points and poor 60 points) and added to get the final fuzzy evaluation score, as shown in Table 6.
Table 6. Summary score of fuzzy evaluation. Canned taro types Fuzzy evaluation score/point
(A) Soft canned 93.33
(B) Glass canned 80.00
(C) Tinplate canned 78.18
Table 6 shows that the soft canned taro blocks optimized by processing technology were bright in color and unique in flavor, it had a distinct aroma of taro and honey syrup, the soup was clear and transparent without taro crumbs, and the taro had appropriate hardness and complete cubes shape. So the fuzzy evaluation score was the highest.
The glass cans made by similar technology of soft canned taro were complete in shape. After high temperature sterilization, the canned taro had serious browning and bad taste because of less sauce. So the fuzzy evaluation score was 80.00.
Tinplate canned taro was the sweetest products, which made people feel sugary. There were too much soup juice and a lot of taro crumbs, which cause turbidity. But the taro crumbs were relatively complete. Because they were too sweet to be eaten directly, the fuzzy evaluation score was the lowest.
3.7.2. Physicochemical Indexes Text Results
The physiochemical indexes of different kinds of canned taro were tested and compared. The results are shown in Table 7. Table 7 shows that the following results are obtained from the analysis of physical and chemical experiments. (1) The △E of soft canned of taro was the smallest, that was the color difference between fresh-cut taros and soft canned of taro were the smallest. The △E of glass canned taro was slightly larger than tinplate canned taro, but the value of a*, b* of tinplate canned taro was the largest, indicating that the fragrant taro in the cans was seriously yellow and reddish. (2) The hardness of tinplate canned taro was larger than that of soft canned and glass canned. Because of the large size of taro cube, tinplate canned taros were not easy to soften after cooking at high temperature. However, all canned taros had complete block shape and acceptable hardness. (3) Three kinds of canned taro's pH > 4.6 indicated that they belonged to low acid food [19]. (4) The content of total solid in soft canned taro and glass canned taro was above 90%, and the content of total solid in tinplate canned taro soup was the lowest. (5) Soluble solids in the soft canned taro and the glass canned taro were in the range of 8%~22%, but the tinplate canned was 23.93%. Because the tinplate canned ingredient list shows that only white sugar was added to the production, too much sugar leads to larger soluble solids, which will lead to too sugary and the sensory score decline. (6) The protein content of three kinds of canned taro was similar, but low. The reason was that the high temperature made the protein denatured and inactivated, and protein content decreases.
Table 7. Comparison of physiochemical indexes of canned taro. Physiochemical index (A) Soft canned (B) Glass canned (C) Tinplate canned
L* 57.15 53.03 55.96
a* 1.71 5.69 10.66
b* 10.32 10.28 17.38
△E 31.33 35.79 34.54
Hardness/N 0.57 0.69 1.00
pH 6.08 6.19 5.86
Total solid/% 95.26 93.04 74.00
Soluble solids/% 15.80 14.10 23.93
Protein/(g/100g) 0.60 0.63 0.54
3.7.3. Commercial Sterilization Results
4. Conclusion
In this experiment, the processing technology of soft canned taro was studied, and a new technology of soft canned taro was put forward. A new type of soft canned taro products was developed with delicious taste unique, convenient to eat. The results showed that the formulation technology of soft canned taro was as follows: the addition of 0.6% honey, the solid -liquid ratio was 2.00:1, the sugar addition was 24% and the salt addition was 0.15%. The comprehensive evaluation grade of soft canned taro processed with the optimum technological conditions was excellent, and the fuzzy evaluation score was 93.33. The sensory evaluation of soft canned taro was the best through comparative experiments. The physiochemical indexes of soft canned taro were mostly better than glass canned and tinplate canned, met the commercial sterilization standard. The research provides a theoretical basis for the development of taro and soft canned products. On the basis of this experiment, there are still many contents to be further studied. In this experiment, sweet taro soft cans are studied, and different flavors of soft can taros can also be studied. This experiment uses transparent retort pouch, and the quality of soft cans made of different packaging materials will be different after sterilization and during storage. So we can use different materials of high temperature cooking bags, such as opaque aluminum foil materials, to study the impact of different packaging materials. In this experiment, taro with less dosage is made into soft cans. In actual production, it is necessary to study the influence of different loading amount and adjust sterilization temperature and time. In addition, the shelf life of the product and the changes in physical and chemical indicators, sensory indicators and microbial indicators during storage need further study.
Acknowledgements
This work was financially supported by the authors wish to thank the financial support provided by the Guangxi Special Fruits & Vegetables Deep Processing and Fresh Technology Research (Project No. YS201601) for the research work.
References
[1] B. Y. Hu, Z. H. Duan, “Research Advancement on Processing and Utilization of Fragrant Taro”, Food and Nutrition in China, Vol. 22, pp. 31-34, August, 2016. (In Chinese).
[2] S. T. Liu, S. Z. Li, M. J. Feng, “Development and Utilization Value and Cultivation Techniques of Aromatic Taro”, Shandong Agricultural Sciences, pp. 19, July, 2001. (In Chinese).
[3] H. X. Xiao, W. G. Wu, X. J. Xia, “Characteristics of Colocasia esculenta and its processed products”, Food and Nutrition in China, pp. 22-23, April, 2007. (In Chinese).
[4] X. Han, D. X. Zhang, L. Wang, “Research Progress on the Nutrition Components and Processing and Utilization of Taro”, China Fruit & Vegetable, vol. 38, pp. 9-13, March, 2018. (In Chinese).
[5] J. Lin, “Soft Package Products Technology of Cress”, Jiangnan University, Wuxi, June, 2007. (In Chinese).
[6] Y. Q. Liu, “Sterilization of soft caned food”, Meat Industry, pp. 34-37, February, 2008. (In Chinese).
[7] W. J. Lou, Y. F. Sun, B. Li “Research on Processing Technology of Canned Yam”, Food Research and Development, vol. 38, pp. 113-117, July, 2017. (In Chinese).
[8] J. N. Geng, L. J. Miao, J. J. Yu, “Application of Honey in Antibrowning of Chinese Chestnut”, Food Research and Development, vol. 36, pp. 19-21, September, 2015. (In Chinese).
[9] H. Liu, S. X. Li, L. X. Li, “Analysis of proficiency testing results of determination of fructose, glucose, sucrose in honey”, Journal of Food Safety & Quality, vol. 10, pp. 2777-2781, May, 2019. (In Chinese).
[10] J. Hu, “Research on processing technology of canned tuna and by-product”, Hainan University, Haikou, May, 2015. (In Chinese).
[11] J. M. Yin, P. T. Zhang, L. Wang, “Establishment and Application of Taro Taste Quality Evaluation Method”, Journal of Changjiang Vegetables, pp. 28-30, December, 2017. (In Chinese).
[12] W. L. Zeng, Z. H. Liu, Z. Zhang, “Application of Fuzzy Mathematics in Sensory Assessment of Lentinus edods Sauce Can”, China Condiment, vol. 39, pp. 51-53, August, 2014. (In Chinese).
[13] J. Liu, Z. L. Zhang, L. L. Chen, “Study on the Technology of the Soft Canned Pleurotus geesteranus Singer”, The Food Industry, vol. 39, pp. 102-107, November, 2018. (In Chinese).
[14] Y. Y. Ji, “Research on the processing technology of Chaenomeles speciosa S. Nakai can”, Anhui Agricultural University, May, 2014. (In Chinese).
[15] C. H. Jin, “Storage and Processing of Fruits and Vegetables”, China Light Industry Press, 2016. (In Chinese).
[16] S. H. Wang, J. Hu, Z. H. Duan, “Research on processing technology of canned tuna”, Fisheries Science & Technology Information, vol. 41, pp. 39-42, January, 2014. (In Chinese).
[17] L. Y. Shao, “Research of non-enzymatic browning mechanism and browning model of canned Chinese chestnut in syrup”, Zhejiang University, January, 2014. (In Chinese).
[18] D. P. Wang, W. F. Zhang, “The processing of sugar-salt-water litchi can and its quality control”, Food & Machinery, pp. 102-105, July, 2006. (In Chinese).