Indian J. PlanJ PhYBiol•• Vol. XXIX, No.3, pp. 248-255 (September, 1986)
EFFECT OF WATER STRESS AT THREE STAOES OF GROWTH ON
WATER USE AND WATER..;USE EFFICIENCY OF DWARF WHEAT
TEl SINGH HARBrR SINGH AND D.S. MALIK Department of Agronomy,
Haryana Agricultural University, Hisar-125 004
SUMMARY
An experiment comprised of three levels of water stress, -0.5. -1.0 and 1.5 MPa mid day xylem water potential and no water stress (control) treatment, was conducted to study the eft'eet of water stress on water use and water-use efficiency of dwarf wheat during two consecutive rab/seasons of 1977·78 and 1978·79. Water extraction pattern and watcr use varied markedly with water stress. The maximum extraction of available soil water was found from 0.30 em soil depth being highest with no water stress treatment. The per cent extraction of available soil water from this layer decreased with increase in the masnitude of water stress particularly during jointing to flowering stage. Most of available water (89-93 per cent) was used from the upper 90 em soil depth. The water use was higher with no water stress treatment and decreased con siderably with severe water stress (-1..5 MP a) imposed during jointing to flowering. Maximum grain yield 52000 kg/ha and water-use efficiency (13.9 kllha mm) was found with no water stress treatment. The greatest adverse effect of water stress on grain yield and water-use efficiency was observed during planting to jointing stage.
INTRODUCTION
~
,
•
•
f,
J,f
~
~ ·
!
EFFECT OF WATEll STRESS 249
stress· (2 to 15 atm) then under Jow stress (0.2 to 1.4 atm). Increase in water usc of wheat with increasing water availability was observed by Choudhury and Vijay Kumar (1980). It is, however, not safe to assume that a certain level of soil water stress is accompanied by an equivalent degree of plant water stress (Kramer, 1963). A field experiment was thus conducted to study the effect of variable plant water stress at three growth stages .on water use and water use efficiency of dwarf wheat.
MATERIALS AND METHODS
Fie~d experiments were conducted during two consecutive w~nter seasons of 1977-78 and 1978-79 at the Agronomy Research Farm, Raryana Agricultural University, Risar. The experiment was laid out in a randomized block design with ten treatments consisting of three levels of plant water stress viz., -0.5. -1.0, -1.5 MPa Xylem water potential (Xylem) during three srages of crop growth i.e. planting to jointing (stage I), jointing to flowering (stage II) and flowering to maturity (stage III) and a no-water stress treatment as control. Wheat (Triticum aest;vum Cv. WH-157) was sown on 6th December, 1977-78 and 17th November, 1978-79. After applying a pre-sowing irrigation (8.0 cm) the crop was sown by drilling the seed in rows spaced 23 cm apart using 100 kg seed/ha. A basal dose of 120 kg Nand 60 kg P.Os/ha was applied in all the
.
plots. at the time of sowing. A buffer channel of 0.50 m width was provided. on all the four sides of each 7.0 m x3.22 m plot.
In the control treatment, a measured quantity of irrigation water was applied whenever 50 per cent of the available soil water was, depleted. Water depletion was determined with the help of readings from two field lysimeters planted with wheat. The xylem water potential in control 'treatment was mea sured before irrigation and it never fell below -0.9, -1.15 and -:-1.33 MPa (mean) during planting to jointing, jointing to flowering and flowering to matu rity stage, respectively. Three levels of plant water stress viz., -0.5. -1.0 and 1.5 MPa during above mentioned stages were imposed over and above that in no-water stress control. The water stress in terms of Y xylem was measured in the field with the help of pressure chamber technique (Scholander et 01•• 1965) between 11.0 a.m. and 12.0 noon. Three leaves from each plot sampled in poly thene bags were used for xy]em potential measurements. A measured quantity ~
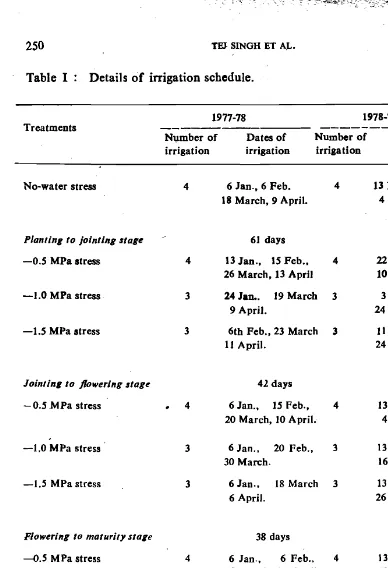
of irrigation water (6.0 cm) was applied when xylem potential in a particular treatment reached the desired level (over and above the control). The details of the irrigation frequencies are given in Table 1.
250 TEJ. SINGH ET A.L.
Table I Details of irrigation schedule.
1977-78 1978-79
Treatments
---
N1,lmber of Dates of Number of Dates of irrigation irrigation irrigation irrigation
No-water stress 4 6 Jan., 6 Feb. 18 March, 9 April.
4 13 Dec., 16 Jan., 4 March, 31 March
Planting to jointing $tage 61 days 63 days
-0.5 MPa stress
-1.0 MPa stress
4
3
13 ]an., IS Feb., 26 March, 13 April 24 ]an.. 19 March
9 April.
4
3
22 Dec., 24 Jan., 10 March, 4 April
3 Jan., 10 Feb., 24 March.
,
-1.5 MPa stress 3 6th Feb., 23 March
11 April.
3 II Jan., 10 Feb., 24 March.
Jointing to /lowering $loge 41 days 44 days
-0.5 MPa stress
-1.0 MPa stress
4
3
6]an., IS Feb., 20 March, 10 April.
6 Jan., 20 Feb., 30 March.
4
3
13 Dec., 14 Jan., 4 March, 31
March. 13 Dec., 2 Feb., 16 March.
-1.5 MPa stress 3 6 ]an.,
6 April.
18 March 3 13 Dec., 17 Feb., 26 March.
Flowering to maturity stage 38 days 42 days
-0.5 MPa stress 4 6 Jan., 6 Feb.,
28 March, 14 April.
4 13 Dec., 16 Jan., 10 March 3 April.
-1.0 MPa stress 3 6 Jan.,
4 April.
6 Feb., 3 13 Dec., 16 Jan., ,17 March.
-1.5 MPa stress 3 6 Jan.,
14 April.
6 Feb., 3 13 Dec., 16 Jan., 28 March.
The soil at the experimental site was sandy ~oam in texture having 185, 11.5 and 335 kg per hectare of available nitrogen, phosphorus and potash.
2S1
T~ble II: Moisture characteristics of'the soil.
Depth of soil surface (em) Constant
0-30 31-40 61-90 91-120
Moisture perccnta,e at
-0.03 MPa (oven dry basis) - 17.50 18.10 16.60 15.SO Moisture percentage at -1.5 MPa 7.50 7.40 6.80 6.00
Bulk density (gfem') 1.40 1.42 1.45 1.48
pH (1 : 2.5 soj] water ratio) 7.8 7.9 B.O 8.2
Soil water was determined gravimetrically at seeding. before and after each irrigation during different growth stages and at harvest. Soil samples were taken from soil depths; 0-30,31-60. 61-90 and 91-120 cm with a post hole auger. Soil water depletion was computed for each layer for the period between two succes sive soil samplings. The rainfall between the sampling da tes was added to the water use in the corresponding period. _A total rainfall of 64.8 and 33.S mm was received during1977-78 and 1978-79. respectively. However, it may be men tioned that rains amounting to 25.0 mm (1978) and 0.7 (1979) in March and 1.3 mm (l978) and 1.5 mm (1979) in April, were received during two crop seasons.
The crop was harvested at full maturity on April 25, : 1978 and April IS, 1979. Sundry weight of grains pcr U.S rna plot was recorded and converted into grain yield per ha. Daily rate of water use during :different growth stages and moisture extraction pattern were also calculated. Water-use efficiency was cal culated as grain yield Kg/ha mm.
RESULTS AND DISCUSSION
Moisture Extraetion Pattern "
•
The maximum extraction of available soil water (36 to 48 per cent) was found from thf; 0-30 cm soil layer JFig. I). The water extraction from this layer increased with the increase in xylem water potential (decrease in plant water &trest), presumably due to more available water and higher density of roots in ,this Jayer. This is . understandable in that, when the moisture in the surface : layer is available, the root growth is mostly limited to that zone (Neal, 1962). . Of the total moisture used by the crop, contribvtion of the surface layer (0-30 cm) decreased with the increase in plant water stress from -0.5 to -1.0 and252 TBJ, SINGH BY AL.
-1.5 MPa. The decreased extraction of available soil moisture from the 0-30 . em soil layer under water stress in wheat was also observed by Singh and Singh (1977) and Choudury and Vijay Kumar (1980). A larger effect of water stress on moisture extraction was, however. found during stage 11 as compared to no-water stress. treatment.
...
197a~''977-76
- N O STRESS
PLANT WATER STRESSQ>1ta) DURING PLANTING TO JOINTING STAGE
'"
,:w"I~~;;6:r'i}~~~' ~~ W"I~\~~i' W,,~*"';l' ~,'.~o~
5
120 1-71 6'10ti'!:/
7-36 '40~'
'-"
l
7: PLANT WATER STRESS(bar) DURING JOINTING TO FLOWERING STAGE
e..
~ 0~4245~39'64 ~35'92 ~43'27 ~40'36 ~35'6932'12 33·13 34'47 32'5' 33'66 34'62
::::! 60 16·12 17' 36 19'46 16·4a 17'16 /8·75
O 9 31 9 67 10 15 7·60 &·62 10·54
till":·
PLANT WATER STRESS (bm) OUR". FLOWERING TO MATURITY STAGE12~:6~:~::S6 ~~?3r ~2~:~5 ~4.2~~0 ~:?~:3
50 15.88 16'''H> 16·75.. '6·73 16·&0 16'90
120 7·66 8'25 &·36 5-:17 7·68 773
-I{)
-0·5 -10 -~
Fig. 1 : Effect of water stress on moisture extraction pattern (per cent). Consnmptlve Water Use
The water use over the entire crop growth period was maximum with no-water stress treatment, being 367 and 379 mm (mean 373 mm) during 1977-78 and 1978-79, respectively (Table IV).
A
marked reduction in the water use was observed with corresponding increase in the magnitude of plant water stress (-0.5 to -1.0 and -1.5 Mpa) imposed during three growth stages. The water need by the crop under severe water stress (-1.5 MPa) imposed during stage II. was relatively lower than during stage [ and stage III. The higher water use with no water stress was perhaps due to the adequa,te and timely supply (Tomer et 01.,1976 and Singh and Vijay Kumar, 198)). The marked reduction in water use under water stress treatments may be explained keepjng in view the fact that water stress treatments could not meet the atmospheric evaporative demand due to lack of available water. Yang and de Jang (1972) also reported that the increased resistance to water· movement in plant and soil is associated with
EFFECT OF WATER STRESS 2S3
Rate of Water Use
Highest daily rate of water use was recorded with no-water stress treat ment during all the three growth stages (Table III). A marked increase in the rate of water use was observed with the advancement of crop growth in all the treatments except that of water stress treatments imposed during stage III. The reduction in the rate of water use during growth stage I might be due to redu ced vegetative growth and lower evaporative demand of the atmosphere. The increase in the rate of water use during the later stage might be ascribed to the attainment of peak vegetative growth in terms of leaf area (Transpiring area) and increased evaporative demands of the atmosphere due to high air tempera ture and intensive advection (Singh and Vijay Kumar. 1981). -The increase in the plant water stress from -0.5 to -1.0 and -1.5 MPa during particular crop growth stage showed reduction in the rate of water use compared to no-water stress treatment. ~~orroborative findings were reported by Compbell and Fer guson (1969) and Yang and de Jang (1972) from their studies on wheat.
Table III: _Rate of water use (mm/day) as affected by various treatments.
1971-78
- - -
1978-79Treatments Stage
I
Stage II
Stage
III
Stage I
Stage II
Stage III
No water stress 1.75 3.02 3.59 1.77 2.89 3.32
Plalltillg to jOinting stage
...{).5 MPa stress 1.46 2.89 3.40 1.60 2.84 3.28
-1.0 MPa stress 1.08 2.84 3.28 1.28 2.73 3.26
-1.5 MPa stress 0.92 2.82 3.26 0.98 2.66 3.21
Jointing to flowering stage
"""'{)oS MPa stress 1.75 2.47 3.32 1.77 2.36 3.26
-1.0 MPa stress 1.75 1.81 3.31 1.17 1.94 3.19
,
-1.5 MPa stress 1.75 1.39 3.31 1,77 1.38 3.09
Flowering to maturity stage
...{).5 M Pa stress 1.75 3.02 3.00 1.77 2.89 2.82
-1.0 MPa stress 1.75 3.02 2.25 1.77 2.89 2.20
· TBJ SINGH ET AL.
Yield nd Water-ase ElBdeney
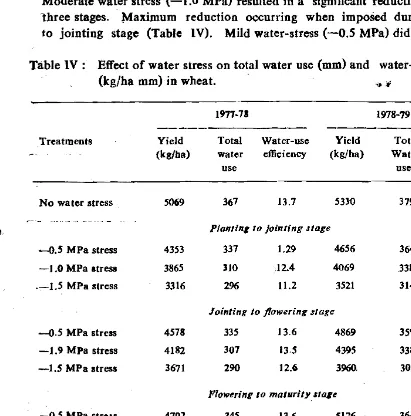
Water-use ·efficiency refers to a parameter of yield. total or harvestable per unit of water used and the major objectives of research in this area is to attain higher water-use efficiency while attaining higher productivity. It is essential. therefore. to briefly mention the grain yield of wheat for a complete discussion on water use efficiency. The maximum reduction in grain yield of 34.5 and 33.9 per cent, resulted when the severe water stress (--1.5 MPa) was imposed during planting to jointing stage. with less reduction when the treat ment was imposed during flowering to maturity and jointing to flowering stage. Moderate water stress (--1.0 MPa) resulted in a significant reduction in yield at lhree stages. )Maximum reduction occurring when imposed during planting to jointing stage (Table IV). MUd water-stress (-0.5 MPa) did not influence
Table IV: Effect of water stress on total water use (mm) and water-use efficiency
(tglba mm)in wheat. -i# ~
Im-711 1978-79
.Treatments Yield (kgfha)
Total water use
Water-usc efficiency
Yield (kg/ba)
Total Water use
Water-use efficiency
No water stress 5069 367 13.7 5330 379 14.0·
Plantin, 10 Jointing stage
-0.5 MPa stress 4353 337 1.29 4656 364 12.7
-1.0 MPa Itress 386S 510 )12.4 4069 .338 12.0
.-1.5 MPa stress 3316 296 11.2 3521 314 11.2
Jointing to flowering stage
-0.5 MPa strell 4578 335 13.6 4869 359 13.5
-1.9 MPa strell 4182 307 13.5 4395 338 13.0
-1.5 MPa stress 3671 290 12.6 3960. 309 12.7
Flo~rlng to maturity. ,ta,e
-0.5 MPa streIB 4792 345 13.6 5126 364 14.0
-1.0 MPa stress 4283 316 13.5 4608 338 13.6
-1 5 MPa streSs 3803 294 12.9 4190 516 13.2
S.Bm± 116 144
C~ D. at S% 316 417
'. 2A·>'
r-'
,EFFECT OF WATER STRESS
2SS
ithe grain yield when imposed during flowering to maturity stage. WUE was least with severe water stress (1.5 MPa) treatment imposed during stage I and increased as the begree of water stress deminised (Table IV). Sinclair et al.•
(I975) also concluded that water-use efficiency decreased under water stress conditions.. However. during stage
n
and stage ITI, except for severe water stress (-1.5 MPa), no water stress could influence the water-use efficiency because the plants attained peak vegetative growth by the time they were subject ed to such stress. The water use efficiency with no-stress treatment was not higher than mild water stress (-0.5 MPa) as the increased yield of non stres sed plants was accompanied by a proportional increase in their water use.REFERENCES
Aspinall, D .• Nicholls. P. B. and May. L. H. (1964). The ctrcct ohoil moisture stress on the growth ofbarIey. I-Vegetative dove)opment and grain yield. Alllt. J. A,ric. Re8.
IS: 729-745.
Bea, J. and Tur.enr, N.C. (1976). Crop water deficits. Alb. Agro1l•• 28 : 161-207.
Campbell. C. A. and Ferguson, W. S. 1969. Inftuence of air temperature on lipt intensity, . soi] moisture stress and soil aeration on moisture use by wheat. CQII. J. PIQllt Sci., .
49 : 129-137.
Choudhury. P. N. and Vijay Kumar (1980). The sensitivity of growth and vield of dwarf wheat to water stress at three growth stages. lrrl,. Sci., 1 : 223-245.
Kramer, P. J. (1963). Water stress and p1ant growth. A,ron. J., SS: 31-3S.
Nea1 Wright (1962). Root weigbt and distribution of blue panic grass (Pan/cum antidotale Retz). as aff'ected by fertilizer. cullinS height and soil moisture stress. A81'oll. J •• 54 : 200-202.
Scholander, P. F., H. T. Bradstreet, B. D. and Hemminpon. B. A. (I96S). Sap pressure in vascular p1ants. Scie1lce, 148 : 239:346.
-Sinclair, T. R., Bingham, C. E., Lemon, E. R. and AUen, L. H. Jr. (197S). Water use efficiency of field grown maize during moisture stress. Plant Phyliol•• 56 : 24S-249.
Singh, K. P. and Vijay Kumar (1981). Water use and water-use efficiency of wheat and barley in relation to seeding dates, 1eaves of irrigations and nitrogen fertilizations. Agricultural water Management.3: 305-316.
Singh. M.and Singh. K. (1977). Eff'eet of time of first irrigation on yield and uptake of nitrogen in dwarf wheat varieties. l"dlQII J. A,ro1l., 21 : 27-19.
Singh, T. and Harbir (1985.) Grain yield of wheat (Triticum ae8tiJlum L.) as related to water
~deficit duriDB three growth stages. HarytUUI J. Agro1l., 1 : 13-16.
'Tomii..
S. P •• Singh, U. B. and Rathi, R. S. (1976).· Consumptive use of water,growth aDd . yield of dwarf wheat varieties un~er diff'erent moisture regimes. lllllian J. AgrM••21: 119-123.