Epidemiology of 15-Day Readmissions to a Children’s
Hospital
WHAT’S KNOWN ON THIS SUBJECT: Hospital readmissions are common and costly occurrences for adult patients. Our understanding of the full scope of readmissions for pediatric patients is incomplete, particularly for readmissions that occur within a short time after hospital discharge.
WHAT THIS STUDY ADDS: This study was the first investigation of the characteristics of all readmissions within 15 days of discharge of patients at a single children’s hospital. The results serve as a basis for further analysis of the preventability of readmissions in the pediatric patient population.
abstract
OBJECTIVE:To describe the population of pediatric patients readmit-ted to a children’s hospital within 15 days of discharge.
PATIENTS AND METHODS:Medical records were reviewed to identify characteristics of patients and their hospitalizations for all children hospitalized during calendar years 2007–2008 who were readmitted up to and including 15 days after a previous discharge.
RESULTS:Of 30 188 total hospital admissions during the study period, 2546 (8.4%) were followed by a readmission within 15 days of dis-charge. The age groups with the greatest number of readmissions were infants (aged 31–364 days, 20.8% of readmissions) and patients
aged ⬎10 years (31.3% of readmissions). Most readmitted patients
(78.0%) had an underlying chronic illness, and patients with malignan-cies were most likely to be readmitted, followed by newborns and patients with neurologic conditions. Patients with malignancies also experienced the greatest number of readmissions per patient (4.1). Most patients who were readmitted had only 1 readmission (71.5%), but the small subset of patients with 3 or more readmissions ac-counted for 43.7% of all 15-day readmissions. Disease recurrence and natural course of the original diagnosis were the most common rea-sons for readmission (44.9%), followed by planned readmissions (20.6%) and readmissions for a new, unrelated illness (7.7%).
CONCLUSIONS:This report is the first description of the epidemiology of all 15-day pediatric readmissions at a children’s hospital. The results of this study serve as a basis for additional analysis to determine the extent to which readmissions in the pediatric population may or may not be preventable.Pediatrics2011;127:e1505–e1512
AUTHORS:James C. Gay, MD,aPaul D. Hain, MD,aJohn A. Grantham, MBA,band Benjamin R. Saville, PhDc
Departments ofaPediatrics andcBiostatistics, School of
Medicine, andbMonroe Carell Jr Children’s Hospital, Vanderbilt
University, Nashville, Tennessee
KEY WORDS
hospital readmissions, children’s hospital, pediatric population
ABBREVIATIONS
LOS—length of stay
MCJCHV—Monroe Carell Jr Children’s Hospital at Vanderbilt
www.pediatrics.org/cgi/doi/10.1542/peds.2010-1737
doi:10.1542/peds.2010-1737
Accepted for publication Feb 17, 2011
Address correspondence to James C. Gay, MD, Division of General Pediatrics, Department of Pediatrics, Vanderbilt University School of Medicine, 11204 Doctor’s Office Tower, Monroe Carell Jr Children’s Hospital at Vanderbilt, 2200 Children’s Way, Nashville, TN 37232-9760. E-mail: james.gay@ vanderbilt.edu
PEDIATRICS (ISSN Numbers: Print, 0031-4005; Online, 1098-4275).
Copyright © 2011 by the American Academy of Pediatrics
FINANCIAL DISCLOSURE:Dr Gay serves as a medical consultant to the Classification Research division of the National Association of Children’s Hospitals and Related Institutions and receives funding support for his activities in this role; and Dr Hain, Mr Grantham, and Dr Saville have indicated they have no financial relationships relevant to this article to disclose.
under scrutiny by payers and policy makers because of their associated medical care costs and their potential usefulness for assessment of quality of care.1 Officials of the Centers for
Medicare and Medicaid Services have reported that three fourths of all hos-pital readmissions in the Medicare
population are potentially avoidable,2
and other investigators have main-tained that significant cost savings would result from reductions in unnec-essary readmissions and payments for preventable readmissions.3–8
The information available on pediatric readmissions is relatively sparse and comes from studies in which investiga-tors focused mainly on specific age groups or conditions, and the results
give little insight into the preventability of readmissions.9–12 In a more
exten-sive study of patients discharged from 38 children’s hospitals in 2004, Feudt-ner et al found that 16.7% of patients aged 2 to 18 years were readmitted within 365 days of the initial
hospital-ization,13 a figure significantly less
than the 19.6% and 34.0% of Medicare beneficiaries rehospitalized within 30 and 90 days, respectively.1 Pediatric
readmissions were most strongly as-sociated with the patient’s specified primary payer, the number of previous admissions, the diagnosis of a com-plex chronic condition, and longer
length of stay (LOS) during the initial
admission.13 These authors excluded
data for children aged⬍2 years, be-cause patterns of hospitalization in this age group are significantly differ-ent from those of older children.
Given the absence of previous data on the full scope of readmissions to an individual children’s hospital, we iden-tified and examined all readmissions that occurred within 15 days after a hospital discharge in a single
chil-1. What is the incidence of 15-day re-admissions to our hospital?
2. Are patients who are readmitted more likely to have acute or chronic medical conditions?
3. What are the characteristics of the readmission hospitalizations?
PATIENTS AND METHODS
Study Population
The Monroe Carell Jr Children’s Hospi-tal at Vanderbilt (MCJCHV) is a tertiary children’s medical center associated with Vanderbilt University Medical Center (Nashville, TN). During the study period, the hospital had a total of 222 inpatient beds (including 36 for critical care and 78 for neonatal intensive care), and a newborn nursery. For the purpose of this analysis, pediatric pa-tients admitted to the newborn nurs-ery and those admitted under “obser-vation status” were included as patient admissions to MCJCHV, but those ad-mitted for inpatient psychiatric treat-ment at Vanderbilt University Medical Center, rather than MCJCHV, were not. In addition to providing care to pa-tients in all pediatric medical and sur-gical subspecialties, MCJCHV is also the major hospital in the community to which practicing pediatricians admit patients who are not newborns, al-though other hospitals in the area have newborn nurseries and several have NICUs. Thus, MCJCHV serves a broad mix of acute and chronic medi-cal and surgimedi-cal patients and thus pro-vides an overview of hospitalizations and readmissions among pediatric patients.
As the first phase of a quality improve-ment initiative, we identified all read-missions to MCJCHV in a 2-year period (2007–2008) that occurred within 15 days of a previous admission (desig-nated as the “index admission”). The
ministrative data collected on all MCJCHV inpatients. There were 30 188 total admissions for the study period, including 5545 newborns born at Van-derbilt University Medical Center. Data elements for each admission included medical record number, dates of ad-mission and discharge, and all diag-nostic and procedure codes of the In-ternational Classification of Diseases, 9th Edition, Clinical Modification (up to 25 codes for each admission). All chil-dren admitted to MCJCHV between the dates of January 1, 2007, and Decem-ber 31, 2008, were eligible for inclu-sion, and those who were readmitted to MCJCHV up to and including 15 days after discharge from a previous hospi-talization were identified for chart re-view. Readmissions that occurred af-ter December 31, 2008, were included if the index admission had occurred on or before that date. The 15-day interval was selected instead of a 30-day val because although the longer inter-val would have enabled us to capture data on more patients who were read-mitted to the hospital, a 30-day interval would also have led to the inclusion of more data on readmissions with no re-lation to care received during the first hospitalization. Use of the 15-day inter-val correlated with a future goal to ex-amine the role of the first hospitaliza-tion in the potential preventability of the readmission. In addition, an inter-val of 15 days provided the opportunity to examine and compare the subset of readmissions within a 7-day window, and 15 days has been a standard used in a number of other evaluations of read-mission rates.6,8Each readmission was
linked to its index admission for compar-isons because we considered each index admission to have the greatest potential impact on the subsequent readmission.
Diagnostic and procedure codes of the
Dis-eases, 9th Edition, Clinical Modification and the electronic medical record were reviewed for each admission and its associated readmission by 1 of the authors (Dr Gay). Clinical data were abstracted and patients were as-signed to mutually exclusive patient di-agnostic categories on the basis of their most prominent acute or chronic underlying condition (eg, oncology, neurology, neurosurgery, congenital heart disease, asthma, bronchiolitis) to track readmission characteristics among different inpatient populations. In the process of assignment of pa-tients to a chronic illness category, we took into account the list of complex chronic conditions developed by Feudt-ner et al14and also included other
sig-nificant chronic illnesses such as dia-betes and asthma. Relatively minor chronic conditions such as seasonal allergies and eczema were not in-cluded. Also noted was the most prom-inent reason for each readmission as given in the medical record (eg, planned admission for procedures such as chemotherapy or elective sur-gery, or return for treatment of post-surgical infection, a continuation of the initial disease process, or central venous line infection).
This study was approved by the insti-tutional review board of Vanderbilt University.
Statistical Considerations
For continuous measures that were generally skewed (eg, age, LOS), medi-ans and quartiles are reported instead of means and SDs. Statistical compar-isons were done by using Pearson’s2
(categorical outcomes) and the Wil-coxon rank-sum test (continuous out-comes) using a significance level of .05. Because of the large sample size, we focused more on the magnitude of differences and related confidence in-tervals (if applicable) rather than the
P-values for many comparisons.
Indi-vidual hospitalizations were treated as independent observations, although
individual patients often had ⬎1
hospitalization.
RESULTS
Between January 1, 2007, and Decem-ber 31, 2008, a total of 2546 patients who were admitted to MCJCHV were readmitted within 15 days of charge. These readmissions were dis-tributed among 1435 unique patients, such that the average number of 15-day readmissions for this patient group was 1.8. Overall, these 2546 re-admissions accounted for 8.4% of all admissions (30 188 total) to the inpa-tient units of MCJCHV for the 2-year period.
Patient Characteristics
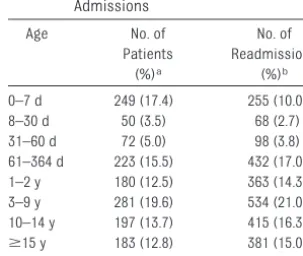
The average age of patients at the time of their index admissions was 6.5⫾6.7 years. The age distribution of these pa-tients is shown in Table 1. Papa-tients who were neonates (aged 0 –30 days) at the time of their first admission during the 2-year study period accounted for ⬃21% of patients with 1 or more read-missions, but neonates made up a smaller proportion of total readmis-sions (12.7%). In contrast, 26.5% of pa-tients with readmissions were aged
⬎10 years during the study period,
and these individuals accounted for an even greater proportion of total index readmissions (31.3%). Of patients with 15-day readmissions, 54.5% were boys and 45.5% were girls.
The clinical patient categories listed in Table 2 show the types of illnesses for which patients were readmitted, along with counts and percentages accord-ing to clinical category and subgroups for individual patients and for total re-admissions. The percentages differ considerably because patients with ill-nesses in certain clinical categories tended to have only 1 readmission, whereas patients with other illnesses frequently had multiple readmissions. For example, patients on the oncology service were most likely to have 15-day readmissions (13.9% of readmitted pa-tients) followed by patients with acute infectious diseases, neonates, and pa-tients with neurologic conditions. A substantial subset of this latter group (6.0%) had severe neurologic com-promise. These patients often had sig-nificant compromise of other organ systems as well (eg, recurrent pneu-monias, chronic constipation, muscu-loskeletal problems) in addition to their neurologic condition, and these other conditions often led to their re-admissions (see below).
Patients with malignancies had the greatest number of readmissions per patient (4.1), followed by patients with short bowel syndrome who were de-pendent on total parenteral nutrition (3.9 readmissions per patient) and patients with biliary atresia (3.8 re-admissions per patient). Other pa-tient subgroups with an average of
⬎2 15-day readmissions per patient
included patients with brain tumors with ventricular shunts, Down syn-drome with congenital heart dis-ease, and bronchopulmonary dyspla-sia and patients who had undergone stem cell transplantation. One of the largest patient groups, those with
TABLE 1 Age Ranges of Patients at Index Admissions
Age No. of
Patients (%)a
No. of Readmissions
(%)b
0–7 d 249 (17.4) 255 (10.0)
8–30 d 50 (3.5) 68 (2.7)
31–60 d 72 (5.0) 98 (3.8)
61–364 d 223 (15.5) 432 (17.0) 1–2 y 180 (12.5) 363 (14.3) 3–9 y 281 (19.6) 534 (21.0) 10–14 y 197 (13.7) 415 (16.3)
ⱖ15 y 183 (12.8) 381 (15.0) Total 1435 (100) 2546 (100)
aPatient age is reported at the time of the first index
ad-mission during the study period in 1435 total patients. bPatients age is reported at the time of the index
admis-sion in each admisadmis-sion-readmisadmis-sion pair. Thus, there were
2546 pairs of index admissions and 15-day readmissions.
n(%)a Readmissions,
n(%)b
per Patientc
Oncology 200 (13.9) 810 (31.8) 4.1
Infectious diseases (eg, pneumonia, subcutaneous abscesses, meningitis, osteomyelitis, generally in previously healthy children)
Total 164 (11.4) 194 (7.6) 1.2
Subset: bronchiolitis 37 (2.6) 40 (1.6) 1.1
Newborns (readmitted after nursery course)
Total 159 (11.1) 166 (6.5) 1.04
Subset: Newborns with hyperbilirubinemia 73 (5.1) 76 (3.0) 1.04
Subset: other newborn readmissions (apparent life-threatening events, actual or suspected infections, gastroesophageal reflux, poor weight gain)
86 (6.0) 90 (3.5) 1.05
Readmissions after NICU course 45 (3.1) 45 (1.8) 1.0
Neurology
Total 143 (10.0) 241 (9.5) 1.7
Subset: severe neurocompromise (cerebral palsy, severe brain injury) 86 (6.0) 158 (6.2) 1.8
Subset: seizures (patients without cerebral palsy) 37 (2.6) 55 (2.2) 1.5
Cardiology
Total 108 (7.5) 166 (6.5) 1.5
Subset: congenital heart disease 92 (6.4) 148 (5.8) 1.6
Gastrointestinal disorders
Total 108 (7.5) 197 (7.7) 1.8
Subset: short bowel syndrome, dependence on total parenteral nutrition
16 (1.1) 62 (2.4) 3.9
Subset: biliary atresia 6 (0.4) 23 (1.0) 3.8
Subset: other gastrointestinal disorders (gastroenteritis, constipation, abdominal pain)
69 (4.8) 86 (3.4) 1.2
Pulmonary
Total 81 (5.6) 130 (5.1) 1.6
Subset: bronchopulmonary dysplasia/chronic lung disease 26 (1.8) 54 (2.1) 2.1
Subset: cystic fibrosis 16 (1.1) 22 (0.9) 1.4
Subset: asthma 11 (0.8) 13 (0.5) 1.2
General surgery
Total 70 (4.9) 79 (3.1) 1.1
Subset: appendectomies/appendicitis 34 (2.4) 40 (1.6) 1.2
Subset: pyloric stenosis 16 (1.1) 16 (0.6) 1.0
Neurosurgery
Total 63 (4.4) 105 (4.1) 1.7
Subset: ventricular shunts (without spina bifida) 35 (2.4) 68 (2.7) 1.9
Spina bifida
Total 31 (2.2) 48 (1.9) 1.5
Subset: spina bifida, ventricular shunt problems 11 (0.8) 16 (0.6) 1.5
Other congenital anomalies (includes medical and surgical admissions) 55 (3.8) 80 (3.1) 1.5 Other surgery
Total 48 (3.4) 63 (2.5) 1.3
Subset: tonsillectomy 7 (0.5) 12 (0.5) 1.7
Trauma 30 (2.1) 30 (1.2) 1.0
Hematology
Total 49 (3.4) 85 (3.3) 1.7
Subset: sickle cell syndromes 23 (1.6) 34 (1.3) 1.5
Subset: other general hematology 11 (0.8) 14 (0.5) 1.3
Solid-organ transplantation 24 (1.7) 41 (1.6) 1.7
Nephrology (eg, acute renal failure, nephrolithiasis, chronic renal failure) 21 (1.5) 36 (1.4) 1.7
Endocrine, including diabetes 16 (1.1) 19 (0.7) 1.2
Rheumatology 14 (1.0) 19 (0.7) 1.4
Other 17 (1.2) 21 (0.8) 1.2
Total 1435 (100) 2546 (100) 1.8
Patients were classified in mutually exclusive clinical groups according to organ system, etiology, or hospital service. aTotal number and % of total of individual patients in each category (1435 total patients).
bTotal number and % of total readmissions for patients in each category (2546 total readmissions).
acute infectious conditions, usually had only 1 readmission per patient, and newborns who had 1 readmission for hyperbilirubinemia rarely had a second readmission. The latter 2 groups probably had fewer readmis-sions because these patients were generally healthy, with acute condi-tions only.
The majority of patients (71.5%) with 15-day readmissions had only 1 such read-mission, 14.2% had 2 readmissions, and 14.4% had 3 or more readmissions. Pa-tients with 1 or 2 readmissions ac-counted for 40.3% and 16.0% of all read-missions, respectively. Interestingly, although they accounted for just 14.4% of total patients, patients with 3 or more readmissions accounted for 43.7% of all 15-day readmissions.
Characteristics of Initial Admissions and Readmissions Although oncology patients made up only 13.9% of the readmitted patients, they had more than twice that propor-tion of readmissions (31.8%), which re-flects the high number of readmis-sions per patient (Table 2). Patients with neurologic conditions had the next highest number of readmissions, accounting for 9.5% of all 15-day read-missions. The index admission oc-curred in the first week of life in 255 patients, including 209 patients whose index admission was for delivery at Vanderbilt University Medical Center and who were readmitted after their NICU or newborn nursery course (rep-resenting 7.5% of all readmissions). The largest single subset of newborn readmissions was for treatment of hyperbilirubinemia.
Most readmissions (77.1% of the total) occurred after initial admissions with an LOS ofⱕ7 days, with more than half occurring after index admissions with an LOS of⬍4 days. However, a signifi-cant subset of patients had much lon-ger stays such that the average LOS for
the initial admission for all patients
who were readmitted was 7.6⫾14.0
days (range: 0 –192 days).
Planned Versus Unplanned Readmissions
Planned readmissions accounted for 20.6% of all readmissions, and 74.7% of these were for patients with malig-nancies who were readmitted for scheduled therapy or surgery (Table 3). A much smaller percentage of planned readmissions were for pa-tients with congenital heart disease, general neurology including seizures, and severe neurocompromise (3.8%, 3.1%, and 2.9%, respectively). The re-maining 79.4% of readmissions were unplanned and occurred in patients who were much younger and had more acute illnesses than patients who had planned readmissions (Table 3). As with patients with planned readmis-sions, oncology patients also had the highest number of unplanned read-missions but constituted a much smaller percentage of the total for this subset (20.7%). The most common rea-sons for unplanned readmissions in-volved care for the same or related condition as in the index admission (44.0% of all admissions) followed by
complications of surgery or other procedure (11.4%), unrelated condi-tions (7.7%), and device complicacondi-tions (6.5%), which included central venous catheter infections (4.9%) (Table 4).
Acute Versus Chronic Conditions Readmissions were also examined ac-cording to the presence or absence of a significant chronic condition. Most 15-day readmissions occurred in pa-tients with an underlying chronic ill-ness (78.0% of total readmissions), the most common subgroup being pa-tients with malignancies (Table 5). The patients with acute illnesses were much younger on average and had a much shorter LOS in both the index ad-mission and the readad-mission. More than half of readmissions for acute ill-nesses were for patients with acute in-fections (31.3%) or newborns with hy-perbilirubinemia, fever, or apparent life-threatening events (29.0%) (Table 5).
The reasons for the readmission also varied between patients with acute and chronic illnesses. Although both groups had a significant number of re-admissions for the same condition (55.3% of patients with acute illness and 42.0% of patients with chronic
ill-TABLE 3 Characteristics of Planned Versus Unplanned Readmissions
Planned (N⫽525) Unplanned (N⫽2021) P
Illness status,n(% [95% CI])
Chronic illness 507 (96.6 [94.5–97.9]) 1480 (73.2 [71.2–75.1])
Acute illness 18 (3.4 [2.1–5.5]) 541 (26.8 [24.9–28.8]) ⬍.001 Common patient groups,n(% [95% CI])
Oncology 392 (74.7 [70.7–78.3]) 418 (20.7 [18.9–22.5]) Cardiology 22 (4.2 [2.7–6.4]) 142 (7.0 [5.9–8.2]) Neurology general 16 (3.0 [1.8–5.0]) 67 (3.3 [2.6–4.2]) Severe neurocompromise 15 (2.9 [1.7–4.8]) 141 (7.0 [5.9–8.2]) Neurosurgery 14 (2.7 [1.5–4.5]) 91 (4.5 [3.7–5.5]) Gastrointestinal disease 12 (2.3 [1.2–4.1]) 185 (9.2 [8.0–10.6]) Congenital anomalies 7 (1.3 [0.6–2.9]) 74 (3.7 [2.9–4.6]) Pulmonary diseases 7 (1.3 [0.6–2.9]) 123 (6.1 [5.1–7.2]) Acute infectious diseases 5 (1.0 [0.4–2.3]) 188 (9.3 [8.1–10.7])
Newborns 2 (0.4 [0.1–1.5]) 164 (8.1 [7.0–9.4])
General surgery 1 (0.2 [0–1.2]) 78 (3.9 [3.1–4.8]) Age at index admission, median
(quartiles),ay
9.4 (2.5, 14.5) 2.4 (0.3, 10.8) ⬍.001
Readmission LOS, median (quartiles), d 4 (2, 5) 3 (2, 6) ⬍.001
aQuartiles are (25th, 75th) percentiles.
ness), there were more readmissions unrelated to the initial admission and very few planned readmissions or
complications of medical devices
among the patients with acute illness (see Table 4).
Comparison of Readmissions at 0 –7, 8 –15, and 0 –15 Days
By examining all readmissions within 15 days of discharge, we were able to compare the subset of readmissions within 7 days with readmissions that occurred during other intervals within
the 15-day period; 59.5% of
readmis-sions occurred ⱕ7 days from
dis-charge from the index admission, the
fewest occurred on the same day or the day after discharge (9.0%), and the larg-est number occurred 2 and 3 days from discharge (19.3%). Fewer patients were
readmitted from days 8 to 15 after dis-charge from an index admission, but these readmissions still made up a sig-nificant proportion of the total (40.5%).
When compared with readmissions that occurred from days 8 to 15 after
discharge, readmissions within 0 to 7 days were more likely to be for acute illnesses, less likely to be planned, and less likely to be for conditions that were new or unrelated to the index ad-mission (Table 6). Patients with malig-nancies dominated all readmission timeframes, but at 0 to 7 days from discharge there were somewhat more readmissions for patients with acute in-fections and newborns. Planned
read-missions made up a similar proportion of readmissions at 0 to 7 days and 8 to 15 days from discharge from a previous ad-mission (51.8% vs 48.2% of all planned readmissions, respectively).
We examined the most common rea-sons for readmissions in the patient
groups we observed to be most fre-quently readmitted to the hospital. Among readmissions for patients with malignancies, 52.0% of readmissions were planned (mostly for chemother-apy), whereas 33.8% were for condi-tions related to treatment or the dis-ease process itself (mostly empiric antibiotic treatment for febrile neutro-penia) and 8.4% were for infections re-lated to central venous catheters.
Al-0–7 d (N⫽1514)
8–15 d (N⫽1032)
0–15 d (N⫽2546)
Acute (N⫽559)
Chronic (N⫽1987)
Ongoing disease process; common, known treatment adverse effects; recurrence of same; or closely related principal diagnosis
734 (48.5) 410 (39.7) 1144 (44.9) 309 (55.3) 835 (42.0)
Planned 273 (18.0) 252 (24.4) 525 (20.6) 18 (3.2) 507 (25.5)
Complication of surgery or procedure 185 (12.2) 104 (10.1) 289 (11.4) 67 (12.0) 222 (11.2) Subset: postoperative or postprocedure infection,
or wound disruption
66 (4.4) 51 (4.9) 117 (4.6) 28 (5.0) 89 (4.5)
Complication of device 87 (5.7) 78 (7.6) 165 (6.5) 7 (1.2) 158 (8.0)
Subset: central venous catheter infection 68 (4.5) 57 (5.5) 125 (4.9) 3 (0.5) 122 (6.1) Unrelated (new illness, trauma, accident) 83 (5.5) 112 (10.9) 195 (7.7) 101 (18.1) 94 (4.7) Inaccurate initial diagnosis, delay in diagnosisa 26 (1.7) 5 (0.5) 31 (1.2) 12 (2.1) 19 (1.0)
Admission for problem/complication from outpatient procedure, care, equipment
20 (1.3) 15 (1.5) 35 (1.4) 8 (1.4) 27 (1.4)
Medication complications 18 (1.2) 16 (1.5) 34 (1.3) 6 (1.1) 28 (1.4)
Other related nonsurgical infectious conditions 17 (1.1) 6 (0.6) 23 (0.9) 7 (1.3) 16 (0.8)
Other medical complications 8 (0.53) 8 (0.78) 16 (0.63) 3 (0.5) 13 (0.7)
System/process problemb 8 (0.53) 2 (0.19) 10 (0.39) 1 (0.2) 9 (0.4)
All other reasons 55 (3.63) 24 (2.33) 79 (3.10) 20 (3.6) 59 (3.0)
aReadmissions for diagnoses that were present at the time of the previous admission but were not the principle diagnosis and were diagnosed only on the subsequent readmission.
bReadmissions occurred because of laboratory errors or scheduling problems.
TABLE 5 Characteristics of Readmissions in Patients With Acute and Chronic Illnesses
Acute (N⫽559) Chronic (N⫽1987) P
Age at index admission, median (quartiles),ay 0.2 (0.0, 7.1) 5.2 (0.9, 12.9) .001
Index admission LOS, median (quartiles), d 2 (1, 4) 4 (2, 7) .001 Readmission LOS, median (quartiles), d 2 (1, 3) 4 (2, 8) .001 Common patient groups,n(% [95% CI])
Oncology 0 (0.0 [0.0–0.9]) 810 (40.8 [38.6–43.0])
Cardiology 2 (0.4 [0.1–1.4]) 162 (8.1 [7.0–9.4])
Gastrointestinal disease 37 (6.6 [4.9–9.3]) 160 (8.1 [6.9–9.4]) Severe neurocompromise 0 (0.0 [0.0–0.9]) 156 (7.85 [6.7–9.1]) Pulmonary diseases 21 (3.8 [2.4–5.8]) 109 (5.5 [4.5–6.6])
Neurosurgery 4 (0.7 [0.2–2.0]) 101 (5.1 [4.2–6.2])
Infectious diseases 175 (31.3 [27.5–35.4]) 18 (0.9 [0.6–1.5]) General surgery 65 (11.6 [9.1–14.6]) 14 (0.7 [0.4–1.2])
Newborns 162 (29.0 [25.3–33.0]) 4 (0.2 [0.1–0.6])
Trauma 29 (5.2 [3.6–7.5]) 1 (0.05 [0.0–0.3])
most half (46.8%) of our newborns who were readmitted returned for treatment of hyperbilirubinemia, and most of the other newborns were re-admitted for suspected or actual
infec-tions or apparent life-threatening
events not related to their index admis-sion in the newborn nursery. Patients
who were severely
neurocompro-mised were readmitted with additional exacerbations of the same disease process (35.8%); with a new, unrelated disease process (9.9%); or with com-plications from surgery or other pro-cedures (8.6%). In another 9.3% of these patients, readmission was for another acute condition present dur-ing the index admission but not com-pletely resolved at discharge, which led to a readmission within a very short time period.
DISCUSSION
To our knowledge, this study was the first performed to examine all read-missions to a single children’s hospital within 15 days of discharge from a pre-vious admission. Such readmissions account for 8.4% of all hospitalizations within the study period, and unplanned readmissions make up 6.7% of all ad-missions. Although few data on read-missions for adults or children in other children’s hospitals were
avail-able for us to compare directly with ours, our readmission rate seemed to be less than that reported for elderly
patients, among whom⬃20% of
Medi-care beneficiaries discharged from a hospital were rehospitalized within 30 days, and 34.0% were rehospitalized within 90 days.1 In our patients, both
planned and unplanned readmissions occurred predominantly in patients with chronic illnesses, and patients with malignancies represented the larg-est subgroup for each type of readmis-sion. Readmissions within a 7-day win-dow were generally similar to those that occurred later in regard to patient sub-groups and reasons for readmission, al-though within the shorter time frame there were somewhat more readmis-sions for patients with acute conditions such as acute infections and newborns with hyperbilirubinemia.
A limitation of the present study was that it was undertaken at a single ter-tiary children’s hospital. With the inclu-sion of newborns who were not treated in the NICU and many patients of pediatricians who practiced in the community, the data we collected for the broad mix of patients who were ad-mitted to our hospital with acute and chronic medical and surgical condi-tions provide an overview of
readmis-sions over the entire pediatric age range (except for mental health condi-tions that required inpatient psychiat-ric care). Our results, therefore, may be reasonably representative of read-missions to children’s hospitals within large medical centers, although they may differ somewhat from those for many freestanding children’s hospi-tals. Furthermore, these results may not be applicable to non–tertiary-care hospitals (including community hospi-tals and general hospihospi-tals) that admit children.
The present study was also limited by incomplete data regarding patient ad-missions to other hospitals, and the actual number of readmissions in our data may have been higher if these had been taken into account. We recognize
that all neonates agedⱕ15 days who
were admitted to MCJCHV were 15-day readmissions or transfers from some hospital if not our own. How-ever, our goal in this study was to understand our own patients and services as a prelude to evaluating our patient care processes and even-tually discovering ways to prevent unnecessary readmissions of pa-tients treated at our institution. Fur-thermore, a large portion of the pa-tients in our study with chronic
TABLE 6 Comparison of Readmissions at 0 –7, 8 –15, and 0 –15 Days
0–7 d (N⫽1514) 8–15 d (N⫽1032) Pa 0–15 d (N⫽2546)
Acute illnesses,n(% [95% CI]) 373 (24.6 [22.5–26.9]) 186 (18.0 [15.8–20.5]) ⬍.001 559 (22.0 [20.4–23.6]) Chronic illnesses,n(% [95% CI]) 1141 (75.4 [73.1–77.5]) 846 (82.0 [79.5–84.2]) 1987 (78.0 [76.4–79.6]) Planned readmissions,n(% [95% CI]) 272 (18.0 [16.1–20.0]) 253 (24.5 [21.9–27.3]) ⬍.001 525 (20.6 [19.1–22.3]) Unplanned readmissions,n(% [95% CI]) 1242 (82.0 [80.0–83.9]) 779 (75.5 [72.7–78.1]) 2021 (79.4 [77.7–80.9]) Common patient groups,n(% [95% CI])
Oncology 453 (29.9 [27.6–32.3]) 357 (34.6 [31.7–37.6]) 810 (31.8 [30–33.7])
Infectious disease 131 (8.65 [7.3–10.2]) 62 (6.0 [4.7–7.7]) 193 (7.6 [6.6–8.7])
Gastrointestinal disease 122 (8.1 [6.8–9.6]) 75 (7.3 [5.8–9.1]) 197 (7.7 [6.8–8.9])
Newborns 114 (7.5 [6.3–9]) 52 (5.0 [3.8–6.6]) 166 (6.5 [5.6–7.6])
Cardiology 97 (6.4 [5.2–7.7]) 67 (6.5 [5.1–8.2]) 164 (6.4 [5.5–7.4])
Severe neurocompromise 89 (5.9 [4.8–7.2]) 67 (6.5 [5.1–8.2]) 156 (6.1 [5.2–7.1])
Pulmonary diseases 81 (5.35 [4.3–6.6]) 49 (4.75 [3.6–6.3]) 130 (5.1 [4.3–6.1])
General surgery 60 (4.0 [3.1–5.1]) 19 (1.8 [1.1–2.9]) 79 (3.1 [2.5–3.9])
Neurosurgery 55 (3.6 [2.8–4.7]) 50 (4.8 [3.7–6.4]) 105 (4.1 [3.4–5])
Age at index admission, median (quartiles),by 3.3 (0.4, 11.6) 4.3 (0.6, 12.6) .013 3.5 (0.5, 12.3)
Index admission LOS, median (quartiles), d 3 (2, 6) 4 (2, 8) ⬍.001 3 (2, 7)
Readmission LOS, median (quartiles), d 3 (2, 6) 3 (2, 6) 3 (2, 6)
aPvalue for the comparison of readmissions at 0 –7 days vs 8 –15 days. bQuartiles are (25th, 75th) percentiles.
missions) received all or the major-ity of their inpatient care at MCJCHV, so the impact of admissions to other hospitals was likely to be small outside
of the neonatal period. Nevertheless, a comprehensive study of pediatric hos-pital readmissions should include ad-missions to all inpatient facilities, and potentially emergency department vis-its as well.
Having described our 15-day read-missions, in the next phase of our study we will try to determine the ex-tent to which readmissions differ by comparing the characteristics of pa-tient readmissions to those of all other patient admissions to our
insti-missions for additional scrutiny to ascertain their potential preventabil-ity. We encourage replication of this descriptive work at other institu-tions to test the extent to which our results can be generalized.
CONCLUSIONS
This study was the first to investigate all 15-day readmissions to a large chil-dren’s hospital. The majority of pa-tients were readmitted for treatment of chronic conditions, and a substan-tial number of these readmissions were planned. This study serves as a basis for additional analysis of dif-ferences between readmissions and other hospitalizations in the
pediat-ventable.
ACKNOWLEDGMENTS
Dr Gay’s work was supported in part by a contract with the National Associa-tion of Children’s Hospitals and Re-lated Institutions (NACHRI) to serve as a medical consultant for many of its classification research projects, in-cluding NACHRI research on the nature and patterns of hospital readmissions for children, which was instrumental to the development of the current study.
The authors express sincere apprecia-tion to Wenli Wang, MS, for statistical analyses.
REFERENCES
1. Jencks SF, Williams MV, Coleman EA. Rehos-pitalizations among patients in the Medi-care fee-for-service program.N Engl J Med. 2009;360(14):1418 –1428
2. Frizzera C. Medicare announces sites for pilot program to improve quality as patients move across care settings [press release]. Available at: www.cms.gov/apps/media/press/release. asp?Counter⫽3439&intNumPerPage⫽10 &checkDate⫽&checkKey⫽&srchType⫽ 1&numDays⫽0&srchOpt⫽0&srchData⫽ &keywordType⫽All&chkNewsType⫽1% 2C⫹2%2C⫹3%2C⫹4%2C⫹5&intPage⫽ &showAll⫽1&pYear⫽1&year⫽2009& desc⫽false&cboOrder⫽date. Accessed April 1, 2011
3. Ashton CM, Deljunco DJ, Souchek J, Wray NP, Mansyur CL. The association between the quality of inpatient care and early readmission: a meta-analysis of the evi-dence.Med Care. 1997;35(10):1044 –1059
4. Friedman B, Encinosa W, Jiang HJ, Mutter R. Do patient safety events increase readmis-sions?Med Care. 2009;47(5):583–590
5. Halfon P, Eggli Y, Pretˆre-Rohrbach I, Meylan
D, Marazzi A, Burnand B. Validation of the potentially avoidable hospital readmission
rate as a routine indicator of the quality of hospital care. Med Care. 2006;44(11):
972–981
6. Goldfield NI, McCullough EC, Hughes JS, et
al. Identifying potentially preventable read-missions. Health Care Financ Rev. 2008; 30(1):75–91
7. Steffens L, Jaeger S, Herrmann S, Thomas K, Barker K, Eggleston A. Hospital readmission: the
move toward pay for performance.J Nurs Adm. 2009;39(11):462– 464
8. Averill RF, McCullough EC, Hughes JS, Gold-field NI, Vertrees JC, Fuller RL. Redesigning
the Medicare inpatient PPS to reduce pay-ments to hospitals with high readmission
rates.Health Care Financ Rev. 2009;30(4): 1–15
9. Heimler R, Shekhawat P, Hoffman RG, Chetty VK, Sasidharan P. Hospital readmission and morbidity following early newborn
dis-charge.Clin Pediatr (Phila). 1998;37(10): 609 – 615
10. Reznik M, Hailpern SM, Ozuah PO. Predictors of early hospital readmission for asthma
among inner-city children.J Asthma. 2006; 43(1):37– 40
11. Bloomberg GR, Trinkaus KM, Fisher EB Jr, Musick JR, Strunk RC. Hospital readmis-sions for childhood asthma: a 10-year
met-ropolitan study.Am J Respir Crit Care Med. 2003;167(8):1068 –1076
12. Mackie AS, Ionescu-Ittu R, Pilote L, Rahme E, Marelli AJ. Hospital readmissions in
chil-dren with congenital heart disease: a population-based study.Am Heart J. 2008;
155(3):577–584
13. Feudtner C, Levin JE, Srivastava R, et al. How
well can hospital readmission be predicted in a cohort of hospitalized children? A
retro-spective, multicenter study. Pediatrics. 2009;123(1):286 –293
14. Feudtner C, Christakis DA, Connell FA. Pedi-atric deaths attributable to complex chronic conditions: a population-based
DOI: 10.1542/peds.2010-1737 originally published online May 9, 2011;
2011;127;e1505
Pediatrics
James C. Gay, Paul D. Hain, John A. Grantham and Benjamin R. Saville
Epidemiology of 15-Day Readmissions to a Children's Hospital
Services
Updated Information &
http://pediatrics.aappublications.org/content/127/6/e1505
including high resolution figures, can be found at:
References
http://pediatrics.aappublications.org/content/127/6/e1505#BIBL
This article cites 13 articles, 2 of which you can access for free at:
Subspecialty Collections
http://www.aappublications.org/cgi/collection/epidemiology_sub Epidemiology
b
http://www.aappublications.org/cgi/collection/infectious_diseases_su Infectious Disease
following collection(s):
This article, along with others on similar topics, appears in the
Permissions & Licensing
http://www.aappublications.org/site/misc/Permissions.xhtml
in its entirety can be found online at:
Information about reproducing this article in parts (figures, tables) or
Reprints
http://www.aappublications.org/site/misc/reprints.xhtml
DOI: 10.1542/peds.2010-1737 originally published online May 9, 2011;
2011;127;e1505
Pediatrics
http://pediatrics.aappublications.org/content/127/6/e1505
located on the World Wide Web at:
The online version of this article, along with updated information and services, is
by the American Academy of Pediatrics. All rights reserved. Print ISSN: 1073-0397.