POLICY STATEMENT
Organizational Principles to Guide and Define the Child Health Care System and/or Improve the Health of all ChildrenRace, Ethnicity, and Socioeconomic
Status in Research on Child Health
Tina L. Cheng, MD, MPH, FAAP, Elizabeth Goodman, MD, FAAP, THE COMMITTEE ON PEDIATRIC RESEARCHabstract
An extensive literature documents the existence of pervasive and persistent childhealth, development, and health care disparities by race, ethnicity, and socioeconomic status (SES). Disparities experienced during childhood can result in a wide variety of health and health care outcomes, including adult morbidity and mortality, indicating that it is crucial to examine the influence of disparities across the life course. Studies often collect data on the race, ethnicity, and SES of research participants to be used as covariates or explanatory factors. In the past, these variables have often been assumed to exert their effects through individual or genetically determined biologic mechanisms. However, it is now widely accepted that these variables have important social dimensions that influence health. SES, a multidimensional construct, interacts with and confounds analyses of race and ethnicity. Because SES, race, and ethnicity are often difficult to measure accurately, leading to the potential for misattribution of causality, thoughtful consideration should be given to appropriate measurement, analysis, and interpretation of such factors. Scientists who study child and adolescent health and development should understand the multiple measures used to assess race, ethnicity, and SES, including their validity and shortcomings and potential confounding of race and ethnicity with SES. The American Academy of Pediatrics (AAP) recommends that research on eliminating health and health care disparities related to race, ethnicity, and SES be a priority. Data on race, ethnicity, and SES should be collected in research on child health to improve their definitions and increase understanding of how these factors and their complex interrelationships affect child health. Furthermore, the AAP believes that researchers should consider both biological and social mechanisms of action of race, ethnicity, and SES as they relate to the aims and hypothesis of the specific area of investigation. It is important to measure these variables, but it is not sufficient to use these variables alone as explanatory for differences in disease, morbidity, and outcomes without attention to the social and biologic influences they have on health throughout the life course. The AAP recommends more research, both in the United States and internationally, on measures of race, ethnicity, and SES and how these complex constructs affect health care and health outcomes throughout the life course.
This document is copyrighted and is property of the American Academy of Pediatrics and its Board of Directors. All authors havefiled conflict of interest statements with the American Academy of Pediatrics. Any conflicts have been resolved through a process approved by the Board of Directors. The American Academy of Pediatrics has neither solicited nor accepted any commercial involvement in the development of the content of this publication.
The recommendations in this statement do not indicate an exclusive course of treatment or serve as a standard of medical care. Variations, taking into account individual circumstances, may be appropriate.
Policy statements from the American Academy of Pediatrics benefit from expertise and resources of liaisons and internal (AAP) and external reviewers. However, policy statements from the American Academy of Pediatrics may not reflect the views of the liaisons or the organizations or government agencies that they represent. All policy statements from the American Academy of Pediatrics automatically expire 5 years after publication unless reaffirmed, revised, or retired at or before that time.
www.pediatrics.org/cgi/doi/10.1542/peds.2014-3109
DOI:10.1542/peds.2014-3109
PEDIATRICS (ISSN Numbers: Print, 0031-4005; Online, 1098-4275).
INTRODUCTION
In the United States, the racial and ethnic diversity and socioeconomic disadvantage of the child population are increasing dramatically. The US Census Bureau reported that in 2011, the country reached a historic tipping point, with Latino, Asian, mixed-race, and African American births
constituting a majority of births.1It is
projected that by 2019, fewer than half of all children will be white, non-Latino. By 2050, 36% are projected to be white, non-Latino, and 36% are projected to be Latino.2Furthermore,
children are disproportionately affected by poverty. In 2009, children younger than 18 years of age constituted 25% of the population in the United States but represented 36% of people in poverty, and 42% lived in low-income families (,200% federal poverty level).3Those most
likely to be poor are African American, Latino, and Native
American children, children in single-mother families, children of
immigrant parents, and children younger than 5 years of age.3Low
parental education is also prevalent among today’s children. In 2012, less than one-third (31.4%) of children ages 6 to 18 years old lives with a parent who has a college education, and there are significant racial and ethnic disparities in parent education, with 40.4% of non-Hispanic white children living in a home with a college-educated parent, compared with 20.3% of non-Hispanic black and 13.1% of Hispanic children.4
Disparities in health and health care related to both race or ethnicity and socioeconomic status (SES) are well documented5and have become an
important focus for many health-related organizations, including the American Academy of Pediatrics (AAP), which included health equity in its strategic plan in 2008 and in 2010 published a policy statement on health equity and children’s rights.6
A technical report on racial and ethnic disparities in the health and health
care of children was also published that year.7Furthermore, the AAP
cosponsored a conference in 2008 titled“Starting Early: A Life-Course Perspective on Child Health Disparities: Developing a Research Action Agenda,”which resulted in white papers and research recommendations published in a 2009 supplement toPediatrics.8
Understanding the mechanisms on how race, ethnicity, and SES create disparities is critical to alleviating them. In the reportChildren’s Health, the Nation’s Wealth,the National Research Council and Institute of Medicine9model children’s health and
its influences as the interaction over time of biology, behavior, and the social and physical environments. The model acknowledges the influence of developmental stages and indicates that all these factors operate in the larger context of services and policy (Fig 1). As children age, health is
reflected in a kaleidoscope.
As individual pieces of colored glass are arrayed in afixed form, they create dynamic visual patterns of how multiple influences affect the child’s present and future health into adulthood. This model incorporates an ecologic perspective, recognizing individual, family, and community influences, and a life course perspective, acknowledging that a child’s health sets the trajectory for adult health. This model, coupled with marked increase in understanding of the physiologic and psychosocial bases of diseases affecting all age
groups,10–12provides a useful lens for
understanding the roles of race, ethnicity, and SES in children’s health. The model highlights the mediating and moderating pathway (social and physical environments, behaviors, biology) through which race, ethnicity, and SES influence health across childhood.
FIGURE 1
In the United States, data on research participants and populations often include race and ethnicity as categorical variables, with the assumption that these variables exert their effects through innate or genetically determined biologic mechanisms. There has been an explosion of information on genetic factors involved in the pathogenesis of many diseases, including those that directly affect children and those with childhood roots that manifest in adulthood. The capacity to apply newly derived information from molecular and genetic science toward child health and health care will continue to grow. In addition, much research has documented the importance of social influences on health as fundamental causes or contributors to health potential and disease. Advances in genetics, epigenetics, and gene–environment interaction provide additional insight into the complexity of biological and social influences on health and their interaction and are important areas of study. Research exploring the genetic basis for childhood diseases and the developmental origins of adult diseases will undoubtedly lead to important advances in our
understanding of how race, ethnicity, and SES influence health. However, a growing body of research suggests that the sociological and
psychological dimensions of these variables also have strong, and in some areas predominant, effects on health.13–15Because research
questions are often framed and some data are collected with a focus on biological mechanisms, information on relevant social mechanisms is often lacking. Likewise, some research that focuses on social science questions lacks attention to biological mechanisms. Thus, for research in which both biological and social causation is relevant, it is often difficult to disentangle the
contributions of these 2 dimensions, the social and biological, from one another. Inadequate attention to
either biological or social influences in research limits the scope and impact of research conclusions and can lead to erroneous attribution.
The purpose of this statement is to highlight the relationships between race, ethnicity, and SES and to stimulate appropriate definition, measurement, and analysis of the variables in any study that proposes mechanisms, be they biological or social. In addition, this statement highlights some of the advances in measurement of these constructs and understanding of the mechanisms by which racial, ethnic, and SES
disparities influence health and health care starting early and through the life course.
RACE AND ETHNICITY
Conceptualization
The Institute of Medicine16report
Unequal Treatment: Confronting Racial and Ethnic Disparities in Healthcarehas defined race:“1. As many physical anthropologists abandon racial taxonomies altogether, race can more objectively considered a sociocultural concept wherein groups of people sharing certain physical characteristics are treated differently based on stereotypical thinking, discriminatory institutions and social structures, a shared worldview, and social myths; 2. A term developed in the 1700s by European analysts to refer to what is also called a racial group (a social group that persons inside or outside the group have decided is important to single out as inferior or superior, typically on the basis of real or alleged physical characteristics subjectively selected).”Ethnicity is defined as“a concept referring to a shared culture and way of life, especially as reflected in language, folkways, religious and other institutional forms, material cultures such as clothing and food, and cultural products such as music, literature and art.”16The term
ethnicitygrew out of thefield of anthropology, in which it was used to classify human populations on the basis of shared ancestry, heritage, culture, and customs.
Although race historically has been viewed as a biological construct, it is now known to have biologic and social dimensions that change over time and vary across societies and cultures.17In the United States, there
is much discussion about race, but other societies place less emphasis on race and more on class or other characteristics. Unlike a biologic characteristic such as gender, race and ethnicity categorization has developed and changed as
geographic, social, and cultural forces have shifted.
The use and misuse of self-reported race data in research have been the subject of much discussion and debate. The use of race as a proxy for genotype is highly controversial.18,19
Those supporting evidence of genetic differentiation between races point out that ancestral tree diagrams show branching relationships
corresponding to the major racial groups; major genetic clusters are associated with racial categories, and self-defined ancestry correlates with these clusters; and the frequency of alleles underlying disease or normal phenotypes can vary between racial groups.20There are higher rates of
specific genetic diseases among racial and ethnic groups, such as sickle cell disease in African American
individuals and certain thalassemias among Southeast Asians, and it is argued that this probabilistic information can improve clinical decision making.18
However, others argue that genetic differences between racial groups are small compared with genetic
differences within groups.21,22There
7% to 30% white admixture.23,24For
most diseases, racial differences are currently unexplained purely on a genetic basis.19,25,26Although sickle
cell disease is a genetic disease more common in African American people, this racial association also reflects social forces: the enslavement and transport of Africans to the United States. Other origins of the HbS gene were in the Middle East and Indian subcontinent, where malaria was prevalent.24Although the
probabilistic association of sickle cell disease with African American people can be useful, not considering the possibility of sickle cell disease in other races can be problematic. Thus, a person’s race or ethnicity should not be used to assume health-related values, beliefs, or health susceptibility in a“clinical form of stereotyping.”18
Caution is needed when applying race-related population research findings to individual patients. Racial and ethnic differences in health and disease may be related to SES, culture, bias, differential access to care, and environmental and genetic influences. Understanding the relative contribution of these factors is an important area of study, although measuring all influences with the same degree of precision and disentangling their contributions are daunting challenges, andfindings should be interpreted in light of these challenges. Burchard et al20suggest
that“the evaluation of whether genetic (as well as nongenetic) differences underlie racial disparities is appropriate in cases in which important racial and ethnic differences persist after
socioeconomic status and access to care are properly taken into account.” Advances in genetic admixture mapping to identify ancestral contributions may assist in the investigation of putative genetic factors related to race and ethnicity.27
Measurement
Both race and ethnicity are subjective and context-specific characteristics
that vary both across countries and within individuals. Although it is standard practice to describe participants and populations in terms of “race”or“ethnicity,”
recommendations on how to measure these constructs have changed. For example, the decennial census classified respondents according to the 1977 Office of Management and Budget Directive 15, which includes 4 racial categories (American Indian or Alaska Native, Asian or Pacific Islander, black, and white) and 2 ethnic categories (Hispanic and not Hispanic). The 1997 revision of this directive28expanded these categories
to 5 by separating Asian from Pacific Islander and expanding the latter to Native Hawaiian or other Pacific Islander. The Revised Directive 15 rejected the use of a“multiracial” category but recommended that the 2000 census allow respondents to check more than 1 category. Use of the Hispanic ethnicity question followed by the 5-category self-reported race question has become the norm for health researchers using survey data.
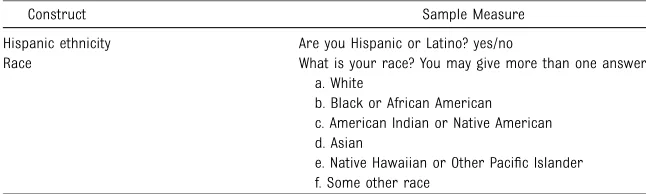
In 2009, the Institute of Medicine Subcommittee on Standardized Collection of Race/Ethnicity Data for Health-Care Quality Improvement29
concluded that “there is strong evidence that the quality of health care varies by race, ethnicity, and language. Having quality metrics stratified by race, Hispanic ethnicity, granular ethnicity and language need can assist in improving overall quality and promoting equity.”They
supported collection of the existing race and Hispanic ethnicity categories (Table 1) and morefine-grained categories of ethnicity (referred to as granular ethnicity and based on one’s ancestry) and language need (a rating of spoken English language
proficiency and preferred language for health-related encounters). Granular ethnicity and languages relevant to the local area could be chosen from national standardized categories, with opportunity offered
to individuals who want to self-identify their ethnicity and
languages.29Most recently, the Office
of Minority Health publishedfinal data collection standards for race, ethnicity, primary language, gender, and disability status required by Section 4302 of the Affordable Care Act (http://minorityhealth.hhs.gov/ templates/content.aspx?
ID=9227&lvl=2&lvlID=208).30
Clearly, there is heterogeneity within racial and ethnic groups and a growing race or mixed-ethnicity population that may be better elucidated with the new measures. Furthermore, depending on the potential mechanisms for producing health differences, other measures may be considered, including socially assigned race (“How do other people usually classify you in this country?”)31,32
or skin color.33For example, some
researchers studying effects of vitamin D on biomarkers of disease risk will assess skin color in addition to race.
Racial and Other Forms of Discrimination
Discrimination has been defined as
“actions carried out by members of dominant groups, or their
representatives, that have
a differential and harmful impact on subordinate racial or ethnic groups,” which may result from biases, prejudices, stereotyping, and uncertainty in communication and decision making.16Discrimination can
be based on race, ethnicity, or SES, with racial discrimination being the dominant form of discrimination that has received attention in the research community and with most literature on African Americans. A recent review of racism and child health identified 40 articles since 1950, most reporting on racism and behavioral and mental health outcomes.34Racial prejudice
other mechanisms.16,35–38Racism also
contributes to health inequities through multiple mechanisms.39,40
Evidence is growing that racial discrimination (both individual and institutional) as a social stress on groups of children and families can influence psychology, physiology, and health behaviors. In response to this growing body of evidence,
Geronimus41proposed the
“weathering”hypothesis, which postulates that health deterioration among African American people is a consequence of cumulative economic or social adversity and political marginalization. For instance, research has shown that clinically relevant stress-related biomarkers are higher in black than in white people, and these racial differences are not explained by SES.42–45
For children and adolescents, discrimination related to race, ethnicity, or SES may affect the child directly. Timing of exposure to discrimination may alter its influence, with adolescents having the greatest likelihood of understanding the nature and meaning of discriminatory remarks and actions of others. Furthermore, discrimination
experienced by parents may influence parenting, either through parental attitudes, beliefs, and behaviors or parental mental health, thereby influencing children’s health. Biological and behavioral responses place individual children at greater risk of both short- and long-term poor health outcomes and disease.35,38,46
For example, the gap between black
and white infant mortality rates in the United States has been persistent over time and across socioeconomic strata. Researchers have found that lifelong accumulated experiences of racial discrimination are an independent risk factor for preterm delivery.45
For researchers attempting to assess discrimination, self-report has been the traditional approach. Recent reviews have documented the strengths and limitations of several measures of perceptions of race- or ethnicity-based discrimination.39,47,48
Measures specific for children, for a wide variety of racial and ethnic groups, and for use in health care settings are limited. Measures of SES and ethnicity-related discrimination are needed and represent an important area for future work. Recognizing that self-report measures are affected by what people are able and willing to say, a newer approach has been to measure implicit bias.39
The Implicit Association Test is an indirect measure of implicit social cognition or prejudice, including among clinicians.49–52It is
a computer-based reaction measure of the relative strength between positive and negative associations toward one social group compared with another. Clinician implicit bias has been associated with physician treatment recommendations and patient-rated quality of medical visit communication and care.51,52Such
a tool may be useful to researchers studying mechanisms through which discrimination and stress affect health throughout the life span.
Acculturation
Acculturation has important health influences. Although related to race and ethnicity, it is a distinct concept that has its roots in anthropology but has been used and defined in many other disciplines.53Early definitions
conceptualized a process of accommodation with eventual (and irreversible) assimilation into the dominant cultural group.54A more
recent framework delineates 2 separate processes: maintenance of the original culture and development of relationships with the new culture.54There has been much
research on acculturation, and some studies have found it to be associated with worse health outcomes,
behaviors, or perceptions, but others have found positive effects on other health outcomes, health care use, and self-perception of health.55Others
argue that the associations between acculturation and health disparities are tentative and that its mechanism of influence is uncertain.53Reviews of
acculturation research have found wide variation in the definition and measurement of acculturation,54,56
and many measures are, at best, proxy variables that do not fully capture the construct of
acculturation.55
Measures are categorized as unidimensional, bidimensional, and multidimensional. Unidimensional instruments describe a linear process related to assimilation into a new culture, usually focusing on
generation, years in the United States, English proficiency, and self-reported ethnic identity.53,54Bidimensional
instruments individually assess acculturative change in the“old”and
“new”culture. Multidimensional instruments assess multiple aspects of the acculturative process, including attitudes, values, and ethnic
interaction.54,56 Although there has
been much research on measures, they have often been developed for a specific racial or ethnic group, and their applicability to other groups is TABLE 1 Institute of Medicine Recommended Variables for Standardized Collection of Race and
Hispanic Ethnicity29
Construct Sample Measure
Hispanic ethnicity Are you Hispanic or Latino? yes/no
Race What is your race? You may give more than one answer. a. White
b. Black or African American c. American Indian or Native American d. Asian
not clear. Research reviews state that
“it is of fundamental importance that public health researchers provide a clear statement of the interpretation and use of acculturation within their studies and interventions”if
acculturation measures are to be meaningful to the study of health.54
With the growing population of immigrant children in this country, the need to understand the mechanisms and impact of acculturation on child health is urgent.
Language
Like acculturation, language is also closely tied to race, ethnicity, and SES. Language preference may be a proxy for cultural differences in the perception of illness or access to care, and limited English proficiency may affect how well symptoms are communicated between the patient and the clinician. For example, 1 study found that language preference had a large effect on whether a child with symptoms consistent with asthma received a diagnosis.57
Language preference is often a part of acculturation scales. In research, language preference is typically accommodated through translation of questionnaires and supportive materials. Questionnaires may have differences in validity and reliability in different languages. Therefore, when the questionnaire is not currently available in the language preference group and is translated for the study, or when the questionnaire was custom designed and then translated for the study, it should be revalidated.
SOCIOECONOMIC STATUS
Conceptualization
Numerous terms describe and measure socioeconomic conditions. Such terms associal class, social stratification,andSESare often used interchangeably, although they have different theoretical foundations and interpretations.58In this statement,
SESis used to describe a complex, multidimensional concept that can be difficult to operationalize and accurately assess. Marmot and Wilkinson59and others60have
provided ample evidence that SES is related to health status. Krieger et al61condensed the complexity of
SES into 2 aspects, both of which may exert influences on health directly or through associated experiences and behaviors. One aspect includes resources, such as education, income, and wealth. The other includes status or rank, a function of relative positions in a hierarchy. As described by Braveman et al62in a review on
SES in research, SES can affect health at different levels (eg, individual, household, neighborhood), through different causal pathways (eg, by influencing exposures, vulnerability, or direct physiologic effects), and at different times in the life course. They recommend that SES measurement involve considering plausible explanatory pathways and mechanisms, measuring as much relevant socioeconomic information as possible, specifying the particular socioeconomic factors measured rather than SES overall, and systematically considering how potentially important unmeasured socioeconomic factors may affect conclusions.
The effect of SES on current and future health is a particularly active area of research, shedding light on the complexity of mechanisms whereby this multidimensional variable influences health.58Numerous
studies have documented the direct relationship between SES and health throughout the life course. SES-associated gaps in early child development and school readiness are associated with later
shortcomings in academic achievement and attainment, with implications for long-term
productivity.63Despite advances in
quality and access to health care services, it is noteworthy that the discrepancy in health status between
social status groups has persisted over time, even though the specific diseases that produced morbidity and mortality have changed.64
Furthermore, standard measures of health correlate with the extent of income discrepancy between rich and poor, and the extent of income inequality appears to explain more of the variation in health than is explained by other socioeconomic factors, even the absolute level of income.64–66Across industrialized
countries, the greater the discrepancy in income distributions, the worse the health status of the entire
population.64,68Data across
individual states within the United States demonstrate a similar relationship.65,66
Longitudinal cohort studies have now clearly demonstrated the relationship between socioeconomic conditions during childhood and adolescence and future adult health.23,68Two reviews provide
evidence that SES during childhood is a powerful predictor of adult physical health independent of adult SES.69,70The greater risk of low SES
during childhood correlating with poorer adult outcomes has been found for overall mortality as well as morbidity and mortality from specific causes. For example, in Finland, the childhood SES of adult men correlated more closely with ischemic heart disease during middle age than did their adult SES.71Three
broad conceptual models, the timing, accumulation, and change models, have been hypothesized as potential pathways.68The timing model
suggests that the detrimental effects of low SES on adult health are greatest if low SES is experienced during specific sensitive periods of development. The accumulation model posits that the intensity and duration of SES disadvantage affect adult health, whereas the change model suggests that the
clarify the environmental, behavioral, and physiologic
pathways and the timing, level, and duration of exposure critical to explaining how the SES of children affects both their current and future health status.71Recognizing
the link between early SES and later health questions the ability of SES data collected at 1 point in time to contribute to our
understanding of the effects of SES factors on health.72Furthermore, the
depth, persistence, and
intergenerational transmission of poverty have been shown to affect children’s health and health care.73
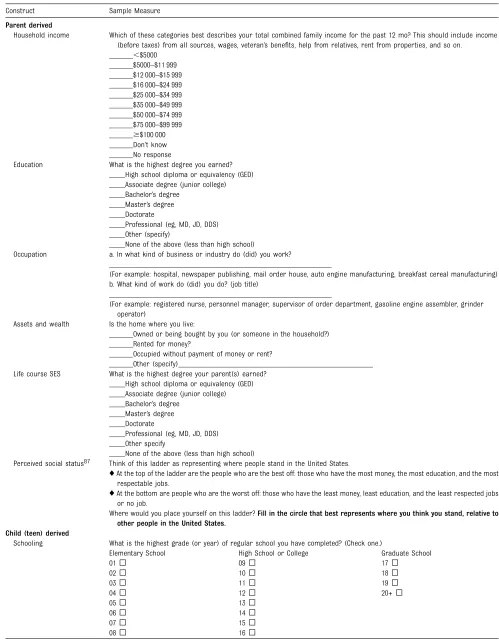
Measurement
Multiple measures have been used to assess SES, including income, wealth, education, occupation, poverty level, neighborhood socioeconomic characteristics, past socioeconomic experiences (life course SES), and subjective social status (Table 2). Each construct contributes to the multidimensional concept of SES, and there are strengths and weaknesses in their measurement. Early work tended to use composite measures that consolidated multiple constructs into a single SES score. The
Hollingshead Four Factor Index, based on occupation, education, gender, and marital status, is a classic example (A.B. Hollingshead,
unpublished working paper, 1975). As research in thefield of social epidemiology has progressed, it has become clear that these constructs each work through their own distinct (sometimes interactive) pathways to influence health and development. Thus, use of composite indices is not currently recommended. The choice of which construct to assess to represent social status should be based on the hypothesized pathways by which social inequalities in health accrue. Income and education remain the most widely used constructs to measure SES. Because their
correlation is usually less than 0.50 and they probably represent different
pathways to health; income and education should not be used as proxies for each other.58Also, income
and occupation are not proxies for wealth, which represents
accumulated economic resources and may vary across individuals or groups with similar incomes or occupations. Failure to measure wealth may underestimate the contribution of SES to health.74
It is increasingly recognized that beyond individual SES, neighborhood or contextual SES can influence health. Neighborhood SES has sometimes been used as a proxy for individual SES as addresses are linked to geocoded census tracts and census variables. Some argue that this may be a practical and population-based approach for monitoring disparities and allocating resources to address disparities.75Additional research is
needed to elucidate individual, family, and neighborhood contributions to SES and effects on health.
Perceived SES or subjective social status assesses how individuals perceive their relative position in the social hierarchy. Some suggest that perception of one’s social status may more fully capture the influence of SES on health by taking into account previous life experiences, context, and perceptions of the future. In addition, it is argued that perception guides behavior, and subjective social status is a new type of identity that influences health.76Recent research
has found that subjective social status in adolescents and adults is
independently associated with a number of behaviors, outcomes, and psychological variables.77,78
Although SES is a complex concept, understanding the mechanisms of how socioeconomic conditions influence health (eg, stress, discrimination, social capital) are critical to guide solutions. Researchers must consider the mechanisms by which SES might influence their outcomes in deciding which measures to use.
INTERACTIONS BETWEEN RACE, ETHNICITY, SES, AND OTHER CONFOUNDERS
Attributing causal effects to any one of these factors can be complicated by the relationships between constructs and the heterogeneity within and across the constructs. They interact with and are confounded by each other and potentially other social influences, including culture, bias, and access to care, as well as geographic, environmental, and genetic influences. LaVeist et al79
found that racial segregation creates different exposures to economic opportunity, environmental
conditions, and other resources that improve health, resulting in racial disparities confounded by disparities based on geographic location. For example, environmental pollution may be more intense in impoverished areas, and hazardous waste sites may even be intentionally located in poor and minority neighborhoods because of familial SES or discrimination based on race and ethnicity.80
Consequently, it is difficult to disentangle the adverse
consequences of that pollution from the effects of discrimination.
Although most studies of such confounding or interaction of race, ethnicity, and SES have focused on adults, the need for inquiries into such factors affecting child health is equally strong. Of note, the AAP technical report on racial and ethnic disparities in the health and health care of children documented that 22% of studies did not perform multivariable or stratified analyses to ensure that racial and ethnic
disparities persisted after adjustment for SES and other potential
confounders.7Little is known about
the way that the relationships between these social factors influence the health of children or their effects on the trajectory of the development of adult health or disease.
TABLE 2 SES Measurement Constructs
Construct Sample Measure
Parent derived
Household income Which of these categories best describes your total combined family income for the past 12 mo? This should include income (before taxes) from all sources, wages, veteran’s benefits, help from relatives, rent from properties, and so on.
______,$5000 ______$5000–$11 999 ______$12 000–$15 999 ______$16 000–$24 999 ______$25 000–$34 999 ______$35 000–$49 999 ______$50 000–$74 999 ______$75 000–$99 999 ______$$100 000 ______Don’t know ______No response
Education What is the highest degree you earned? ____High school diploma or equivalency (GED) ____Associate degree (junior college) ____Bachelor’s degree
____Master’s degree ____Doctorate
____Professional (eg, MD, JD, DDS) ____Other (specify)
____None of the above (less than high school)
Occupation a. In what kind of business or industry do (did) you work?
________________________________________________________
(For example: hospital, newspaper publishing, mail order house, auto engine manufacturing, breakfast cereal manufacturing) b. What kind of work do (did) you do? (job title)
________________________________________________________
(For example: registered nurse, personnel manager, supervisor of order department, gasoline engine assembler, grinder operator)
Assets and wealth Is the home where you live:
______Owned or being bought by you (or someone in the household?) ______Rented for money?
______Occupied without payment of money or rent?
______Other (specify)_________________________________________________ Life course SES What is the highest degree your parent(s) earned?
____High school diploma or equivalency (GED) ____Associate degree (junior college) ____Bachelor’s degree
____Master’s degree ____Doctorate
____Professional (eg, MD, JD, DDS) ____Other specify
____None of the above (less than high school)
Perceived social status87 Think of this ladder as representing where people stand in the United States.
♦At the top of the ladder are the people who are the best off: those who have the most money, the most education, and the most respectable jobs.
♦At the bottom are people who are the worst off: those who have the least money, least education, and the least respected jobs or no job.
Where would you place yourself on this ladder?Fill in the circle that best represents where you think you stand, relative to other people in the United States.
Child (teen) derived
Schooling What is the highest grade (or year) of regular school you have completed? (Check one.)
Elementary School High School or College Graduate School
01⬜ 09⬜ 17⬜
02⬜ 10⬜ 18⬜
03⬜ 11⬜ 19⬜
04⬜ 12⬜ 20+⬜
05⬜ 13⬜
06⬜ 14⬜
07⬜ 15⬜
disparities that persist even after adjustment for SES and the SES disparities that persist after adjustment for race or ethnicity.7,81
Disentangling the contributions and mechanisms by which race, ethnicity, and SES influence health and health care is necessary to effectively address disparities. Recognizing variability within populations, it is necessary to study those with poor health outcomes as well as those with similar exposures who are resilient to poor outcomes.
SYSTEMATIC COLLECTION AND REPORTING OF DATA
Children are dependent on their parents. Measurement of race, ethnicity, and SES and the related constructs of discrimination, acculturation, and language are key, but these characteristics are notfixed. Many children are of mixed race and ethnicity, which may necessitate assessment of both parents. How individuals conceptualize these factors can differ between parents and between parents and children, particularly as children age into adolescence and grow in their ability to understand and conceptualize these constructs. Selection of child or parent measurement must be based on the hypothesized pathway by which these factors affect health outcomes and the research question under study.
Disparities in children’s health and health care cannot be identified, monitored, addressed, or eliminated without consistent collection of race, ethnicity, language, and SES data. SES data are rarely collected
systematically, although race and
ethnicity have had more attention, Still, the most recent data available from US health plans reveal that 33% of health plan enrollees are covered by plans that do not collect race or ethnicity data.82In 1 survey of
patients, 80% thought health care providers should collect information about race and ethnicity, but 28%, especially patients of minority backgrounds, were uncomfortable giving the information.83It is likely
that socioeconomically disadvantaged people would feel similarly about the collection of SES data. Use of
computerized systems to collect race and ethnicity data from patients has been shown to be feasible.84The
Patient Protection and Affordable Care Act of 201085requires that“any
federally conducted or supported health care or public health program, activity or survey . . . collects and reports, to the extent practicable” data on race and ethnicity, in addition to a number of other factors.
Interestingly, SES was not included in the Affordable Care Act mandate but could be easily added to computer algorithms. The systematic collection of data provides a tremendous opportunity for researchers to explore how race, ethnicity, and SES affect children’s health and health care. Monitoring of its standardized collection and appropriate use is critical. Guidelines on the use and reporting of race or ethnicity data in research have been recommended and include describing the reason for use of these variables and how they were measured, distinguishing between the variables as risk factors or risk markers, and adjusting for and interpreting differences in the context of all conceptually relevant factors,
including SES and other factors.21
Furthermore, clinical or community-based research that addresses race, ethnicity, and SES should be guided by the AAP policy statement“Ethical Considerations in Research With Socially Identifiable Populations,” which emphasizes community involvement in the research process.86
CONCLUSIONS
The racial and ethnic diversity of US children continues to increase dramatically, and the proportion of children who live in poverty is unacceptably high. The AAP
acknowledges that race, ethnicity, and SES strongly influence health through social, physical, behavioral, and biological mechanisms (Fig 1) as fundamental causes, mediators, and moderators of child health and predictors of adult health status. Their influences are evident in the extensive and persistent racial, ethnic, and SES disparities in children’s health documented in the literature. Furthermore, these health disparities may persist through adulthood, leading to high health care expenses, increased work absenteeism (with reduced productivity), disability, and unemployment later in life. Despite these well-documented disparities and the importance of these factors, their measurement is challenging, both operationally and procedurally. The AAP strongly recommends the following:
• Recognizing that early life experi-ences can shape health across the life course and across generations, research to understand and ad-dress disparities related to race, TABLE 2 Continued
Construct Sample Measure
Perceived family social status76 Imagine that this ladder pictures how American society is set up.
♦At the top of the ladder are the people who are the best off: They have the most money, the highest amount of schooling, and the jobs that bring the most respect.
♦At the bottom are people who are the worst off: They have the least money, little or no education, no job, or jobs that no one wants or respects.
ethnicity, and SES must be prioritized.
• Child health studies including quality improvement research should measure race, ethnicity, and SES to improve their definitions and increase understanding of how these factors and their complex interrelationships affect child health. As guidelines on use and reporting of race and ethnicity data have recommended, researchers should be thoughtful and clear on the reason for use of these varia-bles and how they were measured, distinguish between the variables as risk factors or risk markers, and adjust for and interpret differences in the context of all conceptually relevant factors, including SES.21
• Researchers should consider both biological and social mechanisms of action in relation to race, ethnicity, and SES as they relate to the aims and hypotheses of the specific area of investigation. It is important to measure these variables, but it is not sufficient to use these categories alone as explanatory for differences in disease, morbidity, and outcomes without attention to both the bi-ological and social influences they have on health throughout the life course. If data relevant to the un-derlying social or biological mecha-nisms have not been collected or are unavailable, researchers should dis-cuss their absence as a limitation of the presented research.
• Scientists who study child and ad-olescent health and development should understand the multiple measures used to assess race, eth-nicity, and SES, including their val-idity and shortcomings. They must apply and, if need be, create re-search methods that will result in careful definitions of these complex constructs and their influences on child and adolescent health, analy-sis of interactions between them, and, ultimately, elucidation of the mechanisms of their effects on health throughout the life course.
• More research and funding on how race, ethnicity, and SES affect health and health care over the life course in the United States and in-ternationally are needed. Potential areas for investigation include elu-cidation of the life course effects of race, ethnicity, and SES from pre-natal through adulthood, the mechanisms underlying these effects, and ways to ameliorate negative outcomes. With this knowledge, effective intervention strategies can be developed and disseminated to improve the health of children and the adults they will become.
LEAD AUTHORS
Tina L. Cheng, MD, MPH, FAAP Elizabeth Goodman, MD, FAAP
COMMITTEE FOR PEDIATRIC RESEARCH, 2014–2015
Tina L. Cheng, MD, MPH, Chairperson Clifford W. Bogue, MD, FAAP Alyna T. Chien, MD, FAAP J. Michael Dean, MD, MBA, FAAP Anupam B. Kharbanda, MD, MSc, FAAP Eric S. Peeples, MD, FAAP
Ben Scheindlin, MD, FAAP
LIAISONS
Tamera Coyne-Beasley, MD, FAAP–Society for Adolescent Health and Medicine
Linda DiMeglio, MD, MPH, FAAP–Society for Pediatric Research
Denise Dougherty, PhD–Agency for Healthcare Research and Quality
Alan E. Guttmacher, MD, FAAP–National Institute of Child Health and Human Development
Robert H. Lane, MD, FAAP–Association of Medical School Pediatric Department Chairs
John D. Lantos, MD, FAAP–American Pediatric Society
Cynthia Minkovitz, MD, MPP, FAAP–Academic Pediatrics Association
Madeleine Shalowitz, MD, MBA, FAAP–Society for Developmental and Behavioral Pediatrics
Stella Yu, ScD–Maternal and Child Health Bureau
PAST CONTRIBUTING COMMITTEE MEMBER
Michael D. Cabana, MD, MPH, FAAP
PAST CONTRIBUTING LIAISONS
Gary L. Freed, MD, MPH, FAAP Elizabeth Goodman, MD, FAAP
STAFF
William Cull, PhD
REFERENCES
1. US Census Bureau. Most children younger than age 1 are minorities, Census Bureau reports [press release]. Washington, DC: US Census Bureau; May 17, 2012. Available at: www.census.gov/ newsroom/releases/archives/ population/cb12-90.html. Accessed March 14, 2013
2. Federal Interagency Forum on Child and
Family Statistics. America’s children in
brief: key national indicators of well-being, 2013. Demographic background. Available at: www.childstats.gov/ americaschildren/demo.asp. Accessed July 5, 2014
3. Chau M, Thampi K, Wight VR. Basic facts about low-income children, 2009, children under age 18. New York, NY: National Center for Children in Poverty; October 2010. Available at: www.nccp. org/publications/pub_975.html. Accessed March 12, 2013
4. Child Trends. Parental education. May 2013. Available at: www.childtrendsdata. org. Accessed May 27, 2014
5. Seith D, Isakson E. Who are America’s
poor children? Examining health disparities among children in the United States. New York, NY: National Center for Children in Poverty; January 2011. Available at: www.nccp.org/publications/ pub_1001.html. Accessed March 14, 2013
6. Council on Community Pediatrics and Committee on Native American Child
Health. Policy statement—health equity
and children’s rights.Pediatrics. 2010;
125(4):838–849
7. Flores G; Committee on Pediatric
Research. Technical report—racial and
ethnic disparities in the health and
health care of children.Pediatrics. 2010;
125(4). Available at: www.pediatrics.org/ cgi/content/full/125/4/e979
8. Cheng TL, Dreyer BP, Jenkins RR. Introduction: child health disparities and
health literacy.Pediatrics. 2009;124
(suppl 3):S161–S162
9. National Research Council and Institute of Medicine, Committee on Evaluation of
Children’s Health, Board on Children,
Youth and Families, Division of Behavioral and Social Sciences and Education.Children’s Health, the Nation’s Wealth: Assessing and Improving Child
Health. Washington, DC: National
10. Rose G. Sick individuals and sick popula-tions.Int J Epidemiol. 1985;14(1):32–38
11. Evans RC, Barer ML, Marmor TR.Why Are
Some People Healthy and Others Not? New York, NY: Aldine de Gruyter; 1994
12. Heymann J, Hertzman C, Barer ML, Evans
RC.Healthier Societies: From Analysis to
Action. New York, NY: Oxford University
Press; 2006
13. Adler NE, Boyce T, Chesney MA, et al. Socioeconomic status and health. The
challenge of the gradient.Am Psychol.
1994;49(1):15–24
14. Krieger N, Rowley DL, Herman AA, Avery B, Phillips MT. Racism, sexism, and social class: implications for studies of health,
disease, and well-being.Am J Prev Med.
1993;9(6 suppl):82–122
15. Smedley A, Smedley BD. Race as biology
isfiction, racism as a social problem is
real: anthropological and historical perspectives on the social construction
of race.Am Psychol. 2005;60(1):16–26
16. Institute of Medicine.Unequal Treatment:
Confronting Racial and Ethnic Disparities
in Health Care. Washington, DC: National
Academies Press; 2003:523–525
17. Williams DR, Lavizzo-Mourey R, Warren RC. The concept of race and health
status in America.Public Health Rep.
1994;109(1):26–41
18. Wynia MK, Ivey SL, Hasnain-Wynia R.
Collection of data on patients’race and
ethnic group by physician practices.
N Engl J Med. 2010;362(9):846–850
19. Cooper RS, Kaufman JS, Ward R. Race
and genomics.N Engl J Med. 2003;
348(12):1166–1170
20. Burchard EG, Ziv E, Coyle N, et al. The importance of race and ethnic background in biomedical research and
clinical practice.N Engl J Med. 2003;
348(12):1170–1175
21. Kaplan JB, Bennett T. Use of race and ethnicity in biomedical publication.
JAMA. 2003;289(20):2709–2716
22. Rosenberg NA, Pritchard JK, Weber JL, et al. Genetic structure of human
populations.Science. 2002;298(5602):
2381–2385
23. Parra EJ, Marcini A, Akey J, et al. Estimating African American admixture
proportions by use of population-specific
alleles.Am J Hum Genet. 1998;63(6):
1839–1851
24. Solovieff N, Hartley SW, Baldwin CT, et al. Ancestry of African Americans with
sickle cell disease.Blood Cells Mol Dis.
2011;47(1):41–45
25. Bamshad M. Genetic influences on
health: does race matter?JAMA. 2005;
294(8):937–946
26. Lewontin RC, Rose S, Kamin LJ.Not in Our
Genes: Biology, Ideology and Human
Nature. New York, NY: Pantheon Books;
1984
27. Shriner D, Adeyemo A, Ramos E, Chen G, Rotimi CN. Mapping of disease-associated variants in admixed
populations.Genome Biol. 2011;12(5):223
28. Office of Management and Budget.
Revisions to the standards for the
classification of federal data on race and
ethnicity.Fed Regist. 1997;62(210):
58782–58790
29. Institute of Medicine.Race, Ethnicity, and
Language Data: Standardization for
Healthcare Quality Improvement.
Washington, DC: National Academies Press; 2009
30. US Department of Health and Human
Services, Office of Minority Health. Data
collection standards for race, ethnicity, sex, primary language, and disability status. Available at: http://minorityhealth. hhs.gov/templates/content.aspx?ID= 9227&lvl=2&lvlID=208. Washington, DC: US Department of Health and Human Services; 2011. Accessed March 14, 2013
31. Jones CP. Confronting institutionalized
racism.Phylon. 2003;50(1/2):7–22
32. Jones CP, Truman BI, Elam-Evans LD, et al.
Using“socially assigned race”to probe
white advantages in health status.Ethn
Dis. 2008;18(4):496–504
33. Massey DS, Charles CZ, Lundy G, Fischer
MJ.The Source of the River: The Social
Origins of Freshmen at America’s
Selective Colleges and Universities.
Princeton, NJ: Princeton University Press; 2003
34. Pachter LM, Coll CG. Racism and child health: a review of the literature and
future directions.J Dev Behav Pediatr.
2009;30(3):255–263
35. LaVeist TA. Beyond dummy variables and sample selection: what health services researchers ought to know about race
as a variable.Health Serv Res. 1994;
29(1):1–16
36. Shavers VL, Fagan P, Jones D, et al. The state of research on racial/ethnic discrimination in the receipt of health
care.Am J Public Health. 2012;102(5):
953–966
37. Schulman KA, Berlin JA, Harless W, et al.
The effect of race and sex on physicians’
recommendations for cardiac
catheterization.N Engl J Med. 1999;
340(8):618–626
38. Todd KH, Samaroo N, Hoffman JR. Ethnicity as a risk factor for inadequate
emergency department analgesia.JAMA.
1993;269(12):1537–1539
39. Krieger N. Methods for the scientific
study of discrimination and health: an
ecosocial approach.Am J Public Health.
2012;102(5):936–944
40. Gee GC, Walsemann KM, Brondolo E. A life course perspective on how racism may
be related to health inequities.Am J
Public Health. 2012;102(5):967–974
41. Geronimus AT. The weathering hypothesis and the health of African-American women and infants: evidence and
speculations.Ethn Dis. 1992;2(3):207–221
42. Sanders-Phillips K, Settles-Reaves B, Walker D, Brownlow J. Social inequality and racial discrimination: risk factors for health disparities in children of color.
Pediatrics. 2009;124(suppl 3):S176–S186
43. Geronimus AT, Hicken M, Keene D, Bound
J.“Weathering”and age patterns of
allostatic load scores among blacks and
whites in the United States.Am J Public
Health. 2006;96(5):826–833
44. Sawyer PJ, Major B, Casad BJ, Townsend SSM, Mendes WB. Discrimination and the stress response: psychological and physiological consequences of anticipating prejudice in interethnic
interactions.Am J Public Health. 2012;
102(5):1020–1026
45. Collins JW Jr, David RJ, Handler A, Wall S, Andes S. Very low birthweight in African American infants: the role of maternal exposure to interpersonal racial
discrimination.Am J Public Health. 2004;
94(12):2132–2138
46. Krieger N. The making of public health
data: paradigms, politics, and policy.J
Public Health Policy. 1992;13(4):412–427
the health care setting.J Health Care
Poor Underserved. 2008;19(3):697–730
48. Bastos JL, Celeste RK, Faerstein E, Barros AJD. Racial discrimination and health: a systematic review of scales with a focus on their psychometric
properties.Soc Sci Med. 2010;70(7):
1091–1099
49. Krieger N, Carney D, Lancaster K, Waterman PD, Kosheleva A, Banaji M. Combining explicit and implicit measures of racial discrimination in
health research.Am J Public Health.
2010;100(8):1485–1492
50. Carney DR, Banaji MR, Krieger N. Implicit measures reveal evidence of personal
discrimination.Self Ident. 2010;9(2):
162–176
51. Cooper LA, Roter DL, Carson KA, et al. The
associations of clinicians’implicit
attitudes about race with medical visit communication and patient ratings of
interpersonal care.Am J Public Health.
2012;102(5):979–987
52. Sabin JA, Greenwald AG. The influence of
implicit bias on treatment recommendations for 4 common pediatric conditions: pain, urinary tract
infection, attention deficit hyperactivity
disorder, and asthma.Am J Public
Health. 2012;102(5):988–995
53. Zambrana RE, Carter-Pokras O. Role of acculturation research in advancing science and practice in reducing health
care disparities among Latinos.Am J
Public Health. 2010;100(1):18–23
54. Thomson MD, Hoffman-Goetz L. Defining
and measuring acculturation: a systematic review of public health studies with Hispanic populations in the
United States.Soc Sci Med. 2009;69(7):
983–991
55. Lara M, Gamboa C, Kahramanian MI, Morales LS, Bautista DE. Acculturation and Latino health in the United States: a review of the literature and its
sociopolitical context.Annu Rev Public
Health. 2005;26:367–397
56. Wallace PM, Pomery EA, Latimer AE, Martinez JL, Salovey P. A review of acculturation measures and their utility
in studies promoting Latino health.Hisp
J Behav Sci. 2010;32(1):37–54
57. Shalowitz MU, Sadowski LM, Kumar R, Weiss KB, Shannon JJ. Asthma burden in a citywide, diverse sample of elementary
schoolchildren in Chicago.Ambul
Pediatr. 2007;7(4):271–277
58. Galobardes B, Lynch J, Smith GD. Measuring socioeconomic position in
health research.Br Med Bull. 2007;
81–82:21–37
59. Marmot M, Wilkinson RG, eds.Social
Determinants of Health. Oxford, England:
Oxford University Press; 1999
60. World Health Organization.Commission
on Social Determinants of Health. Closing the Gap in a Generation: Health Equity Through Action on the Social
Determinants of Health. Geneva,
Switzerland: World Health Organization; 2008
61. Krieger N, Williams DR, Moss NE. Measuring social class in US public health research: concepts,
methodologies, and guidelines.Annu Rev
Public Health. 1997;18:341–378
62. Braveman PA, Cubbin C, Egerter S, et al. Socioeconomic status in health
research: one size does notfit all.JAMA.
2005;294(22):2879–2888
63. Knudsen EI, Heckman JJ, Cameron JL, Shonkoff JP. Economic, neurobiological, and behavioral perspectives on building
America’s future workforce.Proc Natl
Acad Sci USA. 2006;103(27):10155–10162
64. Wilkinson RG.Unhealthy Societies: The
Afflictions of Inequality. London, England: Routedge; 1996
65. Kennedy BP, Kawachi I, Prothrow-Stith D. Income distribution and mortality: cross sectional ecological study of the Robin
Hood index in the United States.BMJ.
1996;312(7037):1004–1007
66. Kaplan GA, Pamuk ER, Lynch JW, Cohen RD, Balfour JL. Inequality in income and mortality in the United States: analysis of
mortality and potential pathways.BMJ.
1996;312(7037):999–1003
67. Wise PH, Blair ME. The UNICEF report on
child well-being.Ambul Pediatr. 2007;
7(4):265–266
68. Cohen S, Janicki-Deverts D, Chen E, Matthews KA. Childhood socioeconomic
status and adult health.Ann N Y Acad
Sci. 2010;1186:37–55
69. Pollitt RA, Rose KM, Kaufman JS. Evaluating the evidence for models of life course socioeconomic factors and cardiovascular outcomes: a systematic
review.BMC Public Health. 2005;5:7
70. Galobardes B, Lynch JW, Smith GD. Is the association between childhood socioeconomic circumstances and
cause-specific mortality established?
Update of a systematic review.J
Epidemiol Community Health. 2008;62(5):
387–390
71. Kaplan GA, Salonen JT. Socioeconomic conditions in childhood and ischaemic
heart disease during middle age.BMJ.
1990;301(6761):1121–1123
72. Smith GD, Ben-Shlomo Y. Geographical and social class differentials in stroke
mortality—the influence of early-life
factors: comments on papers by
Maheswaran and colleagues.J Epidemiol
Community Health. 1997;51(2):134–137
73. Kahn RS, Wilson K, Wise PH. Intergenerational health disparities:
socioeconomic status, women’s health
conditions, and child behavior problems.
Public Health Rep. 2005;120(4):399–408
74. Pollack CE, Chideya S, Cubbin C, Williams B, Dekker M, Braveman P. Should health studies measure wealth? A systematic
review.Am J Prev Med. 2007;33(3):
250–264
75. Krieger N, Chen JT, Waterman PD, Soobader MJ, Subramanian SV, Carson R. Choosing area based socioeconomic measures to monitor social inequalities in low birth weight and childhood lead poisoning: the Public Health Disparities
Geocoding Project (US).J Epidemiol
Community Health. 2003;57(3):186–199
76. Goodman E, Adler NE, Kawachi I, Frazier
AL, Huang B, Colditz GA. Adolescents’
perceptions of social status: development and evaluation of a new
indicator.Pediatrics. 2001;108(2).
Available at: www.pediatrics.org/cgi/ content/full/108/2/e31
77. Wolff LS, Acevedo-Garcia D, Subramanian SV, Weber D, Kawachi I. Subjective social status, a new measure in health disparities research: do race/ethnicity and choice of referent group matter?
J Health Psychol. 2010;15(4):560–574
78. Goodman E, Huang B, Schafer-Kalkhoff T, Adler NE. Perceived socioeconomic status: a new type of identity that
influences adolescents’self-rated health.
J Adolesc Health. 2007;41(5):479–487
under similar conditions.Health Aff
(Millwood). 2011;30(10):1880–1887
80. Sexton K, Olden K, Johnson BL.
“Environmental justice”: the central role
of research in establishing a credible
scientific foundation for informed
decision making.Toxicol Ind Health.
1993;9(5):685–727
81. LaVeist TA. Disentangling race and socioeconomic status: a key to understanding health inequalities.
J Urban Health. 2005;82(2 suppl 3):
iii26–iii34
82. Robert Wood Johnson Foundation.
America’s Health Insurance Plans.
Collection and Use of Race and Ethnicity Data for Quality Improvement. Princeton,
NJ: Robert Wood Johnson Foundation;
2006. Available at: www.rwjf.org/files/
publications/other/2006AHIP-RWJFSurvey.pdf. Accessed March 14, 2013
83. Baker DW, Cameron KA, Feinglass J, et al.
Patients’attitudes toward health care
providers collecting information about
their race and ethnicity.J Gen Intern
Med. 2005;20(10):895–900
84. Baker DW, Cameron KA, Feinglass J, et al. A system for rapidly and accurately
collecting patients’race and ethnicity.
Am J Public Health. 2006;96(3):532–537
85. Patient Protection and Affordable Care Act. (Pub L No. 111-148 [2010]). Part II: Section 4302, Title XXXI: Data collection,
analysis and quality. Available at: http:// thomas.loc.gov/cgi-bin/query/z?c111:H. R.3590.enr. Accessed March 14, 2013
86. American Academy of Pediatrics, Committee on Native American Child Health and Committee on Community Health Services. Ethical considerations in
research with socially identifiable
populations.Pediatrics. 2004;113(1 Pt 1):
148–151. Reaffirmed 2008
87. Adler NE, Epel ES, Castellazzo G, Ickovics JR. Relationship of subjective and objective social status with psychological and physiological functioning:
preliminary data in healthy white
women.Health Psychol. 2000;19(6):
DOI: 10.1542/peds.2014-3109 originally published online December 29, 2014;
2015;135;e225
Pediatrics
RESEARCH
Tina L. Cheng, Elizabeth Goodman and THE COMMITTEE ON PEDIATRIC
Race, Ethnicity, and Socioeconomic Status in Research on Child Health
Services
Updated Information &
http://pediatrics.aappublications.org/content/135/1/e225 including high resolution figures, can be found at:
References
http://pediatrics.aappublications.org/content/135/1/e225#BIBL This article cites 68 articles, 14 of which you can access for free at:
Subspecialty Collections
tatistics_sub
http://www.aappublications.org/cgi/collection/research_methods_-_s Research Methods & Statistics
b
http://www.aappublications.org/cgi/collection/medical_education_su Medical Education
following collection(s):
This article, along with others on similar topics, appears in the
Permissions & Licensing
http://www.aappublications.org/site/misc/Permissions.xhtml in its entirety can be found online at:
Information about reproducing this article in parts (figures, tables) or
Reprints
DOI: 10.1542/peds.2014-3109 originally published online December 29, 2014;
2015;135;e225
Pediatrics
RESEARCH
Tina L. Cheng, Elizabeth Goodman and THE COMMITTEE ON PEDIATRIC
Race, Ethnicity, and Socioeconomic Status in Research on Child Health
http://pediatrics.aappublications.org/content/135/1/e225
located on the World Wide Web at:
The online version of this article, along with updated information and services, is
by the American Academy of Pediatrics. All rights reserved. Print ISSN: 1073-0397.