False-Positive Newborn Screening Result and Future
Health Care Use in a State Medicaid Cohort
WHAT’S KNOWN ON THIS SUBJECT: There has been long-standing concern that parents of children with false-positive results for newborn-screening (NBS) tests overuse health care services because they believe their child to be persistently vulnerable to illness. Previous studies that have explored this issue have yielded conflicting results.
WHAT THIS STUDY ADDS: These analyses revealed that
Medicaid-insured term infants with false-positive NBS results did not have more health care visits than infants with normal NBS results. However, preterm infants with false-positive NBS results had more acute outpatient visits than those with normal NBS results.
abstract
OBJECTIVE:To compare health care visit rates between infants with false-positive and those with normal newborn screening (NBS) results.
PATIENTS AND METHODS:We analyzed administrative claims of Medicaid-enrolled infants born in Michigan in 2006 and calculated the average number of outpatient, emergency department, and hospital visits for infants aged 3 to 12 months according to NBS results. We calculated an adjusted incidence rate ratio for each visit category, adjusting for covariates and accounting for interaction effects.
RESULTS:Of the 49 959 infants in the analysis, 818 had a false-positive NBS result. We noted a significant interaction between gestational age and NBS results. We found that preterm, but not term, infants with false-positive results had more acute outpatient visits than their coun-terparts with normal NBS results. We found no difference in adjusted rates of other visit types (emergency department, inpatient, outpatient well) between infants with false-positive and normal NBS results, re-gardless of gestational age.
CONCLUSIONS:Increased rates of acute outpatient visits among pre-term infants with false-positive NBS screening results may be attribut-able to underlying chronic illness or parental anxiety. The absence of increased health care utilization among term infants may be unique to this Medicaid population or a subgroup phenomenon that was not detectable in this analysis.Pediatrics2011;128:715–722
AUTHORS:Beth A. Tarini, MD, MS,aSarah J. Clark, MPH,a
Subra Pilli, MS,aKevin J. Dombkowski, DrPH,aSteven J.
Korzeniewski, MSc, MA,bAcham Gebremariam, MS,aJon
Eisenhandler, PhD,cand Violanda Grigorescu, MD, MPHb
aChild Health Evaluation and Research Unit, Ann Arbor, Michigan;bMichigan Department of Community Health, Lansing, Michigan; andc3M Health Information Systems, Wallingford, Connecticut
KEY WORDS
newborn screening, false-positive results, health care service utilization, infants
ABBREVIATIONS NBS—newborn screening ED—emergency department CPT—Current Procedural Terminology E&M—evaluation and management IRR—incidence rate ratio CI—confidence interval
A portion of this work was presented at the Pediatric Academic Societies Meeting; May 1-4, 2010; Vancouver, British Columbia, Canada.
The views expressed herein do not necessarily represent those of the University of Michigan, the Eunice Kennedy Shriver National Institute of Child Health and Human Development, the Michigan Department of Community Health, or 3M.
www.pediatrics.org/cgi/doi/10.1542/peds.2010-2448
doi:10.1542/peds.2010-2448
Accepted for publication Jun 10, 2011
Address correspondence to Beth A. Tarini, MD, MS, Child Health Evaluation and Research Unit, University of Michigan, 300 N Ingalls St, Room 6C11, Ann Arbor, MI 48109-0456. E-mail: btarini@ umich.edu
PEDIATRICS (ISSN Numbers: Print, 0031-4005; Online, 1098-4275).
Copyright © 2011 by the American Academy of Pediatrics
FINANCIAL DISCLOSURE:The authors have indicated they have no financial relationships relevant to this article to disclose.
Funded by the National Institutes of Health (NIH).
gram by which newborns are screened for inherited disorders. In
2005, the American College of Medi-cal Genetics recommended that states expand their NBS panels to screen for 29 disorders. Nearly all states have complied with this rec-ommendation.1 However, screening for additional rare disorders in-creases the number of false positive results even when a highly specific test is used.2
There is concern that false-positive results increase parents’ anxiety about their child’s future health, leading to greater use of health care services.3A recent study did not find evidence of increased health care visits (outpatient, emergency, inpa-tient) in children with false-positive NBS results compared with those with normal NBS results.4 However, this study may have been subject to recall and selection bias because it involved voluntary participation and assessment of health care use by use of parental report. With that in mind, our objective was to conduct a
population-based study by using state Medicaid claims to explore whether infants with false-positive NBS results had greater future health care use than infants with normal NBS results.
PATIENTS AND METHODS
This study was approved by the institu-tional review boards of the University of Michigan and the Michigan Depart-ment of Community Health.
Source Population
The source population for this study was all infants born in Michigan in 2006 who hadⱖ11 months of Medicaid eligibility and no other health insurance .
Matching Medicaid Claims With NBS Data
The institutional review boards of the University of Michigan and the Michi-gan Department of Community Health required that the process of matching infants’ Medicaid claims with their NBS result be conducted by the Michigan Department of Community Health and that all subsequent data analysis be conducted on a deidentified data set. To improve the validity of the match, a previously validated 3-step linkage process5 was used: (1) NBS records were matched to live birth records; (2) Medicaid claims were matched to live birth records; and (3) NBS records were linked to Medicaid claims. Con-cordant/discordant data were investi-gated by hand after the final linkage was completed. Disorders included in the Michigan NBS panel are listed in Appendix 1.
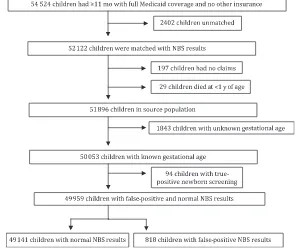
Exclusions
We excluded infants from our analysis who met any of the following criteria: died before 12 months of age; eligible for
Medicaid but did not have any claims or encounters; unknown gestational age; true-positive NBS results (Fig 1).
Independent Variables
Gestational Age, Birth Weight
Gestational age and birth weight infor-mation were obtained from each in-fant’s NBS card. Internal validity checks between the NBS card and the vital records, for which we used a cut-off of ⱖ37 weeks for term infants, demonstrated excellent concordance (98% concordance). For those infants for whom gestational age was not available from the NBS card, we deter-mined gestational age by using Inter-national Classification of Diseases, Ninth Revision, codes for gestational age from birth claims. We identified and excluded incompatible combina-tions of gestational age and birth weight by using a previously published method.6
Child Gender
The infant’s gender was obtained from the Medicaid beneficiary table. FIGURE 1
Birth Date
Because this analysis was conducted on a deidentified data set, we had to estimate each infant’s birth date. We did so by subtracting the age in months at the time of service from the date of service to calculate a birth date for each claim. The earliest calculated birth date among an infant’s set of claims served as the estimated birth date for that infant.
Utilization Outcomes
We measured health care use by counting the number of visits (repre-sented by submitted claims) for outpa-tient (well and acute visits), emer-gency department (ED), and inpatient services. If a child had multiple visits within the same visit category (outpa-tient well, outpa(outpa-tient acute, ED, inpa-tient) on a given day, then only 1 visit was counted in the analysis. If an infant had multiple visits in different visit cat-egories on a given day, each visit was counted individually with 1 exception: if an infant had an ED visit with a date of service that was identical to the ad-mission date for an inpatient claim, then we assumed that the infant had been admitted to the hospital from the ED and categorized this visit as an in-patient visit or hospitalization.
We counted only visits from 3 to 12 months of age because infants with false-positive NBS results may use health care services in the first 2 months of life for evaluation of their positive screening result. Because pre-term infants often have lengthy hospi-tal stays after birth, we checked to see how many preterm infants were still in the hospital at 2 months of age. Of those preterm infants for whom we had birth admission claims (n ⫽
4840), 95% were discharged from the hospital before 2 months of age.
We classified a claim as an outpatient visit for acute care if the claim con-tained any of the following Current
Procedural Terminology(CPT) evalua-tion and management (E&M) codes: 99201–99205 (new patients); 99211– 99215 (established patients); and 99241–99245 (office consultation). We used the following CPT E&M codes to identify outpatient visits for well-child care: 99381–99386 (new patients) and 99391–99397 (established patients).
We analyzed ED visits, observation care visits, and urgent care visits as 1 visit category because all of these visits oc-cur in similar care settings and similar services are provided. We classified a claim as an ED visit if a claim contained either of the following: a revenue code (045x) or a CPT E&M code (99281– 99285). We classified a claim as an ob-servation care or urgent care visit if the claim had any of the following codes: 99217–99220, 99234 –99236, or G0381–G0383 (CPT codes) or 700 (cast room), 760 –762 (specialty room/ob-servation room), or 769 (other treat/ observation room) (revenue codes).
We identified inpatient visits as claims that had a billing revenue code of 100 through 179 or 190 through 219 and 2 of the 3 following elements: admission date; discharge date; length of stay. When an infant was transferred to an-other hospital during an admission, we counted the infant as having a sin-gle hospitalization.
Chronic Illness
Because chronic illness can confound the relationship between NBS result type and health care utilization, we ac-counted for chronic illness among the study population by using the Clinical Risk Group (CRG) software system de-veloped by 3M (Wallingford, CT). With this software we analyzed administra-tive claims for visits, procedures, and medication use and assigned children to 9 different health status groups (healthy, significant acute illness, and 7 chronic illness groups). In previously published studies this software was
used to assess chronic illness in a co-hort of pediatric patients who were covered by Medicaid.7,8For this analy-sis, we created a dichotomous chronic illness variable: no chronic illness (a CRG status of healthy or significant acute) versus chronic illness (any of 7 CRG chronic illness health status lev-els). Each individual assigned to a health status level also had a primary chronic disease (PCD) that repre-sented the most significant chronic condition for which the infant was un-der active treatment. We have pro-vided a list of the top 5 PCDs for infants with false-positive and normal NBS re-sults (Appendix 2).
Statistical Analysis
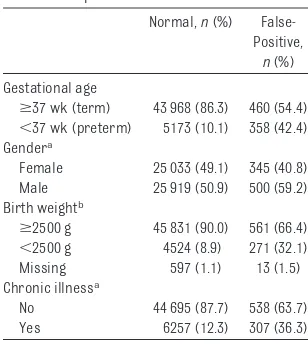
Our objective for this study was to compare outpatient, ED, and inpatient visits between infants with false-positive NBS results and infants with normal NBS results. We performed2 tests on demographic characteristics stratified according to NBS result type (Table 1). We also calculated the num-ber of infants with false-positive re-sults for various disorders or metabo-lites, categorized these results either as an endocrine or a metabolic abnor-mality, and stratified them according to gestational age (Table 2).
TABLE 1 Demographics of the Study Population
Normal,n(%) False-Positive,
n(%)
Gestational age
ⱖ37 wk (term) 43 968 (86.3) 460 (54.4) ⬍37 wk (preterm) 5173 (10.1) 358 (42.4) Gendera
Female 25 033 (49.1) 345 (40.8) Male 25 919 (50.9) 500 (59.2) Birth weightb
ⱖ2500 g 45 831 (90.0) 561 (66.4) ⬍2500 g 4524 (8.9) 271 (32.1) Missing 597 (1.1) 13 (1.5) Chronic illnessa
No 44 695 (87.7) 538 (63.7) Yes 6257 (12.3) 307 (36.3)
aP⬍.001. bP⬍.05.
We calculated the average and total numbers of visits in each health care visit category according to gestational age (preterm versus term). Using neg-ative binomial regression to account for overdispersion,9we calculated an unadjusted and adjusted incidence rate ratio (IRR) for each visit category. The adjusted model included covari-ates for gender, birth weight, gesta-tional age, and chronic illness. Prompted by our clinical experience, we explored an interaction effect be-tween gestational age (preterm ver-sus term) and NBS screening result (false-positive versus normal). We then calculated the predicted rates of visits on the basis of the presence of the interaction. By slicing interactions, we tested the difference in visit rates between infants with false-positive and infants with normal NBS results for each gestational age (eg, preterm
and term) in those visit categories in which the interaction was significant.
RESULTS
Study Population
After we applied exclusion criteria to the matched study population, there were 49 141 infants with normal NBS results and 818 with false-positive NBS results. Of the term infants with false-positive results, 282 had an endocrine abnormality and 178 had a metabolic abnormality (Table 2). Infants with false-positive results were more likely to be male, have a birth weight of
⬍2500 g, and have a chronic illness (Table 1).
Health Care Visits
We calculated the visit rates for infants for each type of heath care visit cate-gory (Table 3). In unadjusted analyses,
1.36 [95% confidence interval (CI): 1.26 –1.46]), emergency visits (IRR: 1.16 [95% CI: 1.05–1.28]), and hospital-izations (IRR: 2.71 [95% CI: 2.14 –3.44]) for infants with false-positive NBS re-sults but no difference for outpatient well visits (IRR: 1.02 [95% CI: 0.97– 1.07]). After adjustment for gender, birth weight, gestational age, and chronic illness, infants with false-positive NBS results remained more likely to have additional acute outpa-tient visits (IRR: 1.07 [95% CI: 1.00 – 1.15]) but not outpatient well visits (IRR: 1.0 [95% CI: 0.96 –1.05]), emer-gency visits (IRR: 0.95 [95% CI: 0.86 – 1.05]), or hospitalizations (IRR: 1.19 [95% CI: 0.96 –1.47]).
However, we noted differences in visit rates across different health care visit categories according to gestational age (Table 3). We then found a signifi-cant interaction between gestational age and NBS result type (eg, false-positive or normal) in the adjusted model for outpatient acute visits (P⫽
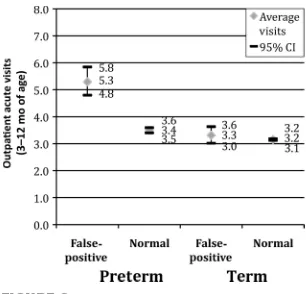
.004) but not for any of the other types of health care visit categories. The ad-justed predicted mean rates for acute outpatient visits were highest for pre-term infants who received false-positive results even after we adjusted for chronic illness (Fig 2). After adjust-ment of data for confounders and in-teraction effects, preterm infants with false-positive NBS results had more acute outpatient visits than preterm infants with normal NBS results (P⫽
.001). However, term infants with
false-Endocrine 282 268
Congenital hypothyroidism 233 51
Congenital adrenal hyperplasia 49 217
Metabolic 178 90
Biotinidase 119 34
Propionic acidemia 14 7
3-Methylcrotonyl-CoA carboxylase deficiency (3MCC) 14 0
Acyl-carnitine abnormality 13 41
Argininemia 0 1
Carnitine palmitoyl transferase IA/II deficiency (CPT1A/CPT2) 5 1 Short-chain acyl-CoA dehydrogenase deficiency (SCAD) 5 0 Medium/short-chain L-3-hydroxy acyl-CoA dehydrogenase deficiency (M/SCHAD) 4 0
Carnitine uptake deficiency 1 1
Isovaleric acidemia 1 3
Phenylketonuria (PKU) 1 0
Homocystinuria 0 1
Isolated elevation 0 1
Very long-chain acyl-CoA dehydrogenase deficiency (VLCAD) 1 0
CoA indicates coenzyme A.
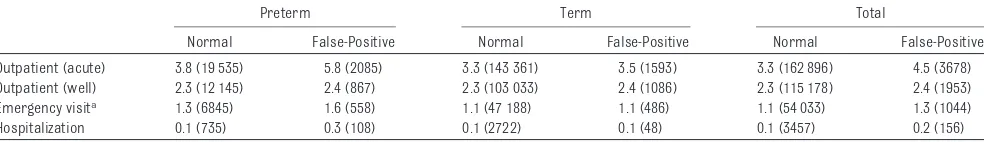
TABLE 3 Health Care Visit Rates (Unadjusted) of Children According to Newborn Screening Result and Gestational Age
Preterm Term Total
Normal False-Positive Normal False-Positive Normal False-Positive
Outpatient (acute) 3.8 (19 535) 5.8 (2085) 3.3 (143 361) 3.5 (1593) 3.3 (162 896) 4.5 (3678) Outpatient (well) 2.3 (12 145) 2.4 (867) 2.3 (103 033) 2.4 (1086) 2.3 (115 178) 2.4 (1953)
Emergency visita 1.3 (6845) 1.6 (558) 1.1 (47 188) 1.1 (486) 1.1 (54 033) 1.3 (1044)
Hospitalization 0.1 (735) 0.3 (108) 0.1 (2722) 0.1 (48) 0.1 (3457) 0.2 (156)
Rates per child (visits).
positive NBS results did not have more acute outpatient visits than term in-fants with normal NBS results (P ⫽
.64).
DISCUSSION
Since the early days of NBS, there has been concern that parents of infants with false-positive NBS results overuse health care services because they be-lieve their child to be persistently vul-nerable to illness.10 Previous studies that have used voluntary enrollment of study participants instead of a population-based methodology have yielded conflicting results.3,4
In this study, which represents the largest and only population-based analysis to date, we found that only preterm infants with false-positive NBS results had more acute outpatient visits than their preterm counterparts with normal NBS results. We did not find such a difference among term in-fants. Furthermore, regardless of pre-maturity status, we found no differ-ence in outpatient well visits, ED visits, or hospitalizations between infants with false-positive and those with nor-mal NBS results.
There are a number of possible expla-nations for our findings. First, it is pos-sible that parents of premature in-fants with false-positive NBS results make more acute outpatient visits
be-cause they are overanxious about both the child’s history of prematurity and the false-positive NBS result. However, others might counter that parents of preterm infants deal with so many con-cerns about their child’s tenuous health that parents are unlikely to pay much attention to a false-positive NBS result. Second, it is conceivable that preterm infants with false-positive NBS results have more acute outpa-tient visits because of their underlying chronic illness. Premature infants are known to have a higher rate of false-positive results because of illness-related stress11and the use of screen-ing cutoffs based on studies of term infants.12,13 So it is possible that, de-spite our best efforts, we were unable to fully control for the confounding in-fluence of chronic illness on health care use in preterm infants with false-positive results. Nonetheless, addi-tional studies should be performed to examine the psychosocial effects of a false-positive NBS result on parents of preterm infants. Finally, although case reports have identified cases in which infants with false-positive results have been inappropriately diagnosed as disease free,14 this phenomenon is likely to be uncommon and thus is not likely to account for our study findings.
We did not find any differences be-tween infants with false-positive and those with normal NBS results for other health care visit types (eg, well visits, ED visits, hospitalizations), re-gardless of prematurity status. There are a number of plausible explana-tions for this null finding. First, it is possible that the phenomenon of pa-rental anxiety that leads to increased health care use15is present only in cer-tain subgroups, such as parents who had difficulty conceiving, those with pregnancy complications, or even first-time parents. These subgroups may be “primed” to become concerned about the lasting significance of their
child’s false-positive NBS result. If so, it is unlikely that these subgroups will be identified in an aggregate analysis of a study population.
Alternatively, it may be that there are certain types of false-positive results, such as those for disorders that can be more immediately life-threatening, such as MCADD (medium chain acyl CoA dehydrogenase deficiency). Hear-ing that their newborn may have a po-tentially life-threatening illness leave a more powerful and lasting effect on parents’ perceptions of their child’s health than if they had been told that that the disorder was not immediately life threatening.16We had neither suffi-cient numbers of these disorders nor the necessary parental medical and social information to explore either of these hypotheses in the current analysis.
It is conceivable that our findings are unique to a continuously enrolled Med-icaid population. Children with private insurance have greater outpatient health care use than children with public insurance.17 Although some of this discrepancy in use may be be-cause of lack of access to care among the publicly insured, it could also be fueled by the phenomenon of the “wor-ried well.” Future studies will need to examine the relationship between false-positive NBS results and health care use in a privately insured population.
There are limitations of this study that should be noted. As evidenced by the fact that every child in our analysis did not have a claim record for their birth admission (n⫽8729 [17%]), it is likely that our collection of claims did not represent all of the health care visits for the study population. Nonetheless, we have no reason to suspect there would be a differential bias for missing claims according to NBS result. As noted above, we may not have com-pletely controlled for chronic illness, FIGURE 2
Figure 2. Adjusted predicted mean visit rates for children according to NBS result and gesta-tional age.
because we examined only health care use in the first 12 months of life, chil-dren may not have had enough oppor-tunities to seek acute care for illness. As a result, we might have failed to de-tect a difference between infants with false-positive and normal NBS results that would become evident in the next few years of life when the ratio of acute to well health care visits rises.
In addition, it is important to recognize that increased health care utilization is only one potential manifestation of parental anxiety about false-positive NBS results. Although we did not find a link between false-positive NBS results and increased health care visits, we cannot rule out that parental anxiety about false-positive results may have been present and could conceivably have been manifested through other actions, such as decisions to forego fu-ture childbearing or restriction of the child’s activity.18Additional studies are needed to explore the presence and
parental anxiety regarding false-positive NBS results.
CONCLUSIONS
We believe that our study findings high-light the potential complexity of the re-lationship between false-positive NBS results and future health care use. We were unable to find a difference in health care visits between term in-fants with false-positive results and those with normal NBS results in a Medicaid population. However, be-cause a parent’s worry about his/her child’s health predicts health care use for that child,15it may be that the rela-tionship between false-positive NBS re-sults and health care use exists only in certain subgroups of the population who are prone to being more worried about their child’s health. Nonetheless, in this study we have demonstrated that it is important that future studies of the effect of false-positive results on future health care use account for the
ACKNOWLEDGMENTS
This project was funded by the Robert Wood Johnson Health and Society Scholars Small Grant Award, the Mich-igan Institute for Clinical and Health Research, and an intramural grant through the department of pediatrics at the University of Michigan. This work was conducted with a research license from 3M corporation and was not funded by the 3M corporation. Dr Tarini was supported by the Clinical Sciences Scholars Program at the Uni-versity of Michigan and a K23 Men-tored Patient-Oriented Research Ca-reer Development Award from the Eunice Kennedy Shriver National Insti-tute of Child Health and Human Devel-opment (K23HD057994).
We acknowledge Lisa Cohn and Dr John Neff for their helpful comments with data analysis and Dr Piero Rinaldo for his thoughtful comments during the preparation of the manuscript.
REFERENCES
1. National Newborn Screening and Genetics Resource Center. National Newborn Screening Status Report, 2010. Austin, TX: University of Texas Health Science Center; 2010
2. Tarini BA, Christakis DA, Welch HG. State newborn screening in the tandem mass spectrometry era: more tests, more false-positive results.Pediatrics. 2006;118(2): 448 – 456
3. Waisbren SE, Albers S, Amato S, et al. Effect of expanded newborn screening for bio-chemical genetic disorders on child out-comes and parental stress.JAMA. 2003; 290(19):2564 –2572
4. Lipstein EA, Perrin JM, Waisbren SE, Prosser LA. Impact of false-positive new-born metabolic screening results on early health care utilization.Genet Med. 2009; 11(10):716 –721
5. Korzeniewski SJ, Grigorescu V, Copeland G, et al. Methodological innovations in data gathering: newborn screening linkage with live births records, Michigan, 1/2007–3/
2008.Matern Child Health J. 2010;14(3): 360 –364
6. Dombkowski KJ, Leung SW, Gurney JG. Pre-maturity as a predictor of childhood asthma among low-income children.Ann Epidemiol. 2008;18(4):290 –297
7. Neff JM, Sharp VL, Muldoon J, Graham J, Myers K. Profile of medical charges for chil-dren by health status group and severity level in a Washington State Health Plan. Health Serv Res. 2004;39(1):73– 89
8. Neff JM, Sharp VL, Muldoon J, Graham J, Popalisky J, Gay JC. Identifying and classify-ing children with chronic conditions usclassify-ing administrative data with the clinical risk group classification system.Ambul Pediatr. 2002;2(1):71–79
9. Cameron LD, Sherman KA, Marteau TM, Brown PM. Impact of genetic risk informa-tion and type of disease on perceived risk, anticipated affect, and expected conse-quences of genetic tests. Health Psychol. 2009;28(3):307–316
10. Rothenberg MB, Sills EM. Iatrogenesis: the
PKU anxiety syndrome.J Am Acad Child Psy-chiatry. 1968;7(4):689 – 692
11. Torresani T GA, Scherz R, Burckhardt JJ, Harras A, Zachmann A. Improving the effi-cacy of newborn screening for congenital adrenal hyperplasia by adjusting the cut-off level of 17-hydroxyprogesterone to gestational age.Screening. 1994;3:77– 84
12. Zytkovicz TH, Fitzgerald EF, Marsden D, et al. Tandem mass spectrometric analysis for amino, organic, and fatty acid disorders in newborn dried blood spots: a two-year sum-mary from the New England Newborn Screening Program.Clin Chem. 2001;47(11): 1945–1955
13. Slaughter JL, Meinzen-Derr J, Rose SR, et al. The effects of gestational age and birth weight on false-positive newborn-screening rates.Pediatrics. 2010;126(5):910 –916
15. Janicke DM, Finney JW, Riley AW. Children’s health care use: a prospective investigation of factors related to care-seeking.Med Care. 2001;39(9):990 –1001
16. Grob R. Is my sick child healthy? Is my healthy child sick? Changing parental
expe-xzriences of cystic fibrosis in the age of ex-panded newborn screening.Soc Sci Med. 2008;67(7):1056 –1064
17. McCormick MC, Kass B, Elixhauser A, Thompson J, Simpson L. Annual report on access to and utilization of health care for
children and youth in the United States: 1999. Pediatrics. 2000;105(1 pt 3):219 – 230
18. Bergman AB, Stamm SJ. The morbidity of cardiac nondisease in schoolchildren. N Engl J Med. 1967;276(18):1008 –1013
APPENDIX 1 Disorders Included in the Michigan NBS Panel, 2006
Phenylketonuria (PKU) Isovaleric acidemia (IVA)
Benign hyperphenylalaninemia (H-PHE)
2-Methylbutyryl-CoA dehydrogenase deficiency (2MBG) Biopterin cofactor biosynthesis (BIOPT [BS]) 3-Methylcrotonyl-CoA carboxylase deficiency (3MCC) Defects of biopterin cofactor regeneration (BIOPT[Reg]) 3-OH 3-CH3 glutaric aciduria (HMG)
Maple syrup disease (MSUD) 3-Methylglutaconic aciduria (3MGA) Homocystinuria (HCY)
Beta-ketothiolase deficiency (BKT) Hypermethioninemia (MET) Glutaric acidemia type I (GA I) Citrullinemia (CIT)
Propionic acidemia (PA) Citrullinemia type II (CIT II)
Methylmalonic acidemia (mutase deficiency) (MUT) Argininosuccinic acidemia (ASA)
Methylmalonic academia (MA), also known as cobalamin A or B deficiency (CblA, CblB) Tyrosinemia type I (TYR I)
Methylmalonic academia (MA), also known as cobalamin C or D deficiency (CblC, CblD) Argininemia (ARG)
Multiple carboxylase deficiency (MCD)
Carnitine:acylcarnitine translocase deficiency (CACT) 2-Methyl 3 hydroxy butyric aciduria (2M3HBA) Carnitine palmitoyltransferase II deficiency (CPT II) Malonic acidemia (MAL)
Carnitine uptake defect (CUD)
Isobutyryl-CoA dehydrogenase deficiency (IBG)
Carnitine palmitoyltransferase IA deficiency (liver) (CPT 1A) Congenital adrenal hyperplasia (CAH)
Short-chain acyl-CoA dehydrogenase deficiency (SCAD) Congenital hypothyroidism (CH)
Glutaric acidemia type II (GA II) Galactosemia (GALT)
Medium-chain acyl-CoA dehydrogenase deficiency (MCAD) Biotinidase deficiency (BIOT)
Long-chain L-3-OH acyl-CoA dehydrogenase deficiency (LCHAD) Sickle cell anemia (HbSS)
Trifunctional protein deficiency (LCHAD/TFP) HbS/C disease (HbS/C)
Very long-chain acyl-CoA dehydrogenase deficiency (VLCAD) HbS/-thalassemia (HbS/-Th)
Medium-chain ketoacyl-CoA thiolase deficiency (MCKAT)
CoA indicates coenzyme A.
Data source: Korzeniewski SJ, Young WI, Andruszewski K, Hawkins HC.Michigan Newborn Screening Program, Annual Report, 2006. Lansing, MI: Michigan Department of Community Health. Available at: michigan.gov/documents/ mdch/Final_NBS_2006_Report_222194_7.pdf.
TESTING FOR FETAL GENDER:My wife and I have 4 children. Each pregnancy was marked by joy, eager anticipation, and many, many long discussions trying to decide on a name for our child. We had to pick out names for both girls and boys because we had always instructed the obstetrician doing the prenatal ultra-sound not to reveal the sex of the fetus. Although our discussions were not quite as bitter as those between Democrats and Republicans in Congress, they did last a long time and were marked by twists, surprises, and compromises. It turns out, however, that couples can save themselves some trouble. As reported inThe New York Times(Health: August 9, 2011), a recently published systematic review and meta-analysis of noninvasive fetal sex determination testing in
⬃6500 pregnancies found that properly performed tests hadⱖ95% sensitivity and specificity at 7 weeks’ gestation and 99% sensitivity and specificity at 20 weeks’ gestation. The review focused on tests that detect and amplify cell-free fetal DNA in maternal blood. The test kits generally use polymerase chain reac-tion to detect the fetal Y chromosome in a few drops of maternal blood. Detec-tion of the Y chromosome confirms a male infant. Failure to detect the Y chro-mosome indicates that the fetus is a girl or, possibly, that no fetal DNA was present in the sample. Although the kits have been available for several years, they are not regulated by the US Food and Drug Administration, and some have been plagued by poor specificity. The fetal DNA test kits are likely to be used by parents and physicians worried about sex-linked diseases such as Duchenne muscular dystrophy and those just anxious to know the sex of their child a little earlier. Although not usually an issue in the United States, because the kits can be used to select the sex of offspring, some manufacturers do not sell the kits in India or China, where boys are favored over girls. Although the tests are nonin-vasive, the total cost can be quite high. The test kit itself may cost $25, but once shipping and laboratory fees are calculated, the total cost may be closer to $250. As for us, we were fortunate that we did not have to worry more than usual about gender-linked illnesses, and the surprise of seeing each of our new ar-rivals greet us in the delivery room regardless of gender was priceless.
Noted by WVR, MD Infants with false-positive NBS results
Major respiratory anomalies 65
Asthma 48
Other chronic pulmonary diagnoses 29
Blindness, visual loss, and chronic eye diagnoses, major/moderate 23 Chronic endocrine, nutritional, fluid, electrolyte, and immune diagnoses 12 Infants with normal NBS results
Asthma 2286
Major respiratory anomalies 352
Ventricular and atrial-septal defects 340
Other chronic pulmonary diagnoses 318
DOI: 10.1542/peds.2010-2448 originally published online September 19, 2011;
2011;128;715
Pediatrics
Korzeniewski, Acham Gebremariam, Jon Eisenhandler and Violanda Grigorescu
Beth A. Tarini, Sarah J. Clark, Subra Pilli, Kevin J. Dombkowski, Steven J.
Medicaid Cohort
False-Positive Newborn Screening Result and Future Health Care Use in a State
Services
Updated Information &
http://pediatrics.aappublications.org/content/128/4/715
including high resolution figures, can be found at:
References
http://pediatrics.aappublications.org/content/128/4/715#BIBL
This article cites 17 articles, 4 of which you can access for free at:
Subspecialty Collections
_management_sub
http://www.aappublications.org/cgi/collection/administration:practice Administration/Practice Management
following collection(s):
This article, along with others on similar topics, appears in the
Permissions & Licensing
http://www.aappublications.org/site/misc/Permissions.xhtml
in its entirety can be found online at:
Information about reproducing this article in parts (figures, tables) or
Reprints
http://www.aappublications.org/site/misc/reprints.xhtml
DOI: 10.1542/peds.2010-2448 originally published online September 19, 2011;
2011;128;715
Pediatrics
Korzeniewski, Acham Gebremariam, Jon Eisenhandler and Violanda Grigorescu
Beth A. Tarini, Sarah J. Clark, Subra Pilli, Kevin J. Dombkowski, Steven J.
http://pediatrics.aappublications.org/content/128/4/715
located on the World Wide Web at:
The online version of this article, along with updated information and services, is
by the American Academy of Pediatrics. All rights reserved. Print ISSN: 1073-0397.