Keywords
Highlights
Abstract
Graphical abstract
167
Research Paper
Received 2018-01-21 Revised 2018-03-25 Accepted 2018-03-25 Available online 2018-03-25
Reverse osmosis Seawater desalination Spiral wound membrane Long-term performance Boron removal
• Time-dependent pilot-scale RO tests with natural seawater were performed. • An obvious decline in permeate flux was observed after long-term operation. • Boron removal with parallel membranes was slightly improved by time.
Time-Dependent Desalination Tests for Small-Scale SWRO Pilot Plant Installed at Urla Bay,
Turkey
1 Department of Chemical Engineering, Ege University, 35100 Izmir, Turkey
2 Permanent address: Department of Chemical Engineering and Applied Chemistry, Atilim University, 06830 Ankara, Turkey 3 Department of Chemistry, Ege University, 35100 Izmir, Turkey
Enver Guler
1,2, Emre Yavuz
3, Mithat Yuksel
1, Umran Yuksel
3, Nalan Kabay
1,*Article info
© 2018 MPRL. All rights reserved.
* Corresponding author at: Phone: +90-232-3112290; fax: +90-232-3117776 E-mail address: [email protected] (N. Kabay)
DOI: 10.22079/JMSR.2018.79881.1170 1. Introduction
Water is a vital resource for human life and good health. A lack of water to meet daily requirements is a reality today for one in three people around the world. According to the reports of water authorities, globally, the problem is getting worse as cities and populations grow dramatically, and the needs for water increase in agriculture, industry, and households.
Many countries do not have enough water to meet the public demand. The aquifer depletion due to excessive use becomes common. The scarcity of water is going along with a deterioration in the quality of available water due to pollution and environmental degradation. Dams and reservoirs along with
deforestation in some watersheds have reduced stream water levels, lowered water tables, degraded wetlands, and reduced freshwater aquatic diversity. The demand for groundwater in coastal cities has led to saline intrusion and ground subsidence. Climate change could also have significant impacts on water resources because of the close connections between the climate and water cycle.
The oceans hold 97% of the Earth’s water. This water is too salty for human’s consumption in irrigation, drinking, and other commercial and industrial purposes. Because of rising concerns about water scarcity and
Journal of Membrane Science & Research
journal homepage: www.msrjournal.com
In this work, performance data from a small-scale reverse osmosis (RO) plant based on seawater FilmTec spiral wound RO membranes for different periods of operation are presented and analyzed. A prototype RO set-up with a 2,200 L/d capacity was installed and operated at Urla Bay which was located in Izmir, Turkey. This study typically investigates RO performance in terms of permeate flux, salt and boron rejections. Thin-film composite membrane-based RO technology was successfully used with this RO set-up, which gave an average salt rejection of more than 95%. It was found that over a period of 36 hours of continuous operation, the permeate flux decreased by approximately 4% of its initial value but salt rejection stayed nearly constant. In this study, long-term data were also compared with a full-capacity operation using two paralleled membranes and a lowered-capacity operation with a single membrane. The results show that the small-scale RO system was successfully operated to mimic typical large-scale RO plants installed for production of potable water.
quality, and arguments over distributions of scarce water resources, a remarkable amount of effort has been devoted to developing technologies to desalinate immense quantities of seawater available. Specifically, desalination remains very expensive to be a primary source of fresh water and presents significant social, environmental, and technological obstacles that must be overcome. However, in some regions, water authorities still consider desalination as a way to overcome water scarcity problem [1].
The reverse osmosis (RO) process has undergone major improvements during the past four decades. Production of potable and drinking water from seawater is performed successfully by this method for about 30 years by now
[2–4].
The RO process has many gains when compared to the other widely used techniques for water desalination, namely, multi-stage flash (MSF) distillation. RO systems provide lower capital cost and energy requirement, smaller plant area and flexibility. In the RO process, a semipermeable membrane is used for separation of particle sizes of 5×10⁻³ – 1×10⁻⁴ µm,
including monovalent ions such as Na+ and Cl-. The separation is driven under
high pressures that range from 55 to 68 bar for seawater desalination and from 10 to 20 for brackish water desalinationn [5,6].
The RO based desalination process is an effective and reliable technology for the production of drinking water from seawater. Nevertheless, the issue of concentrate management has recently received great attention as a disadvantage of RO processes [7–10]. Untreated membrane concentrate may create a great risk to the environment because of its highly concentrated content in terms of salts, colloids and other biological and chemical materials. Therefore, cheaper concentrate handling methods are needed which are more environmentally sensitive. In order to perform concentrate management, two perspectives are usually taken into account: one of these strategies is the reduction of concentrate volume and the other is the removal specific components [8]. Reduction of concentrate volume can be performed by evaporation ponds, electrodialysis and distillation. On the other hand, removal of specific components is achieved by activated sludge, oxidation processes and ion exchange. Though the alternatives may seem to be abundant to solve the issue of concentrate management, the choice is rather complex and needs a significant consideration of the costs, environmental impacts and regulations set by legislative authorities.
In addition to concentrate handling, some other, serious limitations had recently been discovered during field practice. Among them, the boron problem seems to be a critical issue. The associated boron problem with the RO desalination process had been detected clearly during the last few years. Seawater contains approximately 5 mg/L of boron. The rejection of boron by RO is not sufficiently high, so about one-third of boron content (~1.5 mg/L) is normally found in the permeate stream. As for irrigation water, boron is required for certain metabolic activities in plants. However, higher boron levels accelerate plants decay and expiration [11]. The World Health Organization recommended the drinking water limits for boron as low as 0.3 mg B/L. Lately, the Drinking-Water Quality Committee revised the Boron Guideline Value as 2.4 mg/L, saying that “although the new guideline value is based on a human health perspective, some utilities may set seawater desalination plants product water limits as low as 0.5 mg/L to reflect
agricultural-related issues. These issues include boron’s herbicidal effect on some plant species, which is a particular concern in areas of low rainfall [12]. There are some available published research works on boron separation from seawater by RO process [11,13–15].We have published two comprehensive review papers on boron in seawater and methods for its separation from seawater as well [12,16].
In desalination, variables such as the permeate quantity and quality should be maximized for the most efficient and economical use of the process. Therefore, it is important to evaluate the variation of those characteristics, using long-term operational data. In our previously published studies, we investigated the impact of some process parameters on the efficiency of seawater desalination [17].Effect of temperature on seawater desalination was analyzed by monitoring the quality of product water [18]. In this work, long and short-term operational data of a small scale SWRO plant were collected for single and two-membrane type of operation. The permeate quantity and quality were monitored in terms of permeate flux and salt rejection, respectively. In addition, concentration of boron which was naturally found in seawater was also monitored for the permeate stream.
2. Experimental
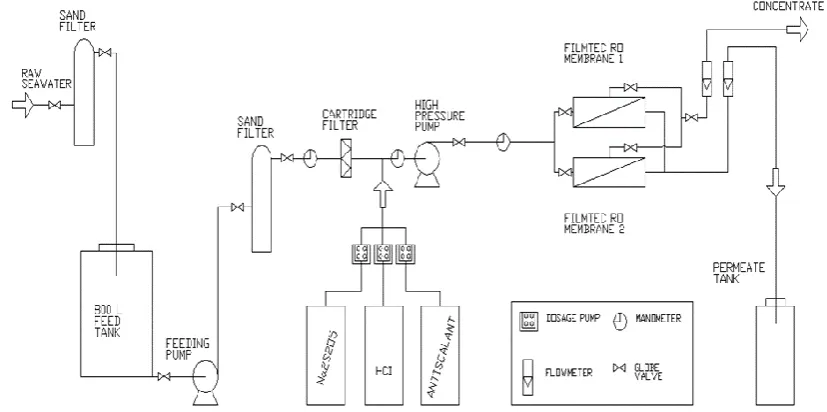
A small-scale seawater RO (SWRO) pilot system was installed in Urla Bay-Izmir, Turkey in August 2007. The complete system was comprised of sand filters; a 5-micron filter; a high-pressure pump followed by a low-pressure pump; and two low-pressure vessels of about 1 m in length, each containing a single 2.5″-diameter membrane element. Averaged feed flow rates of the high-pressure pump for single and parallel operations are 260 L/h and 290 L/h, respectively. A flow diagram of the SWRO system is depicted in
Figure 1, which explains the operation of the system.
Pre-chlorinated raw seawater was transferred from the feed tank to the low-pressure pump and after that to sand filter and cartridge filter, respectively. Pretreated seawater was later transferred to RO membranes via a high-pressure pump in order to be desalinated. Two parallel connected RO membranes were used in the pilot system. Membranes used (spiral wound FilmTecTM SW30 2540) are produced commercially by Dow Company and
they have 2.8 m2 active area each (see Table 1). Natural seawater as feed was
transferred to the RO membranes with a high pressure and water permeate was taken as product water.
Table 1
Technical specifications of the used FilmTecTM SW30 2540 membranes in this work [19].
Membrane Applied Pressure (bar)
Permeate flowratea
(m3/d)
Salt rejectiona
(%)
SW30 2540 55 2.6 99.4
a Permeate flow and salt rejection measurements are based on: 32,000 mg/L NaCl and 25°C
temperature at a permeate recovery rate of 8%.
Experiments were performed under different operational modes (single and two parallel-connected membrane configurations) for different experimental times (24 h and 36 h for demonstrating long-term, and 3 h for demonstrating short-term operations). Quality of product water was determined by some measurements such as electrical conductivity (EC), pH, total dissolved solid (TDS), salinity, and B-concentration. The measurements of EC, pH, TDS and salinity were performed by a portable conductivity meter (WTW Cond 330i/SET) and pH meter (WTW pH 315i/SET model). For TDS values of feed and concentrate side, a conversion to TDS from salinity was required by using a calibration curve regarding that device since digits of display did not allow us to get high TDS readings. After salinity measurements were done with the conductivity meter, TDS (mg/L) values were calculated by multiplication of salinities with their densities. Eventually, a correlation is obtained such that TDS (mg/L) is 1021.5 times the salinity (‰). Azomethine-H method was performed in order to determine boron concentration using UV-visible spectrophotometer (Shimadzu UV-1800 model).
3. Results and discussion
Since SWRO membrane assembly was designed as a parallel-connected type of modules, it was possible to perform experiments with either single or two parallel-connected membranes, as is shown in Figure 1. Initially, single membrane configuration was operated at a pressure of 55 bar to give about an average 54 L/h product water at a recovery rate of 20%. Table 2 shows the feed, permeate and concentrate water analysis for single-membrane operations. These tests were operated for 24 h demonstrating a long-term test and for 3 h as a short-term test.
Table 2
Quality analysis of the RO streams for single-membrane operations.
Parameters/ constituents
long-term operation (24 h) short-term operation (3 h) Feed
water
Product
water Concentrate Feed water
Product
water Concentrate
Tfeed, °C 26.8 17.1
pH 8.1 7.1 8.1 8.2 7.8 8.1
EC, µS/cm 57,700 685 69,308 59,200 528 70,600
TDS, mg/L 39,328 340 48,419 40,247 264 49,566
Salinity, ‰ 38.5 0.1 47.4 39.4 0.0 48.5
[B], mg/L 4.92 1.08 5.63 5.30 0.70 6.01
In addition to single-membrane operation, two parallel-connected membranes were operated at the same applied pressure of 55 bar. An average of 79 L/h product (i.e., permeate) water was obtained at a recovery value of 26%. These two membranes were operated for 36 h demonstrating the long-term test and for 3 h as the short-long-term test. Water analysis of these tests was tabulated in Table 3.
SWRO performance of the pilot system was monitored in terms of permeate flux, salt and boron rejections. It is worth noting that characteristics of feed water including also the temperature were assumed to be constant throughout the continuous mode of operations.
Table 3
Quality analysis of the RO streams for two parallel-connected membrane operations.
Parameters/ constituents
long-term operation (36 h) short-term operation (3 h) Feed
water
Product
water Concentrate Feed water
Product
water Concentrate
Tfeed, °C 27.4 23.0
pH 8.1 7.5 8.1 8.2 7.8 8.0
EC, µS/cm 57,300 1,948 73,746 59,400 1,840 76,567
TDS, mg/L 39,226 968 52,088 40,451 917 54,627
Salinity, ‰ 38.4 0.8 51.0 39.6 0.8 53.5
[B], mg/L 5.23 1.42 5.82 5.075 1.30 5.69
2.1. Single-membrane configuration
Operational data, spanning a period of 24 h and 3 h, were collected from the SWRO system operated in single membrane configuration. Figures 2 and 3 show the variation in permeate flux and salt rejection for the long and short-term tests, respectively.
0 2 4 6 8 10 12 14 16 18 20 22 24 26 26
27 28 29 30
Permeate Volume (L)
Permeate Flux (L/m2
h)
Perm
eat
e
F
lux
(L/
m
2 h)
Operation Time (h)
98.2 98.4 98.6 98.8
99.0 0 400 800 1200 1600 2000
Salt Rejection (%)
Salt
R
ejec
tion
(%)
Fig. 2. Variation in permeate flux and salt rejection of the membranes for long-term operation in single membrane configuration.
As shown in Figure 2, the permeate flux declined with the operation time for 24 h test. At the end of the long-term test, this decline in the permeate flux is about 5% resulting in a loss in permeate recovery as will be shown in
Figure 6. Salt rejections exhibit a slight improvement in the first 15 hours. Afterward, a significant variation of salt rejection was not observed for single membrane configuration. When the specifications of the mentioned membranes were checked, it was observed that salt rejection performance was well approximated (see Table 1). Here it should also be noted that test conditions, such as feed salinity, temperature etc., differ slightly from the ones of manufacturers.
For the short term test, it was not possible to observe any decline in the flux because it did not change as well as the salt rejection of the membrane (see Figure 3). As expected for the short term operation of 3 h, RO membranes performed well without any decline in performance. When the levels of salt rejections of modern seawater reverse osmosis membranes are known to easily be 99.5%, the membranes employed in this work were assured to be successfully operated [20].
20 40 60 80 100 120 140 160 180
18.0 18.5 19.0 19.5 20.0
Permeate Volume (L)
Permeate Flux (L/m2h)
Perm
eat
e
F
lux
(L/
m
2 h)
Operation Time (min) 98.5
99.0 99.5
100.00 40 80 120 160
Salt Rejection (%)
Salt
R
ejec
tion
(%)
For the short term test, feed water salinity was higher than the long-term test due to the variations in natural salinity (see Table 2). In addition, a direct relationship between the temperature and salinity has not been found for the natural feed (i.e., seawater) for these specific tests. In other words, at relatively lower temperatures the salinity may be higher compared to the one at high temperatures, which is contrary to our expectations. For the short term test, the feed temperature was lower than the one for long-term test. Having lower test temperature and higher feed salinity resulted in lower permeate flux in the short-term test (see Figure 3). At lower temperatures, RO membranes usually tend to provide lower flux values due to diffusivity and viscosity effects. The effects of temperature and feed salinity were also discussed in one of our previous works [18].
In Figure 4 and 5, boron removal performances of SWRO membranes were checked for long- and short-term operation, respectively. About 80% boron removal was obtained at the beginning of the long-term test and only 1% decline in boron removal performance was observed at the end of 24 h (see Figure 4). Boron removal efficiency was 88% for short term which was higher compared to the one with the long-term test (see Figure 5). The boron concentration in the permeate which was produced by the end of the short-term test had a lower value when compared to the one in long-short-term operation. Permeate boron concentration was 0.65 mg/L and this value was 1.0 mg/L for long-term test. From the literature, it is known that RO membranes may encounter membrane compaction due to the high pressure. This compaction allows the reduced boron passage resulting in improved boron rejection [21]. However, this behavior was not observed in this work using single membrane operations.
0 2 4 6 8 10 12 14 16 18 20 22 24 26
72 76 80 84
Permeate Volume (L)
Boron Rejection (%)
Boron R
ejec
tion
(%)
Operation Time (h)
0.6 0.9 1.2
1.5 0 400 800 1200 1600 2000
Permeate Boron Concentration (mg/L)
Perm
eat
e
Boron
C
onc
ent
rat
ion
(m
g/
L)
Fig. 4. The levels of permeate boron concentration and boron rejection of the membranes for long-term operation in single membrane configuration.
20 40 60 80 100 120 140 160 180
70 80 90 100
Boron Rejection (%)
Perm
eat
e
Boron
C
onc
ent
rat
ion
(m
g/
L)
Permeate Volume (L)
Operation Time (min)
0.6 0.8
1.00 40 80 120 160
Permeate Boron Concentration (mg/L)
Boron R
ejec
tion
(%)
Fig. 5. The levels of permeate boron concentration and boron rejection of the membranes for short-term operation in single membrane configuration.
Permeate recovery is a crucial parameter to determine the obtainable quantity of product water. About 20% of the feed water can be saved as permeate at the end of both long and short-term operations but permeate which was obtained by the short term test has lower electrical conductivity (EC) (see Figures 6 and 7). EC decreased from 753 μS/cm to 651 μS/cm for long-term test as a result of a decline in salt passage. This is most probably due to the membrane compaction, which is the compression of membrane under high pressure [22]. Since the membranes tested were relatively brand new, this phenomenon was most probably the case for the system in this study. This resulted in flux decline providing a lower conductivity over time.
0 2 4 6 8 10 12 14 16 18 20 22 24 26 19.0
19.2 19.4 19.6 19.8 20.0
Permeate Volume (L)
Permeate Recovery (%)
Perm
eat
e
R
ec
ov
ery
(%)
Operation Time (h)
650 700 750
0 400 800 1200 1600 2000
Permeate Conductivity (S/cm)
Perm
eat
e
C
onduct
iv
ity
(
S/
cm
)
Fig. 6. Variation in permeate recovery and conductivity for long-term operation in single membrane configuration.
The change in permeate recovery for the short test using single membrane was not significant with small fluctuations (see Figure 7). Evolution of permeate conductivity was also relatively insignificant due to the reduced test time, but still tended to decrease for a time-span of 3h.
20 40 60 80 100 120 140 160 180
19.2 19.5
19.8 Permeate Recovery (%)
Perm
eat
e
R
ec
ov
ery
(%)
Permeate Volume (L)
Operation Time (min)
510 540 570
6000 40 80 120 160
Permeate Conductivity (S/cm)
Perm
eat
e
C
onduct
iv
ity
(
S/
cm
)
Fig. 7. Variation in permeate recovery and conductivity for short-term operation in single membrane configuration.
2.2. Parallel-connected-membrane configuration
As mentioned earlier, the SWRO system at Urla Bay was also operated with two membranes which were parallel connected to each other. Differently from the 24-hour test with single membrane, the duration of the long-term test with two membranes was extended up to 36 h to clearly monitor the changes in operational parameters. However, the period of short-term test was kept the same as 3 h.
connected in parallel. Over 36 hours of operation time, permeate flux decreased by approximately 4% whereas salt rejection showed an insignificant increase (see Figure 8). Permeate flux was 14 L/m2h and because
of doubled membrane area, this value was half of the one value which was obtained by single membrane as illustrated in Figure 2. It is vital to note that feed streams for single and two-membrane configurations have similar salinities and temperatures, thus such a comparison of flux values or salt rejections is reliable.
Salt rejection of the two-membrane configuration was 2.5% lower compared to the one with single membrane operation. Operation with two membranes provided lower permeate flux with a low quality permeate, i.e., permeate having higher conductivity (see Figure 8).
As a consequence, the operation with two membranes does not provide satisfactory outcomes in terms of both the permeate flux and the salt rejection. However, the performance decline in the permeate flux is less pronounced with the two-membrane operation, even with prolonged operation time up to 36 h. In addition, changes in the salt rejection are minimum with two membranes.
0 2 4 6 8 10 12 14 16 18 20 22 24 26 28 30 32 34 36 13.0
13.5 14.0 14.5 15.0
Permeate Volume (L)
Permeate Flux (L/m2h)
Perm
eat
e
F
lux
(L/
m
2 h)
Operation Time (h) 96.5
97.0 97.5
98.0 0 500 1000 1500 2000 2500
Salt Rejection (%)
Salt
R
ejec
tion
(%)
Fig. 8. Variation in permeate flux and salt rejection of membranes for long-term operation in two-membrane membrane configuration.
20 40 60 80 100 120 140 160 180
14.0 14.4 14.8
Permeate Volume (L)
Permeate Flux (L/m2h)
Perm
eat
e
F
lux
(L/
m
2 h)
Operation Time (min)
95.2 96.0 96.8 97.6
0 50 100 150 200 250
Salt Rejection (%)
Salt
R
ejec
tion
(%)
Fig. 9. Variation in permeate flux and salt rejection of membranes for short-term operation in two-membrane configuration.
Figure 9 shows the short-term variation in the permeate flux and the salt rejection using two membranes. Permeate flux exhibits a trivial decline whereas the salt rejection stayed constant over 3-hours operation time. Due to the increased membrane area, the final permeate flux produced from two membranes was again lower (14 L/m2h) when compared to the final value (19
L/m2h) obtained with the single membrane configuration for the short tests.
Salt rejection value was also lower than the one obtained at the end of 3-hour experiment with single membrane. Therefore, it can be concluded that the parallel operation of RO membranes does not provide an advantage in terms of the permeate quality and flux. Thus, pressures higher than 55 bar could be applied to reach the level of the permeate quality of single-membrane operations.
Figure 10 shows the permeate boron concentration and its rejection of 36-hour operation with two membranes. Boron rejection was 70% at the beginning, and at the end of experiment increased up to 76%. This rise is due to decreasing permeate volume per hour through the end of test. For the 24 h test with single membrane, variation in the boron rejection was not significant. Boron concentration of the permeate started to decrease also from 1.55 to 1.23 mg/L for the two-membrane test whereas this change was negligible for the single membrane operation. Unlike salt rejections with the two-membrane operation, boron rejection increased significantly over time using two membranes. However, the levels of boron rejections were still lower when compared to single membrane tests. Consequently, operating single membranes is advantageous when the performance of the boron rejection is considered.
0 2 4 6 8 10 12 14 16 18 20 22 24 26 28 30 32 34 36 65
70 75 80 85
Permeate Volume (L)
Boron Rejection (%)
Boron R
ejec
tion
(%)
Operation Time (h)
1.2 1.6
2.0 0 500 1000 1500 2000 2500
Permeate Boron Concentration (mg/L)
Perm
eat
e
Boron
C
onc
ent
rat
ion
(m
g/
L)
Fig. 10. Variation in boron rejection and permeate boron concentration for long-term operation in two-membrane membrane configuration.
20 40 60 80 100 120 140 160 180
70 72 74 76 78
Boron Rejection (%)
Perm
eat
e
Boron
C
onc
ent
rat
ion
(m
g/
L)
Permeate Volume (L)
Operation Time (min)
1.1 1.2 1.3 1.4
1.50 50 100 150 200 250
Permeate Boron Concentration (mg/L)
Boron R
ejec
tion
(%)
Fig. 11. Variation in boron rejection and permeate boron concentration for short-term operation in two-membrane membrane configuration.
As shown in Figure 11 for the short-term test, the boron removal was about 75% and the permeate boron concentration was 1.23 mg/L. Boron removal performance of SWRO membranes was not affected in time and slightly fluctuated for short-term tests in the two-membrane configuration.
criteria. The World Health Organization recommended the maximum boron concentration in drinking water to be 0.3 mg/L. Similarly, it is well proven that even at low concentrations such as 0.5 mg/L, irrigation water has detrimental effects on most plants [17,23,24]. In this work, the lowest boron concentration achieved in the permeate is 0.6 mg/L for the single membrane operation, which is close to the acceptable level for irrigation water but not for drinking purposes. Moreover, before recommending the produced water for drinking and irrigation purposes, a number of other analytical parameters should be carefully examined. A more detailed analysis based on reuse options of our system can be found in our previous work [18].
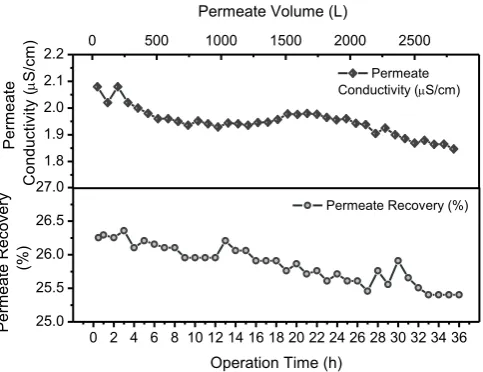
Permeate quantity of SWRO membranes was also checked for the two-membrane configuration. About 26% of feed water was taken as product water, i.e., the permeate, for the long-term test (see Figure 12). Permeate recovery declined at the end of 36 h experiment because of the possible effects of membrane compaction as was also the case for the single membrane operation. However, to fully understand the reason of this performance decline, a more accurate membrane autopsy maybe implemented investigating the change in membrane structure and its species composition both in the surface and the bulk side of the membrane. Electrical conductivity of the permeate was 1.9 mS/cm. Permeate recovery of the short-term test was about 27% and electrical conductivity of the permeate was about 1.83 mS/cm (see
Figure 13).
As mentioned earlier, a noticeable permeate flux decline can be observed for the long-term test in Figure 8. Permeate flux decline was also obvious for the single membrane operation. This resulted in decreasing trend of the permeate recovery. On the other hand, the permeate conductivity exhibited a decrease, providing a higher quality product water over time. This was because of the increase in both salt and boron rejections. It is also noteworthy that permeate recovery rates of two-membrane operations were slightly higher (26%) (see Figure 12) than the single membrane operations (20%) (see Figure 6) for the long-term operations. With the two-membrane operation, the quantity of the permeate produced is larger because of increased membrane area. For short-term operations with two membranes, the change in both the permeate recovery and conductivity was not substantial showing a similar behavior as corresponding single-membrane operation.
It is important to mention here that making an unbiased benchmarking between other membranes in the literature in terms of flux, salt and boron rejections is crucial. However, it is usually tedious to find common operating conditions among other systems. Therefore, manufacturers’ simulation software may sometimes be useful to project these data.
0 2 4 6 8 10 12 14 16 18 20 22 24 26 28 30 32 34 36 25.0
25.5 26.0 26.5 27.0
Permeate Volume (L)
Permeate Recovery (%)
Perm
eat
e
R
ec
ov
ery
(%)
Operation Time (h) 1.8
1.9 2.0 2.1
2.2 0 500 1000 1500 2000 2500
Permeate Conductivity (S/cm)
Perm
eat
e
C
onduct
iv
ity
(
S/
cm
)
Fig. 12. Variation in permeate recovery and conductivity for long-term operation in two-membrane membrane configuration.
4. Conclusions
Operation of the small pilot-scale SWRO system in Urla Bay-Izmir, Turkey for long-term applications exhibited typical declines in the permeate flux but not a considerable decline in the salt rejection. An evaluation was made between the single-membrane operation and the two-membrane operation. For single-membrane operation, the permeate flux dropped by 3% while the salt and boron rejections did not change significantly. For two-membrane operation, permeate flux showed the same trend of decreasing by a
factor of 4% and salt rejection stayed nearly constant. Surprisingly boron rejection has increased slightly when two membranes were used in the system. Based on the collected operational data, variations in flux, salt and boron rejections could be observed more conveniently for long-term applications under constant applied pressure, 55 bar. Furthermore, long-term reliability of the pilot SWRO system for continuous operation using natural seawater has been established. Considering the scarce literature based on pilot-plant tests using natural seawater, this work is believed to provide adequate knowledge on the time-dependent behavior of boron removing RO systems prior the scaling up of such pilot plants.
20 40 60 80 100 120 140 160 180
26.0 26.5 27.0 27.5 28.0
Permeate Recovery (%)
Perm
eat
e
R
ec
ov
ery
(%)
Permeate Volume (L)
Operation Time (min) 1.75
1.80 1.85 1.90
1.950 50 100 150 200 250
Permeate Conductivity (S/cm)
Perm
eat
e
C
onduct
iv
ity
(m
S/
cm
)
Fig. 13. Variation in permeate recovery and conductivity for short-term operation in two-membrane membrane configuration.
5. Acknowledgments
This study was supported by Middle East Desalination Research Center (MEDRC) (Project No: MEDRC-04-AS-004) and Ege University Scientific Research Projects (Projects No: EU-2007-MÜH-015 & EU-2008-MUH-029). We thank Ege University, Faculty of Fisheries for the kind support to perform our tests in Urla.
References
[1] P.H. Gleick, Water in crisis: a guide to the world’s fresh water resources, Oxford University Press, New York, 1993, pp. 13-24.
[2] A. Abbas, N. Al-Bastaki, Performance decline in brackish water Film Tec spiral wound RO membranes, Desalination 136 (2001) 281–286.
[3] C. Fritzmann, J. Löwenberg, T. Wintgens, T. Melin, State-of-the-art of reverse osmosis desalination, Desalination 216 (2007) 1–76.
[4] N. Kabay, S. Sarp, M. Yuksel, M. Kitis, H. Koseoǧlu, Ö. Arar, M. Bryjak, R. Semiat, Removal of boron from SWRO permeate by boron selective ion exchange resins containing N-methyl glucamine groups, Desalination 223 (2008) 49–56.
[5] J.A.G.C.R. Pais, L.M.G.A. Ferreira, Performance study of an industrial RO plant for seawater desalination, Desalination 208 (2007) 269–276.
[6] M. Busch, W.E. Mickols, Reducing energy consumption in seawater desalination, Desalination 165 (2004) 299–312.
[7] S. Adham, J. Oppenheimer, M. Kumar, Innovative Approaches to RO Concentrate Management: Beneficial Reuse and Concentrate Minimization, Proc. Water Environ. Fed. 8 (2006) 4334–4344.
[8] P. Chelme-Ayala, D.W. Smith, M.G. El-Din, Membrane concentrate management options: a comprehensive critical review, Can. J. Civ. Eng. 36 (2009) 1107–1119.
[9] P. Xu, T.Y. Cath, A.P. Robertson, M. Reinhard, J.O. Leckie, J.E. Drewes, Critical Review of Desalination Concentrate Management, Treatment and Beneficial Use, Environ. Eng. Sci. 30 (2013) 502–514.
[11] J. Redondo, M. Busch, J.P. De Witte, Boron removal from seawater using FILMTECTM high rejection SWRO membranes, Desalination 156 (2003) 229–238.
[12] N. Kabay, E. Güler, M. Bryjak, Boron in seawater and methods for its separation - A review, Desalination 261 (2010) 212-217.
[13] P. Glueckstern, M. Priel, Optimization of boron removal in old and new SWRO systems, Desalination 156 (2003) 219–228.
[14] H. Koseoglu, N. Kabay, M. Yüksel, M. Kitis, The removal of boron from model solutions and seawater using reverse osmosis membranes, Desalination 223 (2008) 126–133.
[15] H. Koseoglu, N. Kabay, M. Yüksel, S. Sarp, Ö. Arar, M. Kitis, Boron removal from seawater using high rejection SWRO membranes - impact of pH, feed concentration, pressure, and cross-flow velocity, Desalination 227 (2008) 253–263.
[16] E. Güler, C. Kaya, N. Kabay, M. Arda, Boron removal from seawater: State-of-the-art review, Desalination 356 (2015) 85–93.
[17] E. Guler, J. Piekacz, D. Ozakdag, W. Kujawski, M. Arda, M. Yuksel, N. Kabay, Influence of the chosen process parameters on the efficiency of seawater desalination: SWRO pilot plant results at Urla Bay seashore, Desalin. Water Treat. 5 (2009) 167-171.
[18] E. Guler, D. Ozakdag, M. Arda, M. Yuksel, N. Kabay, Effect of temperature on seawater desalination-water quality analyses for desalinated seawater for its use as drinking and irrigation water, Environ. Geochem. Health. 32 (2010) 335–339.
[19] www.dow.com, Product Data Sheet Dow FilmTec SW30-2540.
[20] K.P. Lee, T.C. Arnot, D. Mattia, A review of reverse osmosis membrane materials for desalination-Development to date and future potential, J. Membr. Sci. 370 (2011) 1–22.
[21] A. Farhat, F. Ahmad, N. Hilal, H.A. Arafat, Boron removal in new generation reverse osmosis (RO) membranes using two-pass RO without pH adjustment, Desalination 310 (2013) 50–59.
[22] A. Volkov, Membrane Compaction, in: Encycl. Membr., Springer Berlin Heidelberg, Berlin, Heidelberg, 2014, pp. 1–2.
[23] N. Nadav, M. Priel, P. Glueckstern, Boron removal from the permeate of a large SWRO plant in Eilat, Desalination 185 (2005) 121–129.