OF PSYCHOLOGICAL STUDIES HYPERION UNIVERSITY
www.hyperion.ro
29
SPEARMAN CORRELATIONS BETWEEN MODEL / STYLE
OF LEARNING SENSORY (PERCEPTUAL) AND MODEL /
STYLE OF LEARNING RATIONAL
(INFORMATION PROCESSING)
MIHAI COVACI†a
a Hyperion University, Faculty of Psychology and Educational Sciences Department of Psychology
Summary
Human learning and developed based on them, have passed by several stages and varied approaches. Currently were created opportunities for information storage, synchronously or asynchronously transmission to any distance, and even teaching various interactions and participation in discussions avoiding physical presence in the same location. This framework requires some questions: learning styles have any influence on learning results? What are the specific learning styles of students from the faculty of psychology? How much influence sensory factor learning styles and internal processing based on performance information or teaching outcomes learning styles? There are correlations between sensory learning style and rational learning style? Current approach is trying to elucidate the possible answers to questions released by applying two questionnaires: VARK learning styles and Honey-Mumford learning styles. After results validation, it was verified potential association between variables by applying the coefficient of rank correlation (Spearman). So they could verify the assumptions made in research and also offered some indirect suggestions for a more efficient learning.
Keywords: learning style, perceptual, information processing, correlations.
1. LITERATURE REVIEW
The perspectives on education are continuously modifying and changing, beyond the classroom walls, to an augmented environment where processes like access to information, others opinions about the same subject etc. are facilitated. This expansion implicates the teachers and the student in different ways in relation with the classic forms of education. In the virtual area students can utilize their natural inclinations (converted into styles) more effectively in order to streamline the learning process. Also here they can analyses information unaffected by the present aspects of a traditional classroom, they can improve their collaborative personality
30
traits and through these aspects can indirectly challenge teachers to adapt the classic methods to the new reality.
As criteria for learning performance evaluation, the personalized learning style represents one of the essential factors in the learning process (Mogonea, 2010). “If there is not difference between the learning styles, the university/college can transfer the same types of teaching/learning activities used in the traditional environment to distance learning having a similar success” (Diaz & Cartnal, 1999). The personalized learning style represents a personal characteristic that dictates the adopted cognitive strategies and produces the elaboration of an approach model on learning tasks and to future mnemonic adjustment. The registries of the observed situations among students were ample. The first category of students, and the most numerous one, prefers graphic illustrations (Silveira, 2015; Simonds & Brock, 2014) either when they receive specific explanations, or when they explain specific concepts or abstractions and implicitly remember in a better way everything they see. Other students prefer the audio materials and understand the information better when they hear it, others prefer kinesthetic reception and can very well remember operations that they executed at one point or operations that they practiced and applied (Căpiță, 2011).
In 2004 the research center for learning and skills develop a research during which there were synthesized 71 learning styles models, 13 of them are better known (Coffield, Moseley, Hall & Ecclestone, 2004). In these models, the cognitive style and learning strategies can change depending on different factors and depending on the context in which the learning process takes place, but “the biggest differences found in the individual plan are determined by psychomotor particularities” (Neacșu, 2015). The learning style of an individual will affect the way the information is processed and thought of within the learning process and these will have a considerable effect on the learning efficiency and effectiveness (Bencheva, 2010).
31
Formulations like “learning style”, “cognitive style” and “information processing style” are used by different researchers as having the same meaning and in some cases they are used in a unconsciously and vague way (Brown, Cristea, Cristea & Brailsford, 2005). Acknowledging the fact that the learning styles “work” in any given context (Brown, Cristea, Cristea & Brailsford, 2005), the teaching material approach will be identical or similar regardless if this is represented in a classic learning form or and online form. “The learning styles also called cognitive styles, are those cognitive, affective and generally psychological characteristics that indicate the way in which the persons that are learning perceive, interact and respond to the learning environment. They represent the total cognitive characteristics that have a decisive role in the learning process” (Élthes, 2013).
2. OJECTIVES AND ASSUMTPIONS
2.1. OBJECTIVES
The objectives of the research and the activities were:
- establishing the preponderance of learning styles in students from the psychology university;
- (implicit) establishing the dominant styles;
- making the Spearman correlations between the VARK learning model focused on sensory (perceptual) and the Honey-Mumford style focused on rational (information processing).
2.2. ASSUMPTIONS In this research 2 hypotheses were proposed:
Hypothesis 1: There are no dominant learning styles at any sensory or perceptual level regarding the students from the psychology university;
Hypothesis 2: The correlations between the 2 learning models/styles are non-existent or very weak.
3. THE METHOD
3.1. PARTICIPANTS
The participants of this questioning were 101 students from the Psychology Faculty from Hyperion University.
3.2. TOOLS
The instruments used in this research were the VARK (VACK) questionnaire and the Honey – Mumford questionnaire.
32
The authors identify 4 learning styles based on the following sensory preferences: visual, aural, read-write and kinesthetic (Fleming & Mills, 1992; Fleming, 2012). A 5th multimodal mod is based on combining at least 2 preferences. The multimodal style characterizes 50-70% of the population (Bernat, 2003). The questionnaire consists in 16 questions with 4 possible answers for each question (Bernat, 2003). Each answer corresponds with one of the 4 mentioned styles. Subsequently the score is calculated and the style that has the highest score is the preferred way of learning. Peter Honey and Alan Mumford (1982) have developed four custom styles to assimilate the information, based on the idea that each person analyses, processes and represents information in different ways. When the assimilation of information coincides with the custom style/s then the critical informational analysis and the reflection on itself increases in quality. The Honey-Mumford questionnaire (Honey & Mumford, 1982) contains 80 items with one possible answer, which are distributed on the 4 learning styles (Activist, Reflector, Theorist and Pragmatist), each style having 20 items or 20 points (Coffield, Moseley, Hall & Ecclestone, 2004). At the end all the points are summed (or all the checked items) and the predominant style is deducted depending on the scores obtained on the 5 scales (see table 1).
Table 1 – Honey-Mumford model scales
Activist Reflector Theorist Pragmatist Scale
13-20 18-20 16-20 17-20 Very strong preferences 11-12 15-17 14-15 15-16 Strong preferences
7-10 12-14 11-13 12-14 Moderate preferences
4-6 9-11 8-10 9-11 Low preference
0-3 0-8 0-7 0-8 Very low preference
3.3. EXPERIMENTAL DESIGN
The research design was cvasi-experimental, transverse and consisted of the application of a quantitative method to the mono-group. Afterwards the data obtained were processed in SPSS v.22.
4. RESULTS
33
Figure 1 – Averages distributions of VARK questionnaire
The distribution relative to the learning strategies takes into the account the fact that the difference between the first 2 scores is less than or equal to 2 (Bernat, 2003). The strategies related to this aspect suggest the fact that 31 (30.69%) students are unimodal and the remaining 70 (69.31%) students are multimodal. A more accurate reporting shows that of the 85 multimodal students, 26 (25.74%) are bimodal, 22 (21.78%) are trimodal and 22 (21.75%) are cvadrimodal. These results come close to the ones carried out in other universities (Prithishkumar & Michael, 2014; Moayyeri, 2015) where the predominance of students using multimodal strategies amounted to 87% (see figure 2).
34
The SPSP simulations showed that the maximum variation interval for the 4 variables is between 0 and 14 units of score.
In the testes applied to the investigate students, the first style, auditory style, varies between 2 and 12 units of score with and average level of 6.08 units of score with a standard deviation of 2.52 units of score. The distribution is significantly different from the normal distribution (significance level of the Kolmogorov-Smirnov test = 0.000<0.05). The Quartile variation is almost symmetrical, the average score is 6 units of score. According to the quartile values 50% of the central subjects have values between 4 and 8 units of score.
The kinesthetic style ranges between 1 and 12 units of score with an average score of 5.22 units of score and a standard deviation of 2.27 units of score. The distribution is significantly different from the normal distribution (significance level of the Kolmogorov – Smirnov test = 0.000<0.05). The Quartile variation is almost symmetrical, the average score is 5 units of score. According to the quartile values 50% of the central subjects have a score of 4 to 6 units of score.
The read – write style varies between 0 and 12 units of score with an average score of 5.69 units of score and a standard deviation score of 2.63 units of score. The distribution is significantly different from the normal distribution (significance level of the Kolmogorov – Smirnov test = 0.007<0.05). The Quartile variation is almost symmetrical, the average score is 6 units of score. According to the quartile values 50% of the central subjects have a score of 4 to 7 units of score.
The visual style varies between 0 and 14 units of score with an average score of 4.86 units of score and a standard deviation score of 2.26 units of score. The distribution is significantly different from the normal distribution (significance level of the Kolmogorov – Smirnov test = 0.001<0.05). The Quartile variation is almost symmetrical, the average score is 4 units of score. According to the quartile values 50% of the central subjects have a score of 2 to 5 units of score (see tables 2 and 3).
Table 2 - VARK:Tests of Normality
Kolmogorov-Smirnova Shapiro-Wilk
Statistic df Sig. Statistic df Sig.
Aural .126 101 .000 .952 101 .001
Kinesthetic .154 101 .000 .931 101 .000
Read-Write .106 101 .007 .975 101 .052
Visual .119 101 .001 .935 101 .000
Table 3 - VARK: Statistics
Aural Kinesthetic Read-Write Visual
N Valid 101 101 101 101
Missing 0 0 0 0
Percentiles 25 4.00 4.00 4.00 2.50
50 6.00 5.00 6.00 4.00
35
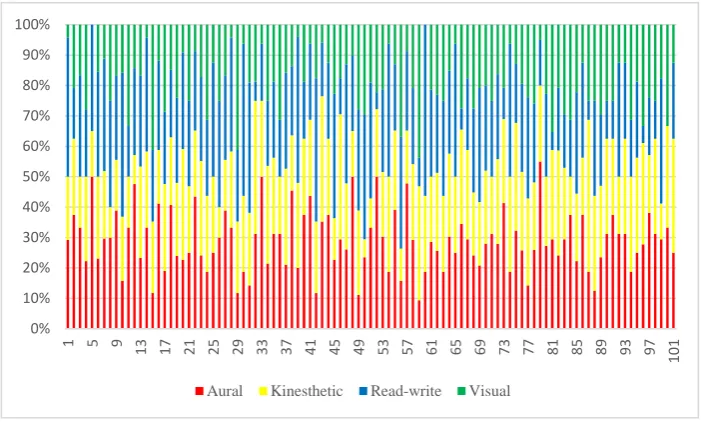
In the case of the styles from the distribution diagram, there is no style that stands out as being dominant except the fact that in some of the students a style is missing (see figure 3).
Figure 3 – Representing individual learning styles – VARK
Peter Honey and Alan Mumford have made some adjustments to Kolb’s experiential model, adjustments made in 2 parts: the first part was renamed learning cycles proposing something similar and based on experience, towards its analysis, to extracting of conclusions from the experience and planning the next steps. To the four steps of the first part they’ve assigned 4 learning styles: Activist, Reflector, Theorist and Pragmatist (Mumford, 1997). The 4 styles are rather adaptations to different circumstances and a tool for self-development than personality characteristics and are designed to strengthen styles in order to learn a wide range of daily experiences. According to the simulation based on the average score of all students, we have a predominantly reflective style with an average value of 10.68 followed by the theorist style (8.76), pragmatist (8.72) and activist style (8.69) (see figure 4).
In the scale distribution, students with the active style have the best scale representation “strong preference” (15 students) contrasting with the pragmatics that on the same scale have not registered presence. Also a consistent presence is observed of the number of students in the “low preference” and “very low preference” scale of the pragmatists (84 students theorists (71 students) and reflexives (56 students).
0% 10% 20% 30% 40% 50% 60% 70% 80% 90% 100%
1 5 9 13 17 21 25 29 33 37 41 45 49 53 57 61 65 69 73 77 81 85 89 93 97
101
36
Figure 4 – Averages distributions of Honey-Mumford questionnaire
In the simulations, only the reflective style has three positive correlations (linear relationship between the values) of a small intensity with the auditory style (ro=0,215, p=0,030, N=101); the kinesthetic style (ro=0,320, p=0,001, N=101) and with the read – write style (ro=0,195, p=0,050, N=101) (see table 4).
Table 4 – Spearman correlations
Active
Reflexiv es
Theorist s
Pragmatis ts
Spearman's rho Aural .084 .215 .082 .126
.406 .030 .417 .211
101 101 101 101
Kinesthetic .007 .320 .076 .180
.947 .001 .451 .071
101 101 101 101
Read-Write .036 .195 .174 .146
.724 .050 .081 .145
101 101 101 101
Visual -.105 .061 .034 .105
.297 .545 .738 .297
101 101 101 101
Multimodal strategies -.129 .021 .034 -.026 .197 .837 .733 .793
37
5. CONCLUSIONS
Within the research, hypothesis no. 1 was confirmed; thus, we cannot speak of certain dominant learning styles at any level sensory and perceptive than any slight inclination for a particular style from the one given model. Confirmation of the hypothesis no. 2 revealed that there are only three positive correlations between variables checked mild.
Additionally, the survey VARK revealed that Aural style has the highest percentage of average (6.08) opposite with the Visual style by an average of 4.06. Honey-Mumford questionnaire revealed that the Reflective, Theorist and Pragmatic style showed very low presence for Moderate preference, Strong preference and Very strong preference styles while Active style registered balanced presence in those scales.
Consequently, students often have a mix of learning styles. However, when understand their preferred learning style (s) they can choose types of learning that helps more. In addition, they are more aware of their opportunities to be active in the learning process. By offering multi-sensorial experiences, tutors can help students better remember concepts learned and thereby improve their learning (Konttinen & Moilanen, 2015).
REFERENCES
Bencheva, N. (2010). Learning Styles and E-Learning Face-to-Face to the
Traditional Learning., 3.2, p. 5. Retrieved 02 16, 2016, from
http://conf.uni-ruse.bg/bg/docs/cp10/3.2/3.2-11.pdf
Bernat, S. (2003). Tehnica învăţării eficiente. Cluj-Napoca: Presa Universitară Clujeană.
Brown, E., Cristea, A., Cristea, C. & Brailsford, T. (2005). Patterns in authoring of adaptive educational hypermedia: A taxonomy of learning styles. Educational Technology & Society, 8(3), 77-90.
Căpiță, C. (2011). Stiluri de predare – stiluri de învățare. București: Millenium Design Group.
Coffield, F., Moseley, D., Hall, E. & Ecclestone, K. (2004). Should we be using learning styles? What research has to say to practice. London: Learning and Skills Research Centre.
Diaz, D. P. & Cartnal, R. B. (1999). Students' Learning Styles in Two Classes Online Distance Learning and Equivalent On-Campus. College Teaching, 47(4), pg. 130-135.
Dunn, R. (1989). Survey of Research on Learning Styles. Educational Leadership, 46(6), 50-58.
Dunn, R., Debello, T., Brennan, P., Krimsky, J. & Murrain, P. (1981). Learning Style Researchers Define Differences Differently. Educational Leadership, 38, 372-375.
Élthes, Z. (2013). Condiţiile eficienţei e-learning în învăţământul superior.
International Conference on Virtual Learning (ICVL) 2013, pg. 76-80.
38
Fleming, N. (2012). Teaching and learning styles vark strategies. Neil D. Fleming; Charles Bonwell.
Fleming, N. & Mills, C. (1992). Not Another Inventory, Rather a Catalyst for Reflection. From To Improve the Academy, 11, 137-155.
Honey, P. & Mumford, A. (1982). Manual of Learning Styles. London: P Honey. http://vark-learn.com/ (n.d.). Chestionarul VACK. Cum învăţ cel mai bine? (learn.com/home-romanian/) Retrieved 05 22, 2012, from http://vark-learn.com/wp-content/uploads/2014/08/The-VARK-Questionnaire-Romanian.pdf
Konttinen, A., & Moilanen, N. (2015). Experiential Learning with Multisensory and Digital Elements. Interdisciplinary Studies Journal, 4(1), 28-40.
Moayyeri, H. (2015). The Impact of Undergraduate Students’ Learning Preferences (VARK Model) on Their Language Achievement. Journal of Language Teaching and Research, 6(1), 132-139.
Mogonea, F. R. (2010). Pedagogie pentru viitorii profesori. Craiova: Editura Universitaria.
Mumford, A. (1997). Putting learning styles to work. În Action learning at work (pg. 121–135). London: Gower Pub Co.
Neacșu, I. (2015). Metode si tehnici de invatare eficienta. Fundamente si practici de succes. Iași: Polirom.
Pasaniuc, J. (2014). Metode creative folosite în activităţile de tineret: suport de curs. Revistă de biblioteconomie, ştiinţe ale informării şi de cultură, editată de Biblioteca Municipală "B.P. Hasdeu" din Chişinău, 55(5), 22-73.
Prithishkumar, I., & Michael, S. (2014). Understanding your student: Using the VARK model. Journal of Postgraduate Medicine, 60(2), 183-186.
Sadler-Smith, E. (1996). Learning styles: a holistic approach. Human Resources Studies Group, 20(7), 29-36.
Scutelnic, O. (2010). Instrumente de măsurare a diferenţelor individuale pentru organizarea învăţământului diferenţiat. Studia Universitatis, 9(39), 82-86.
Silveira, R. M. (2015). Is a video used as a didactic content effective in the learning process? 122nd ASEE Annual Conference & Exposition. Washington: American Society for Engineering Education.