©2015 JNAS Journal-2014-4-3/371-377 ISSN 2322-5149 ©2015 JNAS
Financial Crises and Marketing Expenditure
Effect: Dynamic Panel Data Approach
Mohamad Makizadeh
1and Yahya Abtahi
2*1- Commercial Management Department, Science and Research Branch of Islamic Azad University, Yazd, Iran 2- Department of Economic System Planning, Islamic Azad University, Yazd, Iran
Corresponding author
:
Yahya AbtahiABSTRACT: Attentions to the acceleration of globalization and the global economic crisis that all countries will be affected directly and indirectly, through the crisis is important for the companies and one way out of the crisis, manages the marketing costs.One of risk and management dimensions is financial crisis in small and large companies. Management of marketing expenditure is very significant in this case. This study examines impact of marketing costs upon performance of 25 companies in Iran in period of economic stability, during financial crisis, and after financial crisis from 2002 to 2012. The result of this study using dynamic panel data model showed softened impact of marketing expenditure upon net sales in financial crisis period as compared with period of economic stability.
Keywords: Marketing expenditure, Financial crisis, Net sale. INTRODUCTION
One of globalization's unsatisfactory outcome is financial crisis which is usually precipitated worldwide by industrial countries and hit economy of countries and free-market-based corporates (Kokemuller,2013). One of these crisis arose worldwide in 2008. With the advent of crises in USA housing market and subsequently financial crisis in world, a large number of detailed studies attempted to discover causes of this crisis. Irrespective of causes, this crisis are permeated through the whole world by foreign trade and financial market of USA. Due to their interaction and relationship with global market, economics are affected differently by this crisis i.e. in countries with internationally financial interaction, this crisis is precipitated directly and countries without any such interaction are affected indirectly due to their foreign trade.
In the case that governments pursue tight fiscal policies, activities and revenues of corporates are affected by financial crisis (Furceri& Zdzienicka, 2012). Foreign and domestic competitive markets have deeper significance in cases of economic and political changes including increased inflation rate, decreased economic growth, increased interest rate, changed demands of consumers, changed market structures, and shocks given by changes in exchange rate. In these unavoidable changes, corporates are required to implement flexible strategies and practical plans (Candemir & Zalluhoglu, 2011).
Review of Literature:
372
experiences serious difficulties. International financial crisis and expectations of global growth caused prices to go from $150 per barrel in the first months of 2007 to approximately $65 per barrel in 2008. Consequently, OPEC countries experienced great difficulties with exportation and investment in 2009 and 2010.During international financial crisis, demands on domestic and foreign markets fall. Indeed, corporates' sale and profitability level goes down. As a result, in the first months of the financial crisis, Iran's exchange market reached one of highest-ranked stock exchange in world, unlike industrial countries. But, after 6 months, Tehran's stock exchange indices dropped sharply to the extent that they went from relatively 14000 units in April of 2008 to 8500 units in autumn of 2008. Consequently, investment rate slowed down slump in capital market.
Iran's macroeconomic indices became volatile from the beginning of global financial crisis. These volatilities are as follows:
Economic growth rate extremely became volatile from 2007 to 2008. Even, it reached -5.4 in 2012.
Inflationary pressures, inflationary expectations of citizens, and increased inflations rate caused by oil shocks in OPEC countries showed potential for increase in prices. Prices of domestically-manufactured goods and services increased at a rate of %9.1 in 2011. This rate increased by %30 in 2012.
Dollar-Rial currency price rose from 2010 i.e. price of one dollar went to 19000 Rials in 2011 and increased by 32000 Rials in 2012.
In financial and economic crisis, companies should undergo necessary changes by formulating new strategies in order to have accountability to their shareholders. More specifically, they are required to improve marketing techniques, reduce general costs, and to increase productivity. Also, they should increase budgets of marketing. As studies show, companies with higher level of marketing activities during and after inflation can increase their sales, revenues, and market shares (Candemir & Zalluhoglu, 2011). Marketing aims are higher market shares, sales, and profitability. Therefore, this activity should not be curbed during economic inflation and financial crisis because shareholders do not expect to experience such curb. In the case that tight fiscal policies of firms include reduction in marketing costs, they cannot acquire market share.
MATERIALS AND METHODS
In this paper by static and dynamic the effects of marketing expenditure on comparing performance during financial crises has examined. In accordance with theoretical principles and studies of Joshi and Hanssens (1995 & 2009), Bagwell (2005), Candemir and Zalluhoglu (2011), and Crespo and Storckl (2011), this study takes Equation 1 into consideration for the purpose of evaluating impact of marketing costs upon sales of companies.
Ns it= α 1 + β1 Meit +β2Growthit + β3Infit+ β4Usdit+εit (1)
i=1,….,N t=1,….,T
in the above specification Ns, INF, Growth, and Usd are respectively net sales of companies which are subject to marketing costs (Me), Inflation rate, economic growth rate, and currency rate.
In the case that the following dynamic panel is used, dynamics of model is created by inserting intervals of dependent variables as independent variables into the right part of the model. Accordingly, results become more accurate (Baltagi, 2008).
𝑦𝑖𝑡 = ∑ 𝛼𝑗 𝑝
𝑗=1
𝑦𝑖,𝑡−𝑗+ β(𝑙)𝑥𝑖,𝑡+ 𝜂𝑖+ 𝜗𝑖,𝑡 (2)
Dependent variable interval in the right side of panel disproves non-correlation between independent variables and error terms as one of traditional assumptions. Accordingly, method of ordinary least square (OLS) (in panel model of fixed effects and random effects) produces biased results and inconsistency (Arellano & Bond, 1991; Baltagi, 2008), which are as follows in this study:
In equation (1), 𝜂𝑖 is particular unobservable effects in any company with time constant, mean of𝐸(𝜂𝑖 ) = 𝜂𝑖, and
variance of 𝑉𝑎𝑟(𝜂𝑖) = 𝜎𝜂2. 𝜗𝑖,𝑡 is assumed to distribute independently among countries with mean of Zero. 𝑌𝑖,𝑡 and xit
are respectively GDP per capita growth and vector of explanatory variables. Additionally, 𝜂𝑖 complies with a random
373
𝐸(𝑌𝑖,𝑡−1 𝜂𝑖) ≠ 0
𝐸(𝑥𝑖,𝑡 𝜂𝑖) ≠ 0
β(L) is a polynomial interval for avoiding biased and inconsistent results in OLS method. By calculating the first-order difference, we can rewrite equation (1) as follows:
∆𝑦𝑖𝑡 = ∑ 𝛼𝑗∗ 𝑝−1
𝑗=1
∆𝑦𝑖,𝑡−𝑗+ β∗(𝑙)∆𝑥𝑖,𝑡+ ∆𝜗𝑖,𝑡 (3)
∆ is first-order difference. Equation 2 faces difficulties by employing OLS method because of correlation between individual effects and explanatory variables. Additionally, correlation between dependent variable interval and error term 𝐸(∆y𝑖,𝑡−1∆𝜗𝑖,𝑡) ≠ 0 imposes linearity. All these parameters produce biased and inconsistent results in Equation
2 due to OLS method (Arellano & Bond; 1991). For removing linearity, dependent variable interval is used as instrumental variable in GMM method. Matrix of optimal instrumental variables (Z matrix) including preset repressors (x), which are correlated with individual effects, is written as follows:
zi=
(
yi1 xi1 xi2 0 0 0 0 ….. 0….. 0 0..… 0 0 0 0 yi1 yi2 xi1 xi2 ….. 0….. 0 0..… 0
. . . . . . . . . . . . . . . . . . . . . .
0 0 0 0 0 0 0 𝑦𝑖1 𝑦𝑖(𝑇−1) 𝑥𝑖1 𝑥𝑖(𝑇−1)
)
Rows indicate first-order differential equation for the person I in t=3,4,…..T and moment condition;
𝐸[𝑧𝑖′ ∆𝜗𝑖] = 0 𝑓𝑜𝑟 𝑖 = 1,2,3 … . . 𝑁
∆𝜗𝑖= (∆𝜗𝑖3, ∆𝜗𝑖4, … … , ∆𝜗𝑖𝑇 )′
In general, asymptotic and efficient GMM minimizes the following criterion on the basis of these conditions of moment;
𝐽𝑛= (
1
𝑁∑ ∆𝜗𝑖
′ 𝑁
𝑖=1
𝑍𝑖) 𝑊𝑁(
1
𝑁∑ 𝑍𝑖
′ 𝑁
𝑖=1
∆𝜗𝑖)
In order to accomplish this objective, the below weighted matrix is used;
𝑊𝑁= [
1
𝑁∑(𝑍𝑖
′ ∆𝜗
𝑖
̂ ∆𝜗̂ 𝑍𝑖′ 𝑖) 𝑁
𝑖=1
]
−1
∆𝜗𝑖 is consistent calculation of first-order differential residues which is gained from primarily consistent estimators,
and therefore is viewed as two-stage estimator. Given the variance, evenness of components in first-order differential model involves asymptotic estimator of GMM which is gained from the following matrix in a single stage:
𝑊1𝑁= [
1
𝑁∑ 𝑍𝑖
′ 𝐻𝑍
𝑖 𝑛
𝑖=1
]
374
H is a square matrix with two sides of main diagonal, one side of first non-diagonal surface, zero point, and other points. Note that W1N is not dependent on any calculated parameters. For use of one-stage or two-stage estimators, Bond (2002) points out that a large number of applied functions of GMM estimators are taken into greater consideration as compared with others.Accordingly, in the second stage, by using GMM estimators proposed by Arellano and Bond (1994) and the function suggested for impact of marketing costs, economic growth, inflation rate, and value of dollars upon net sales of corporations, we will have:
NSit = φ+ α ∑𝑛𝑖=1 NSit-1+𝛽1MEit +𝛽2Growth it +𝛽3INFit +𝛽4 USD +ℇit (4)
Ns it , Meit , Infit, Usdit , ،𝑁𝑆𝑖𝑡−1 , ℇ𝑖𝑡, 𝛼and 𝛽1, and φ are respectively volume of net sales, marketing costs,
economic inflation rate, price of US Dollars, volume of net sales in case of interval, randomly indefinite effects, regressional coefficient of variables, and constant coefficient.
RESULTS AND DISCUSSION
25 companies were selected in industries of plastics, food, and ceramics, which had at least 13-year experience in stock exchange. We gathered the required data from annual financial reports and data bases of Tehran's stock exchange.
Table 1 shows the results of static model , estimation for sample companies during 2002-2012. Since data are panel data, first, the type of model estimation must be indicated by Leamer f Test and Hausmen Test. Since p value from Leamer Test for three period, are 0.000, null hypothesis indicates model of pool data is rejected. The opposite hypothesis that indicates using panel data (probability less than 0.00) is accepted. Since p value from Hausman test for two period ( before crises and after crises ) are more than 0.05 null hypothesis that indicates using method of random effects is accepted and
Since p value from Hausmen Test for during total period (2002-20012) is 0.000, null hypothesis that indicates using method of random effects is rejected. The opposite hypothesis that indicates using fixed effects (probability less than 0.05) is accepted.
On the basis of results of F test, null hypothesis was significantly rejected. In other words, calculated coefficients were accepted.
Table 1. Results o f Leamer F- test and hausman- test After Crises
(2008-2012) Before Crises
(2002-2008) Test
55/74 (0.000) 1.38
(0.000) F
-6/53 (0.000) 1.38
(0.70) Chi2(x2)
Values in parenthesis are P-Value.
Companies participating in the study, 25 subjects Ceramic tile, rubber, plastic and food, which has at least 11 years on the stock exchange, were selected. Selected data from annual reports and financial company database Tehran Stock Exchange was received.
Table 2. Results of Static Model Calculation & Calculation of Variables' Impacts upon Net Sales of Companies in Tehran's Stock Exchange
Coefficients of Estimation before Financial Crisis (2002-2008) Coefficients of Estimation in Total Period (2002-2012)
375
(8.45) (8.83)
Growth 8.59 e + 9
1.33 e + 01 * -2.59 e + 10
Inf *** 1.16 e + 10
(5.49 e + 9)
2.71 e + 9 (7.17 e + 9)
Usd *** 2.31 e +9
(5.08 e + 8)
6.77 e + 7 (8.26 e + 7)
-cons *** -2.10 e + 12
(5.41 e + 11)
1.97 e + 11 (1.89 e + 11) Values in parenthesis are standard errors. *, **, and *** are levels of significance (%1, %5 & %10).
Results of Table 1, in accordance with static model, show that:
Economic growth, inflation rate, and exchange rate has no significant effects in net sales of in period after financial crisis in 2008; and The impact of some of these variables was not supported by economic theories. For instance, coefficients of economic growth before, during, and after financial crisis were negatively correlated with volume of net sales, which was not consistent with economic theories. Accordingly, results of static model were not considered valid. Instead, model of dynamic panel was used in order to determine effects of other variables including marketing costs upon net sales.
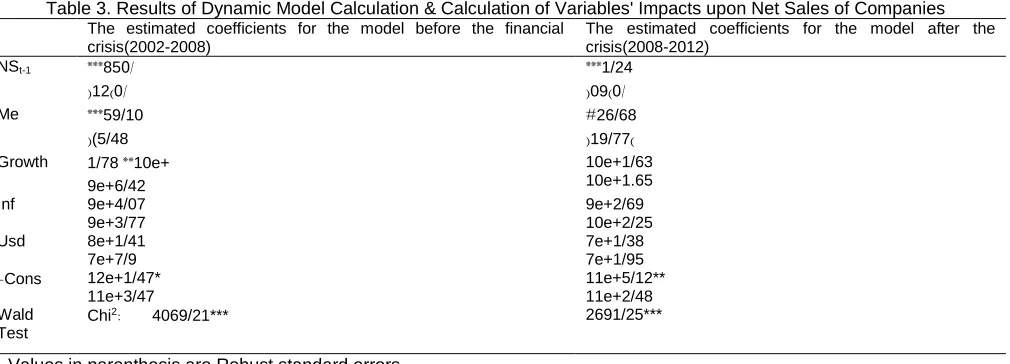
Table 3. Results of Dynamic Model Calculation & Calculation of Variables' Impacts upon Net Sales of Companies The estimated coefficients for the model after the crisis(2008-2012)
The estimated coefficients for the model before the financial
crisis(2002-2008)
***1/24
(09) 1/
***851/
(12) 1/ NSt-1
#26/68
(19/77)
***59/10
((5/48 Me
10e+1/63 10e+1.65 1/78 **10e+
9e+6/42 Growth 9e+2/69 10e+2/25 9e+4/07 9e+3/77 Inf 7e+1/38 7e+1/95 8e+1/41 7e+7/9 Usd 11e+5/12** 11e+2/48 12e+1/47* 11e+3/47 -Cons 2691/25*** Chi2: 4069/21***
Wald Test
Values in parenthesis are Robust standard errors.
*, **, and *** are levels of significance (%1, %5 & %10).
# is probability coefficient of marketing costs in period of financial crisis, which is 0.121 in value.
Sem provides two options to modify how the standard-error calculations are made: vce(robust)and vce(cluster clustvar). These standard errors are less efficient than the default standard errors, but they are valid under less restrictive assumptions.
These options are allowed only when default estimation method method(ml) is used, or option method(mlmv) is used. ml stands for maximum likelihood and mlmv stands for maximum likelihood with missing values;
vce(robust) specifies an alternative calculation for the VCE, called robust because the VCE calculated in this way is valid under relaxed assumptions. The method is formally known as the Huber/White/sandwich estimator. The VCE obtained in this way is valid if the errors are independently distributed. It is not required that the errors follow a normal distribution, nor is it required that they be identically distributed from one observation to the next. Thus the vce(robust) VCE is robust to heteroskedasticity of the errors.
vce(cluster clustvar) is a generalization of the vce(robust) calculation that relaxes the assumption of independence of the errors and replaces it with the assumption of independence between clusters. Thus the errors are allowed to be correlated within clusters.
Additionally, coefficients were estimated by using robust standard error which was indicated by mean standard errors. This calculation method is used to a lower extent as compared with general mean standard deviation; yet the latter are valid due to limited number of assumptions.
376
From 2002 to 2008, marketing costs had significantly positive impact upon volume of net sales of these companies. This finding was consistent with theoretical expectations. In accordance with calculated coefficients (Table 3), the following outcomes were produced: The calculated coefficient of marketing costs (59.10) showed that sale volume increased by 59 Rials per one-Rial marketing cost;
Economic growth was significantly and positively related with net sales. 1 percent of economic growth increased net sales by 17.8 Million Rials;
Within 7-year period before financial crisis, inflation did not create significant impact upon net sales;
Net sales increased by 13.8 million Rials per one-Rial increase in currency price.
Analysis of self-regression of error terms in this model indicated first order of self-regression between error terms. Therefore, measurements of these model were valid.
Findings on Outcomes after Financial Crisis Period:
Findings demonstrated significant impact of financial crisis on Iran's industrial sectors within (2009-2012) to the extent that impact of their marketing costs on net sales were lessened. However, it was still the most crucial variable in this study.
Moreover, the following findings were revealed:
The calculated coefficient of marketing costs (26.68) showed that sale volume increased by 26 Rials per one-Rial marketing cost even in period of financial crisis. This increase occurred to a lower extent as compared with the period before financial crisis;
Net sales were not significantly affected by economic growth as compared with the period before financial crisis in which they were significantly correlated with each other;
Inflation rate did not bring about significant effect upon net profits of the studied companies while the calculated coefficient for economic growth was 3.25 Million Rials before financial crisis. Perhaps, increase in inflation rate caused increase in net sales, which was in agreement with theoretical principles; and
Net sales were not significantly affected by increased currency price while the studied companies experienced an increase in net sales by 146 million Rials per one-Rial increase in currency price before financial crisis.
Findings on Outcomes within Total Financial Crisis Period:
Marketing costs, economic growth rate, and currency price were significantly and positively correlated with net sales of studied companies from 2002 to 2012. This finding was consistent with theoretical principles.
Also, coefficients of Table 2 showed the following:
Net sale volume increased by 41 Rials per one-Rial marketing cost (with a coefficient of 41.13);
Economic growth (30.5) was significantly and positively related with net sales. 1 percent of economic growth increased net sales to 17.8 Million Rials;
%1 increase in inflation rate caused an increase by 11.8 million dollars in net sales; and
Net sales increased by 18 million Rials per one-Rial increase in currency price.
CONCLUSION
Our findings highlighted very significant impact of marketing costs upon net sales of studied corporations as one of variables of market performance from 2002 to 2012. In period of economic stability, sale volume increased by 59 Rials per one-Rial marketing cost. Similarly, sale volume increased by 26 Rials per one-Rial marketing cost in period of financial crisis in which macroeconomic indices dropped. Also, an increase by 41 Rials in net sales occurred per one-Rial marketing cost. Accordingly, marketing cost is a satisfactory solution for resolving financial crisis. Tight fiscal policies should not involve marketing costs since industrial managers can achieve their profitability through domestic and international marketing. Membership of countries in World Trade Organization (WTO) are positively and negatively affected by its performance. Therefore, more detailed studies should concern impact of financial crisis upon members of WTO.
REFERENCES
377
Arellano M & Bond S. 1995. Another Look at Instrumental Variables Estimation of Error Components Models. Journal of Econometrics 68, pp. 29-51.
Bagwell K. 2005. Economic Analysis of Advertising. USA: Department of Economics in Columbia University. Baltagi BH. 2008. Econometric Analysis of Panel Data. USA: John Wiley and Sons.
Bond S. 2002. Dynamic panel models: a Guide to Micro Data Methods and Practice. Institute for Fiscal Studies in Department of Economics, UCL, CEMMAP. Retrieved in December 1, 2014 from http://cemmap.ifs.org.uk/wps/cwp0209.pdf.
Candemir A & zalluhoglu AE. 2011. Effect of Marketing Expenditures during Financial Crisis: Case of Turkey. Procedia social and behavioral sciences 24, pp. 291-299
Caselli F, Esquivel G & Lefort F. 1996. Reopening the Convergence Debate: A New Look at Cross-country Growth Empirics. Journal of Economic Growth 1 (3), pp. 363– 389.
Crespo Cuaresma J and Storckl MS. 2012. Effect of Marketing Spending in Premium Car Segment: New Evidence from Germany. Working Paper No. 201202.
Dekimpe MJ & Hanssens DM. 1995. Persistence of Marketing Effects on Sales. Marketing Science 14(1), pp. 1-21.
Furceri D & Zdzienicka A. 2012. Real Effect of Financial Crises in European Transition Economics. GATE-CNRS, University of Lyon.
Joshi A and Dominique Hanssens M. 2010. The Direct and Indirect Effects of Advertising Spending on Firm Value. Journal of Marketing: January 2010, Vol. 74, No. 1, pp. 20-33.
Khadraoui N & Smida M. 2012. Financial Development and Economic Growth: Static and Dynamic Panel Data Analysis. International Journal of Economics and Finance 4(5(.
Kokemouller N. 2013. What Is a Marketing Expenditure? Retrieved in December 1, 2014 from
http://smallbusiness.chron.com/marketing-expenditure-61198.
Leopold CH. 2014. Effect of Economic Recession on Pharmaceutical Policy & Medicine Sales in Eight European Countries. Bulletin of the World Health Organization No. BLT.13.129114.
Naghdi Y, Kaghazian S & Kakoei N. 2012. Global Financial Crisis & Inflation: Evidence from OPEC. Middle-East Journal of Scientific Research 11 (4), pp. 525-530.
Paul S. 2009. Cost of Marketing: What Is the Average Budget? Retrieved in December 1, 2014 from https://www.legalzoom.com/articles/cost-of-marketing-what-is-the-average-budget
Prasad E, Rogoff K, Wei SHJ & Kose M. 2003. Effects of Financial Globalization on Developing Countries: Some Empirical Evidence, International Monetary Funds(2005).
Roberts K. 2003. What Strategic Investment Should You Make During a Recession to Gain competitive advantage in the recovery?, Strategy & Leadership, Vol. 31 Iss: 4, pp.31 – 39
Tong, Hui and Wei, Shang-Jin, Real Effects of the 2007-08 Financial Crisis Around the World (March 18, 2009). Available at SSRN: http://ssrn.com/abstract=1363819