(IJC)
ISSN 2307-4523 (Print & Online)
© Global Society of Scientific Research and Researchers
http://ijcjournal.org/
A Modified Quantization Based Image Compression
Technique using Walsh-Hadamard Transform
Khin Thida Win
a*, Nang Aye Aye Htwe
ba,b
Department of Information Technology, Mandalay Technological University, The Union of the Republic of Myanmar
a
Email: [email protected]
b
Abstract
A new quantization table using the nearest maximum common prime factor is generated for image compression using Walsh-Hadamard Transform (WHT). Image compression is important for many applications that involve huge data storage and transmission such as multimedia, video conferencing and medical imaging. In the proposed system, RGB components of color image are converted to YCbCr color image. Then an image is divided into 8x8 pixel block for each block. WHT based image compression is used to loss image compression. The prime based new quantization table is created to reduce the quantization error (QE) bit in the quantization step. After the image is quantized, Huffman coding is a technique for representing the quantized coefficients as compactly as possible. The reverse process takes place for image decompression. The image compression system using WHT, standard quantization table, Huffman coding is also created. The performances are compared between original system and proposed system using performance parameters such as Compression ratio, Bit Per Pixel, Mean Square Error, Peak Signal to Noise Ratio and Time.
Keywords: Image compression; WHT; Quantization table; Huffman coding; loss compression.
1.Introduction
Multimedia data requires considerable storage capacity and transmission bandwidth. The data are in the form of graphics, audio, video and image. These types of data have to be compressed during the transmission process. Large amount of data cannot be stored if there is low storage capacity. The compression offers a means to reduce the cost of storage and increase the speed of transmission.
--- * Corresponding author
The objective of image compression techniques is to reduce redundancy of the image in order to able to store or transmit data in an efficient form. This results in the reduction of file size and allows more images to be stored in a given amount of disk or memory space [1, 2].
There are two types of image compression is present. These are lossy and lossless [3]. In lossless compression technique, the reconstructed image after compression is identical to original image. Lossless compression technique is used only for a few applications with stringent requirement such as medical imaging. In lossy compression technique, the decompressed image is not identical to original image but reasonably closed to it. Lossy compression technique is widely used because the quality of reconstructed images is adequate for most applications. Image, audio and video are most suited to this form of compression [4].
For compression, the first step is about color space conversion. Many color images are represented using the RGB color space. RGB representations are highly correlated, which implies that the RGB color space is not well-suited for independent coding. Since the human visual system is less sensitive to high frequency loss of chrominance than luminance. Therefore, some color space conversions such as RGB to YCbCr are used. It is well known that the Hadamard transform, which is mostly known as the Walsh- Hadamard transform, is one of the widely used transforms in signal and image processing. Nevertheless, WHT is just a particular case of general class of transforms based on Hadamard matrices [5]. WHT is a suboptimal, non-sinusoidal, orthogonal transformation that decomposes a signal into a set of orthogonal, rectangular waveforms called Walsh functions. The transformation has no multipliers and is real because the amplitude of Walsh (or Hadamard) functions has only two values, +1 or -1. WHTs are used in many different applications, such as power spectrum analysis, filtering, processing speech and medical signals, multiplexing and coding in communications, characterizing non-linear signals, solving non-linear differential equations, and logical design and analysis. Quantization involves dividing each coefficient by an integer between 1 and 255 and rounding off. The quantization table is chosen to reduce the precision of each coefficient and carried along with the compressed file. Huffman coding method removes redundant codes from the image and compresses a BMP image file [6]. For decompression, the compressed image is reversed to obtain the reconstructed image.
2.Related Work
Many researchers proposed different methods for image compression. There are many types of image compression techniques used for WHT.
D. S. Sujithra ,T. Manickam and D. S. Sudheer [7] proposed hyperspectral images are composed of hundreds of narrow and contiguous bands of data covering a large spectrum of reflected light. Conventional cameras are designed to record data in coarse of red, green and blue, while Hyperspectral images record much finer wavelengths and with a range far into the ultraviolet and infrared. These images are gathered by satellite. The proposed algorithm, based on Discrete Wavelet Transform (DWT) and Walsh Hadamard Transform (WHT), exploits both the spectral and spatial information in the images and reduce time for processing. Apply DWT to the Hyperspectral images which split into sub-band images, then Walsh Hadamard Transform on each block of the low-frequency sub-band and it split all DC values from each transformed block.
The goal is used to achieve best compression ratio and bit per pixel per band and compare the result with the well-known compression method. Combination of Discrete Wavelet Transform and Walsh Hadamard Transform achieves bet compression ratio and bit per pixel per band should be less than 0.1. The spatial and spectral resolution was retained after reconstructing the image. It requires less memory to store the compressed image data and it needs less time for processing.
M.A. Karagodin, J.B. Burkatovskaya and A.N. Osokin [8] presented Fast 2D Walsh Transform for the Truecolor Image Compression Algorithm. This system describes the new method of 2D Walsh transform calculation. This makes the image compression algorithm orthogonal transform stage more fast and easy. This method increases the Walsh-based image compression algorithm speed by 30% for compression and by 60% for decompression.
3.Block Diagram of Compression and Decompression Process
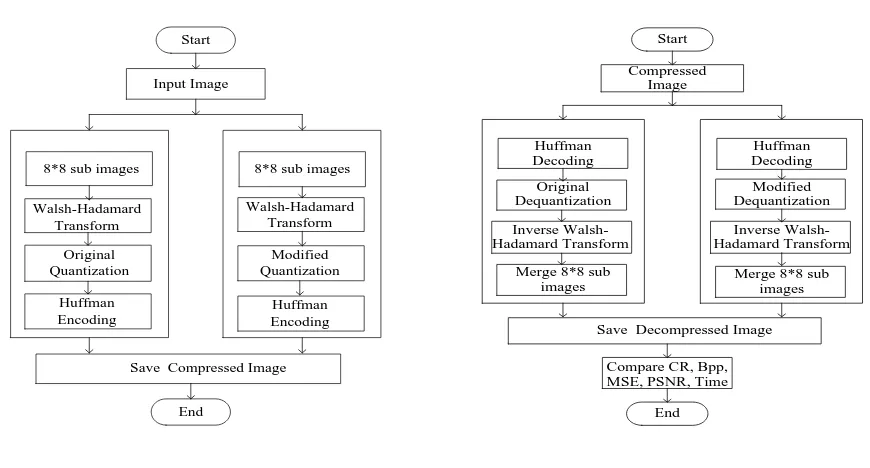
This system includes two parts, namely image compression and image decompression. For image compression, there are four steps in the original system: 8x8 sub image, WHT, quantization and Huffman encoding. At the compression system, this proposed system is modified the quantization step. Block diagram of quantization and modified quantization for image compression using WHT is shown in Figure 1.
Start
Input Image
8*8 sub images
Walsh-Hadamard Transform
Original Quantization
Huffman Encoding
Save Compressed Image
End
Modified Quantization
Huffman Encoding 8*8 sub images
Walsh-Hadamard Transform
Start Compressed
Image
Inverse Walsh-Hadamard Transform
Save Decompressed Image
End Compare CR, Bpp, MSE, PSNR, Time Huffman
Decoding Original Dequantization
Merge 8*8 sub images
Huffman Decoding Modified Dequantization Inverse Walsh-Hadamard Transform
Merge 8*8 sub images
Figure 1: Block Diagram of Quantization and Figure 2: Block Diagram of Quantization and Modified Modified Quantization for Image Quantization for Image Decompression using WHT
Compression using WHT
For image decompression, the compressed image is reversed to obtain the original image in the original system and the proposed system. After the image compression and decompression, the performances are evaluated in term of CR, Bpp, MSE, PSNR and Time. These results are compared. Block diagram of quantization and modified quantization for image decompression using WHT is shown in Figure 2.
3.1.YCbCr Color Space
At the compression process, the color images (RGB) is not suited for image processing because the human eye is more sensitive to luminance than chrominance. The original RGB fruit image is shown in Figure 3. So, RGB color image is converted into YCbCr color image by using Equation (1). So, this proposed system is used luminance (gray) for quantization. The YCbCr fruit image is shown in Figure 4. At the decompression process, YCbCr color space is transformed back to RGB color space by using Equation (2).
= B G R Cr Cb Y 0.081 0.419 0.500 0.500 0.331 0.169 -0.114 0.587 0.299 (1)However, the inverse transformation is simply expressed by
= Cr Cb Y B G R 0.0 1.7718 1.0 0.7142 0.3441 1.0 1.04021 0.0 1.0 (2)RGB Fruit image is shown in Figure 3 and YCbCr Fruit image is shown in Figure 4.
Figure 3: RGB Fruit Image Figure 4: YCbCr Fruit Image
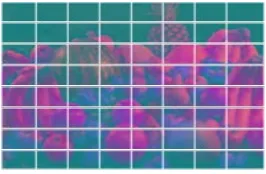
3.2.8×8 Sub-images
In this system, the input image is then divided into 8x8 blocks of pixels. Then, the WHT transform coefficients are calculated for each block. The 8x8 Fruit image is shown in Figure 5.
Figure 5: 8x8 Fruit Image
3.3.Walsh-Hadamard Transform (WHT)
WHT is the best known of the non sinusoidal orthogonal transforms. It has gained widespread use in digital image processing, since its application is easy. The basic functions are based on square or rectangular waves with peaks of ±1. The forward and inverse Walsh kernels are identical for 2-D images. This is because the array formed by the kernels is a symmetric matrix having orthogonal rows and columns, so its inverse array is the same as the array itself. The forward WHT equation is shown in Equation (3).
∑∑
− = − = + ∑ = =− 1 N 0 r 1 N 0 c )] ( ) ( ) ( ) ( [ 1 0 -1) ( c) I(r, v)WH(u, b r p u b c pi v
n
i i i i
(3)
Where, WH (u,v) is the result of the transform. I(r,c) is image pixel values at rth row and cth column. N refers to the dimension of the image.
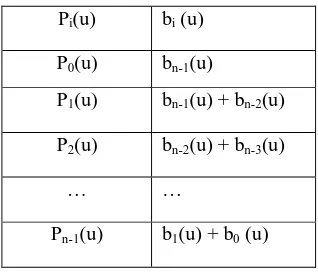
N = 2n, the exponent on the (-1), and bi(r) is found by considering r as a binary number and finding the ith bit. In addition, pi(u) is found as follows in Table 1.
Table 1: Pi(u) in terms of bi (u) Pi(u) bi (u)
P0(u) bn-1(u)
P1(u) bn-1(u) + bn-2(u) P2(u) bn-2(u) + bn-3(u)
… …
Pn-1(u) b1(u) + b0 (u)
This system needs to perform an inverse transform operation to reconstruct the original image from the transform coefficients in Equation (4). After 8x8 sub images are performed, the resulting transform coefficients are quantized.
∑∑
− = − = + ∑ = =− 1 N 0 r 1 N 0 c )] ( ) ( ) ( ) ( [ 1 0 -1) ( v) WH(u, N 1 c)I(r, b r p u b c pi v
n
i i i i
(4)
3.4.Modified Quantization Table
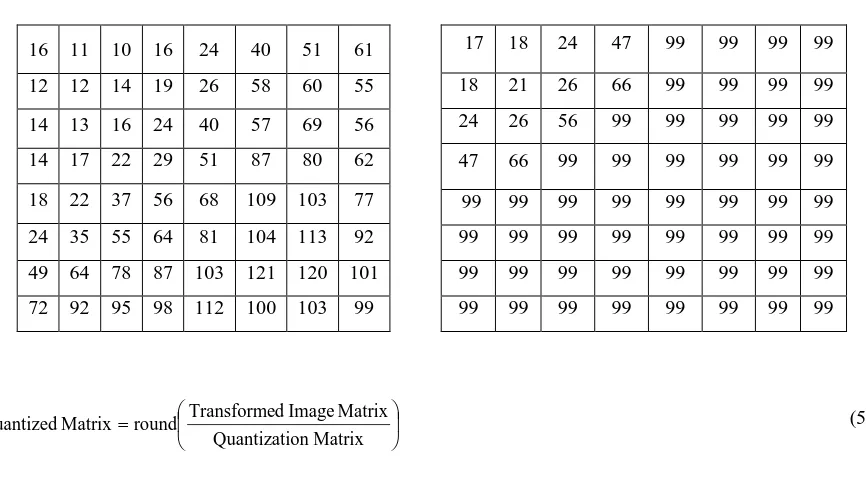
The proposed system is used two quantization tables: one for luminance table and the other for chrominance table as showed in Table 2 and Table 3.
The original system is used luminance table for the standard quantization table.Quantization is simply reduced the number of bits needed to store the transformed coefficients by reducing the precision values. Since it is a lossy process and is the main source of compression. For quantization, quantized matrix is achieved by dividing transformed image matrix by the quantization matrix and rounding off in Equation (5). The resultant matrix coefficients situated near the upper left corner have lower frequencies. The human eye is insensitive to variations in brightness of high-frequency components over a large area. Therefore, the high frequency values in the image matrix can be rounded off to zero. Lower frequencies are used to reconstruct the image.
Table 2: Quantization Table for Luminance Table 3: Quantization Table for Chrominance 17 18 24 47 99 99 99 99
18 21 26 66 99 99 99 99 24 26 56 99 99 99 99 99 47 66 99 99 99 99 99 99 99 99 99 99 99 99 99 99 99 99 99 99 99 99 99 99 99 99 99 99 99 99 99 99 99 99 99 99 99 99 99 99
=
Matrix on Quantizati
Matrix Image d Transforme round
Matrix
Quantized (5)
For dequantization, each element of quantized matrix is multiplied by the corresponding element of the quantization matrix as shown in Equation (6).
Matrix Quantized Matrix
on Quantizati Matrix
d
Dequantize = × (6)
The proposed system is chosen 512×512 pixels image for example. 64×64 blocks is at 512×512 pixels image. One block is divided into 8×8 sub block. For (0,0) position, the total block is 4096. 527, 461, 230, 543 and 185 are the transformed image matrix. 16 is the quantization matrix at (0,0) position. The proposed system is calculated for quantization as form of Equation (5) and reversed to obtain dequantization as form of Equation (6).
The proposed system summed the different value of quantization and dequantization values. This is called quantization error (QE). QE is increased even 5 blocks at (0,0) position. QE is more increased for 4096 block at (0,0) position. To decrease QE, this proposed system is generated a modified quantization table based on the nearest maximum common prime factor. For each number in Walsh-Hadamard Transform (WHT) coefficient table, the remainder value of the original system (Rold) is shown in Equation (7).
16 11 10 16 24 40 51 61 12 12 14 19 26 58 60 55 14 13 16 24 40 57 69 56 14 17 22 29 51 87 80 62 18 22 37 56 68 109 103 77 24 35 55 64 81 104 113 92 49 64 78 87 103 121 120 101 72 92 95 98 112 100 103 99
For (0,0)position,
Quantization Dequantization Difference
527 ÷ 16 = 32.93 = 33 × 16 = 528 1
461 ÷ 16 = 28.81 = 29 × 16 = 464 3
230 ÷ 16 = 14.37 = 14 × 16 = 224 6
543 ÷ 16 = 33.93 = 33 × 16 = 544 1
185 ÷ 16 = 11.56 = 12 × 16 = 192 7
18 (QE) ∑ = =N-1 0 i H(u,v) % Q(u,v) v) (u, old R (7)
Where, N is a number of 8 bits Walsh-Hadamard Transform (WHT) coefficient blocks. 527 ÷ 16 = 32.93 (Remainder = 15) For (0,0) position, the nearest six prime numbers are 7, 11, 13,17, 19, 23. The remainder value of the proposed system (Rnew) is shown in Equation (8). M 0 j 1 -N 0 i v) P(u, % v) H(u, minimum v) (u, new R = ∑ = = (8)
Where, P is nearest prime number of standard quantization value. M is nearest prime numbers count for each standard quantization value.
527 ÷ 7 = 75.28 (Remainder = 2) 527 ÷ 11 = 49.90 (Remainder = 12) 527 ÷ 13 = 40.53 (Remainder = 7) 527 ÷ 17 = 31.00 (Remainder = 0) 527 ÷ 19 = 27.73 (Remainder = 14) 527 ÷ 23 = 22.91(Remainder = 21)
The proposed system is modified standard quantization table according to the following algorithm. • Find nearest six prime numbers for each standard quantization table value.
• Find Rnew for each nearest prime number from equation (8).
• Find the least remainder value for Rnew in the nearest six prime numbers.
• Take into the prime value of the least remainder value for Rnew.
• Compare Rnew value with the respective value of Rold.
If Rnew value is less than Rold value then update in the modified quantization table with the prime value of the least remainder value for Rnew.
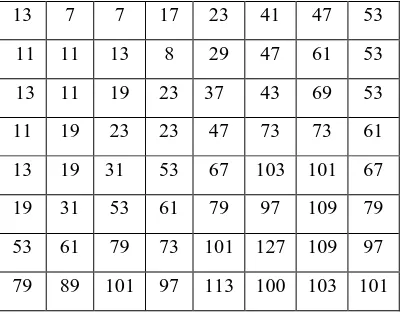
Otherwise leave the modified quantization table with the quantization matrix value for Rold. A modified quantization table for Fruit in Table 4 created from original quantization table for luminance.
Table 4: Modified Quantization Table for Fruit 13 7 7 17 23 41 47 53 11 11 13 8 29 47 61 53 13 11 19 23 37 43 69 53 11 19 23 23 47 73 73 61 13 19 31 53 67 103 101 67 19 31 53 61 79 97 109 79 53 61 79 73 101 127 109 97 79 89 101 97 113 100 103 101
After the modified quantization table is achieved, the proposed system reused in the equations (5) and (6) with this table and calculated to get the quantized coefficient. The value of quantized coefficient reused Huffman encoding step.
3.5.Huffman Encoding
The value of the quantization coefficient is used in Huffman encoding step. This step made the normal compression step. Huffman encoding is a popular compression technique that assigns variable length codes (VLC) to symbols, so that the most frequently occurring symbols have the shortest codes. In decompression, the symbols are reassigned their original fixed length codes
Figure 6: Compressed Fruit Image Figure 7: Compressed Fruit Image using Using Quantization Table Modified Quantization Table
Table 5: Huffman encoded table
Category Values Bits for the value
0 0 …
1 -1,1 0,1
2 -3,-2,2,3 00,01,10,11
3 -7,-6,-5,-4,4,5,6,7 000,001,010,011,100,101,110,111 4 -15,...,-8,8,...,15 0000,...,0111,1000,...,1111 5 -31,...,-16,16,...31 00000,...,01111,10000,...,11111 6 -63,...,-32,32,...63 000000,...,011111,100000,...,111111 7 -127,...,-64,64,...,127 0000000,...,0111111,1000000,...,1111111
3.6.Decompression
For decompression, the compressed image is reversed to obtain the reconstructed image. If the objective of decompression is same near the original image until the image is decompressed, then the proposed system is good. Decompression step is same or not near the original image for using the lossy compression in this system but it describe in this system for the priority of sizes. Decompressed fruit image using quantization table and decompressed fruit image using modified quantization table are shown in Figure 8 and Figure 9.
Figure 8: Decompressed Fruit Image Figure 9: Decompressed Fruit Image using using Quantization Table Modified Quantization Table
3.7. Experimental Results
The proposed system is tested on the different images (Panda, Water Lily and Dolphin) with the different sizes (64×64, 128×128, 256×256, 512×512). The results of Panda image with different sizes are shown in Figure 10. The performance parameters such as Compression ratio (CR), Bit Per Pixel (Bpp), Mean Square Error (MSE) and Peak Signal to Noise Ratio (PSNR) are used to measure the performance of the proposed system as shown in Table 6.
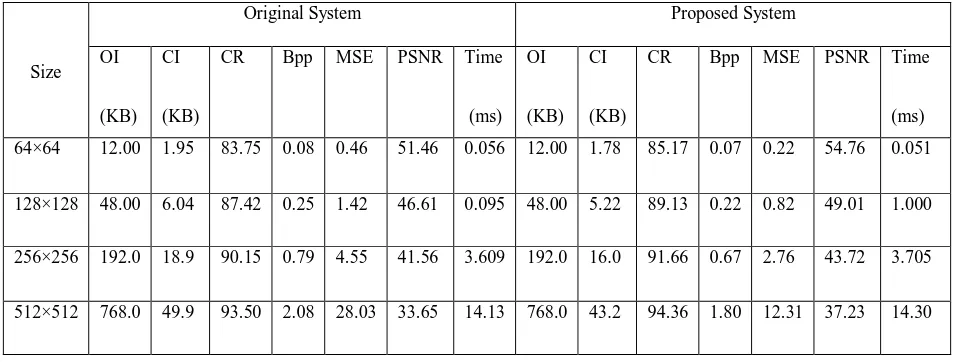
In the proposed system, the Panda image used different sizes such as 64×64, 128×128, 256×256, 512×512 is needed to make the performance comparison. The comparison of original system and proposed system with performance parameters is shown in Table 7.
64×64 128×128 256×256 512×512
Figure 10: Results of Panda Image
Table 6: Performance Parameters
In Table 7, the compression ratio (CR) is higher as WHT is lossy image compression method. So the image quality is decreased.
(OI) bits in size image color RGB Original (CI) bits in size image Compressed -1 = CR Ratio n Compressio Original Image Compressed Image Decompressed Image pixels of Number bits in image color compressed of Size = Bpp Pixel Per Bit
(
)
2M 1 i
N 1 j Aij-Bij MN 1 = MSE Error Square
Mean ∑
Bpp calculated on compressed image size is reduced 0.8 time for modified quantization table. However, this proposed system is emphasized on reducing QE although image quality and Bpp value are decreased. Since a quantization table is generated after considering the nearest six prime numbers to decrease QE, MSE value is decreased and PSNR value is increased according to image compression. The different time between the original system and the proposed system is 0.17 ms. The processing time is inconsequential because this system is less the more time.
Table 7: The Comparison of Original System and Proposed System with Performance Parameters
Size
Original System Proposed System
OI
(KB) CI
(KB)
CR Bpp MSE PSNR Time
(ms) OI
(KB) CI
(KB)
CR Bpp MSE PSNR Time
(ms) 64×64 12.00 1.95 83.75 0.08 0.46 51.46 0.056 12.00 1.78 85.17 0.07 0.22 54.76 0.051
128×128 48.00 6.04 87.42 0.25 1.42 46.61 0.095 48.00 5.22 89.13 0.22 0.82 49.01 1.000
256×256 192.0 18.9 90.15 0.79 4.55 41.56 3.609 192.0 16.0 91.66 0.67 2.76 43.72 3.705
512×512 768.0 49.9 93.50 2.08 28.03 33.65 14.13 768.0 43.2 94.36 1.80 12.31 37.23 14.30
4.Conclusion
A modified quantization based image compression Technique using Walsh-Hadamard Transform (WHT) is implemented by using C# programming language. The proposed system is created a quantization table based on prime factors to decrease quantization error (QE). This system is tested on different types of images and sizes. According to the experimental results, the bigger the image size is, the better the compressed image size (CI) and compression ratio (CR) are. And 50% of MSE is nearly reduced for all the image sizes. The modified quantization table takes more time than the reused WHT method whereas the different time between the original system and the proposed system is 0.17 ms when compressing the 512×512 pixel image size. Compared to the overall system, this time is too small and be neglected. Since the modified quantization table, the proposed system is better than the original WHT. In the future work, this system can be extended by using other entropy encoding techniques or hybrid compression methods based on proposed method and other methods to get better compression ratio. In addition, speech compression or MPEG compression experiments will be extended by using thisapproach.
References
[1] S. Bhavani, K. Thanushkodi, “A Survey on Coding Algorithms in Image Compression”, International Journal on Computer Science and Engineering, Vol.02, No.05, pp. 1429-1434, 2010.
[2] G. K. Kharate, V. H. Pati, “Color Image Compression Based on Walvelet Packet Best Tree”, International Journal on Computer Science, Vol. 7, No. 3, March 2010.
[3] Rafael C. Gonzalez, Richard Eugene; “Digital image processing”, Edition 3, 2008, page 466
[4] Still Image and video compression with MATLAB, K. S. Thyagarajan, A JOHN WILEY & SONS, INC., PUBLICATION.
[5] Pennebaker, W.F., Mitchell, J.L., JPEG Still Image Data Compression Standard, 3rd Ed. New York: Springer, 1993.
[6] Mamta Sharma, “Compression Using Huffman Coding”, International Journal of Computer Science and Network Security, Vol.10, No.5, May 2010.
[7] D.S.Sujithra, T.Manickam and D.S.Sudheer, “ Compression Of Hyperspectral Image Using Discrete Wavelet Transform And Walsh Hadamard Transform”, International Journal of Advanced Research in Electronics and Communication Engineering (IJARECE) Volume 2, Issue 3, March 2013.
[8] M. A. Karagodin, J. B. Burkatovskaya, and A. N. Osokin, “Fast 2D Walsh Transform for the Truecolor Image Compression Algorithm”, 0-7803-8943-3/05/$20.00 ©2005IEEE, Informational Technologies.