Journal
of
Education
&
So
cial
Sciences
ISSN: 2410-5767 (Online) ISSN: 2414-8091 (Print)
Higher Education and Unemployment: In
Urban and Rural Pakistan
Affiliation:
Shafaque Fatima
PhD Scholar, Department of Education, IQRA University, Karachi. E-mail: shafaque.fatima@outlook.com
Saqib Sharif
Assistant Professor, Department of Finance, Institute of Business Administration, Karachi.
E-mail: ssharif@iba.edu.pk
Manuscript Information
Submission Date: March 21, 2018
Acceptance Date: Apr 15, 2019
Citation in APA Style:
Fatima, S., & Sharif, S. (2019). Higher Education and Unemployment: In Urban and Rural Pakistan,Journal of Education & Social Sciences, 7(1), 39-54.
DOI:https://doi.org/10.20547/jess0711907104
Higher Education and Unemployment: In Urban and Rural Pakistan
Shafaque Fatima∗ Saqib Sharif†
Abstract:Pakistan’s unemployment rate among individuals with higher education has increased rapidly in recent years. However, very little research is conducted so far on this phenomenon in Pakistan. This paper investigates the effect of higher education attainment on unemployment rate in urban and rural areas of Pakistan. Data of 10 years is taken from Labor Force Survey (LFS) for four provinces. Regression analysis is conducted to examine the data. The evidence suggests a strong positive relationship between population with higher levels of education (HE) and their unemployment rate. That is, with the increase in HE population there is greater increase in their unemployment rate and the results are more pronounced for rural areas compared to urban. Female unemployment incidence was found less than male counterparts. The paper also documents that higher education unemployment rate contributes more towards total unemployment at different levels of education. The unique feature of this study is that this empirical work examines the effect of higher education and unemployment with spatial differences that is still not fully explored in Pakistan as well as in international context. Further research is required to investigate the effect of different disciplines and quality of higher education on unemployment rate.
Keywords: Higher education, urban unemployment, rural unemployment, Pakistan, male fe-male population, labor force.
Introduction
It is a general phenomenon that with higher level of education, individual’s expectations for better employment opportunities are also higher, however it depends on circum-stances that a person with higher education gets matching job or remains unemployed (Bajaj,2010). Unemployment rate for individuals with higher education vary due to var-ious reasons such as overall economic condition of the country, job experience, field of acquired degree, spatial differences, and gender; generally women with higher education have less employment opportunities as compared to men (Barros, Guironnet, & Peypoch,
2011;Livanos,2010).
Pakistan higher education sector has witnessed rapid changes during last few years. More population with higher education is observed than ever in the history of the coun-try, along with erratic economic conditions, leads to increase in unemployment. Global recession, law and order situation, energy crisis and other macroeconomic variables are also responsible for high and persistent unemployment rate in 2000s (Maqbool, Mah-mood, Sattar, & Bhalli,2013). When overall economic condition of a country is not stable and unemployment rate is high, problem of over-education occurs. “Over education
de-∗
PhD Scholar, Department of Education, IQRA University, Karachi. E-mail: shafaque.fatima@outlook.com †
scribes the extent to which an individual possesses a level of education in excess of that which is required for their particular job” (McGuinness,2006). In addition, when the job market competition is high, workers in effort to be more competitive are more likely to enroll in higher education institutions (Sanders-Dewey & Dudek,2018).
This empirical study contributes to the extant literature regarding higher education effect on unemployment by taking special consideration of spatial differences in the sam-ple selection while selecting statistical models Although, reasons and conditions of un-employment in urban and rural areas are found different. Nevertheless, very little re-search has been conducted distinguishing relationship between higher education and un-employment in rural and urban areas particularly. This segregation is important since there is significant difference between employment opportunities and rate of population with higher education. When spatial differences are not kept into consideration it leads to flaws in estimation for country level analysis. Hence, it is important to distinguish rural and urban areas in order to take a real picture of return to education and unemployment situation (Goetz & Rupasingha,2004) . Previous studies investigating the relationship between higher education and unemployment have utilized combine data of national or regional level for higher education and unemployment without distinguishing urban and rural areas (Backes-Gellner & Geel,2014;Erdem & Tugcu,2012;N ´u ˜nez & Livanos,2010). Therefore uniqueness of this study is that it investigates the relationship between unem-ployment and higher education in rural and urban areas separately. Moreover, this study is an addition to existing literature on unemployment in Pakistan because of the fact that existing literature sufficiently lacks empirical research on unemployment situation in Pak-istan.
Literature Review
Education is an important determinant of human capital, the more education an individ-ual receives the more human capital she/he accumulates that leads to better employment opportunities. For the first time,Nickel(1979) put forwarded the hypothetical framework to quantitatively investigate the relationship between level of education and unemploy-ment incidence1(N ´u ˜nez & Livanos,2010). According toNickel(1979), “Increases in the
level of schooling significantly raise the return to future training, which leads, presum-ably, to the accumulation of still higher levels of human capital during working life”. When an employee is highly skilled and qualified; finding a job is easier for her than the individuals with low level of education. In addition she/he is at minimum risk from get-ting fired. Therefore higher education guard an individual from unemployment (Wolbers,
2000;Mincer,1991;Nickel,1979) and can easily find new job when leaves one (Mincer,
1991). For this reason, the employer prefer to hire individuals with more education and skills, thus it becomes easier for the highly educated job seekers to compete and find a better job for themselves (Wolbers,2000).
A second approach in this regard is that higher education is not creating enough job opportunities that can accommodate all university graduates. In this regard; various
sons have been described so far: One of the reasons is mismatch between skills required by industry and skills university graduates possess (Livanos,2010;Woodley & Brennan,
2000). “In addition, technological change is skill-biased in the highly developed coun-tries. Since labour markets are not perfectly flexible, the reduced relative demand for unskilled labor can lead to increased unemployment, especially in the low-skilled group” (Weber,2002). Besides,Paul and Murdoch(2000) argued in their study that increase in higher education leads to increase in unemployment among highly educated individuals because more qualified people are seekers of white collar jobs. When employment oppor-tunities are limited and number of qualified persons keeps increasing, then it is difficult for job-market to absorb all individuals.
Although among available empirical studies “most studies indicate negative relation-ship between higher education and unemployment, it can be both negative and positive” (Erdem & Tugcu,2012) due to different economic and political circumstances. Cardoso and Ferreira(2009) find expansion of job market more pronounced for university gradu-ates as compared to non-gradugradu-ates in Portugal, i.e., negative effect of higher education on unemployment. On the contrary,Erdem and Tugcu(2012) found positive causal effect of higher education on unemployment in the long run as well as in the short run in Turkey. Probability of being unemployed also varies among university graduates from different educational fields, for instance,Backes-Gellner and Geel(2014) compared career success between university graduates from vocational and academic fields of higher education in Switzerland. Wherein, they found that at the beginning of the career, graduates from both fields confront same probability of being unemployed but afterwards employment situations become more favourable for vocational graduates. Likewise,Livanos(2010) in a study conducted in Greece with micro-data of Labour Force Survey find that graduates from different fields of study face different probabilities of unemployment. In another empirical study,N ´u ˜nez and Livanos(2010) investigated the effect of different academic degrees and field of study on unemployment across Europe; they document significant variation between different subjects towards probability of being unemployed.
Besides, in recent years, researchers are paying more attention on spatial/regional dif-ferences while analyzing the data (Chang,2014;Haapanen & Tervo,2009;Huiban,2009) because spatial differences have significant effect on economic growth and development (Irwin, Isserman, Kilkenny, & Partridge,2010;Portnov,2006) hence issue of unemploy-ment is no exception (Patuelli, Schanne, Griffith, & Nijkamp,2012;Molho,1995). Accord-ing to different theories, spatial differences affect unemployment conditions, rural and urban divide is an important factor (Hilary, Ingham, & Herbst,2011).
mi-grate to cities for better employment opportunities.
According toHilary et al.(2011), along with various other factors low level of human capital is also associated with rural unemployment, people with university degrees are in search of better jobs. Say from rural to urban or big cities or another country (Olsson,
2009;Detang-Dessendre & Molho,1999). Whereas in urban areas this migration of people from rural areas along with, economic crisis, and mismatch between supply and demand of labour etc., are main reasons of unemployment.
Higher Education in Pakistan
Higher education in Pakistan has seen a rapid change during the last decade, enrollment rate has increased significantly; another important feature is widespread growth of pri-vate sector institutions (Economic Adviser’s Wing,2015). This was the era when private sector was welcomed, increase in number of universities led to increase number of stu-dents. This scenario has led to inclusion of more labor force with higher education quali-fications than before; although quality of graduates from different institutes vary to great extent. Such change took place due to policy shift in higher education sector in the be-ginning of 2000s, when huge funds were allocated and Higher Education Commission (HEC) was established. HEC developed a policy reform named Medium-Term Develop-ment Framework (MTDF) which is a base for ongoing policy reforms. HEC is responsible to set quality standards, monitoring those standards on regular basis, it is mandatory for all universities/DAIs to get accreditation from HEC, otherwise their degrees are not acceptable and for this purpose they have to meet set criteria. HEC assigned different rankings to those universities according to certain set criteria.
Despite all such reforms Pakistani higher education is still in vulnerable state, lag far behind international and regional ranking of universities (Hoodbhoy,2009). Certain rea-sons are responsible for that, such as lack of funding, bad governance, and, negligence by government. A British agency Quacquarelli Symonds (QS) gave 50th rank to Pakistani higher education system in 2016. Irony is that even in south Asian region, Pakistani uni-versities lag behind neighboring countries like India and Iran (Hoodbhoy,2009).
Unemployment Situation in Pakistan
force as oppose to illiterate ones. Increasing rate of unemployment is causing increase in crimes (Gillani, Rehman, & Gill,2009). Pakistan is among the developing economies that are characterized by so-called dual economies. Thus, they have relatively developed urban sector and less developed rural sector.
Urbanization and Unemployment in Urban Areas
In Pakistan population as well as number of job seekers are increasing consistently in urban areas; this is the reason why urban unemployment is much higher than rural ar-eas. According to Labour Force Survey of Pakistan (2013-2014); urban unemployment rate was 3.13%and rural unemployment rate was much lesser 2.56%. Two main causes are influx of rural population towards urban centers and secondly, the pace of industrial sector development is not sufficient to provide employment to a larger segment of labour force (Ministry of Finance, 2014).
Rural Unemployment
Unemployment rate in rural areas of Pakistan is also increasing because agriculture sec-tor cannot provide jobs to all the unemployed labor force, main reason is that Pakistani farmers have also started to utilize new technology, with machinery, less labor is required thus causes more unemployment. Other sectors of economy in rural areas are in weaker condition and are not capable enough to employ all labor force (Ministry of Finance, 2014).
Methodology
Data
This study obtained data from Labor Force Survey (LFS) conducted by Pakistan Bureau of Statistics (PBS), (previously named as Federal Bureau of Statistics). Although PBS has been conducting this survey since 1963, but complete data required for this study is avail-able from the years 2001-2014, whereas survey was not conducted during the years 2000-01, 2002-03, 2004-05, and 2011-12.Hence, we have a ten years of annual data. This study has included LFS’ category of ‘Degree, Post Graduate, and PhD’ for the variable higher education population and its corresponding unemployment rate.
Whereas data for control variables i.e. (a) median household income growth; (b) real GDP growth; (c) R&D expenditure as a percentage of GDP; (d) Index of Economic Freedom (i.e., Economic structure of the country); (e) GINI Index (i.e., Inequality Index); and (f) growth in the number of Universities is obtained from Euromonitor International database.
Empirical Model
charac-teristics. In order to investigate the impact of independent variable higher education population on dependent variable unemployment rate, we have used three linear regres-sion techniques viz. Pooled Ordinary Least Squares (POLS), Fixed-effects regresregres-sion and Random-effects regression, first POLS model was formulated by Erdem & Tugcu (2012) whereas model 2 and 3are Fixed effects and Random effects specifications because in this study we have province wise panel data:
Ui,t=α0+βHEi,t+∂Xt+i,t P ooled model (1)
Ui,t=α0+βHEi,t+∂Xt+µi,t F ixed ef f ects model (2)
Ui,t=α0+βHEi,t+∂Xt+i,t+µi,t Random ef f ects model (3)
Where in model (1)Ui,tis the unemployment rate for province i in year t,α0is the constant
term / common y-intercept,HEi,tis the population with higher education for province i in year t, Xt is the number of control variables, those are median household income growth, real GDP growth, R&D expenditure to GDP, economic freedom index, Gini in-dex, and universities growth; andi,t is the stochastic error term of province i at time t. Whereas in equation (2)α0i is the y-intercept of province i; andµi,t is the error term of provinceiat timet. Reason to include two more models i.e., fixed effects and random ef-fects along with first regression model is that this study deals with panel data. When we are dealing with panel data, OLS regression is not always appropriate forGreen(2008).
Table 1
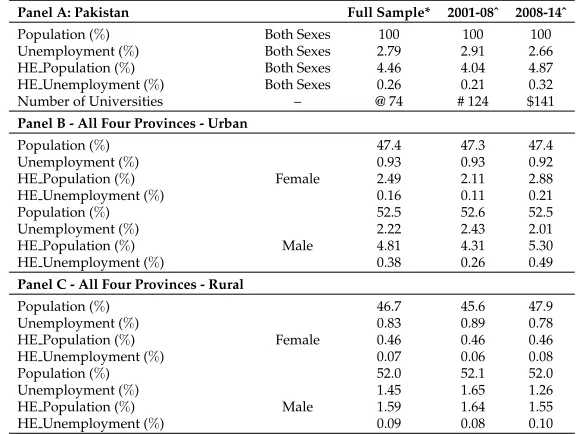
Population, unemployment and higher education in Pakistan
Panel A: Pakistan Full Sample* 2001-08ˆ 2008-14ˆ
Population (%) Both Sexes 100 100 100
Unemployment (%) Both Sexes 2.79 2.91 2.66
HE Population (%) Both Sexes 4.46 4.04 4.87
HE Unemployment (%) Both Sexes 0.26 0.21 0.32
Number of Universities – @ 74 # 124 $141
Panel B - All Four Provinces - Urban
Population (%) 47.4 47.3 47.4
Unemployment (%) 0.93 0.93 0.92
HE Population (%) Female 2.49 2.11 2.88
HE Unemployment (%) 0.16 0.11 0.21
Population (%) 52.5 52.6 52.5
Unemployment (%) 2.22 2.43 2.01
HE Population (%) Male 4.81 4.31 5.30
HE Unemployment (%) 0.38 0.26 0.49
Panel C - All Four Provinces - Rural
Population (%) 46.7 45.6 47.9
Unemployment (%) 0.83 0.89 0.78
HE Population (%) Female 0.46 0.46 0.46
HE Unemployment (%) 0.07 0.06 0.08
Population (%) 52.0 52.1 52.0
Unemployment (%) 1.45 1.65 1.26
HE Population (%) Male 1.59 1.64 1.55
HE Unemployment (%) 0.09 0.08 0.10
In order to select appropriate regression model we have applied both Lagrange mul-tiplier andHausman(1978)’s tests. The descriptive statistics, t-test results, and regression analyses are discussed in the results section. As can be seen in the results section from Ta-bles 1 and 2, we have divided the total sample period into two sub-periods of 5-year each. The idea behind this bifurcation is to observe how the level of higher education popula-tion (i.e., undergraduates, graduates, and post-graduates) have increased over time; and, what is the rate of unemployment commensurate with those highly educated population. That is, whether the government has been able to accommodate the bulging educated youth population in the work force of an economy or not?
Data Analysis
Panel A of Table 1 describes the results for full sample covering ten years of annual data, and last two columns show data divided into two sub-periods of 5-year each, i.e., 2001-08 and 2008-2014. Panel-A shows total population of Pakistan in percentage, total unem-ployment rate of the country, population with higher education, and unemunem-ployment rate of highly educated population. Interestingly, the summary statistics suggests that the higher education population has increased to 4.87%(average of recent 5-year) from 4.04% in the first sub-period (i.e., average of previous 5-year). Further, the overall unemploy-ment rate in different levels of education has declined in the recent sub-period, but the unemployment rate among highly educated population has increased. The results are consistent with the findings ofErdem and Tugcu(2012), who suggest that it is impossible to absorb all the graduates in the labour markets because many countries fail to link the educational system with the needs of labour market and more youth population reaching working age.
Table 2
Growth in Higher Education Population and Unemployment
Panel A: Pakistan 2001-08ˆ 2008-14ˆ Percentage Change t-test
Total Unemployment (%) Both Sexes 2.91 2.66 -8.83% -0.96 HE Unemployment (%) Both Sexes 0.21 0.32 42.12% 2.94**
Panel B: Four Provinces - Urban
Total Unemployment Female 0.93 0.92 -1.06% -0.07
HE Unemployment 0.11 0.21 64.66% 2.25**
Total Unemployment Male 2.43 2.01 -19.05% -1.69*
HE Unemployment 0.26 0.49 63.37% 1.25
Panel C: Four Provinces - Rural
Total Unemployment Female 0.89 0.78 -12.90% -0.84
HE Unemployment 0.06 0.08 28.77% 0.95
Total Unemployment Male 1.65 1.26 -26.98% -1.67*
HE Unemployment 0.08 0.10 22.31% 0.71
*, **, and *** indicates significance at the 1%, 5%, and 10% levels, respectively.
In Table 2, we have compared the total unemployment with higher education un-employment. The difference between the two sub-periods for total unemployment and higher education unemployment variables is being assessed by applying parametric two-tail t-statistics. In Panel A of Table 2, we observe that percentage change in total unem-ployment in Pakistan has declined by 8.83% from recent 5-year sub-period to previous 5-year sub-period. However, the difference is insignificant. Moreover, the higher educa-tion unemployment in Pakistan has significantly increased by 42.12%at the 5%level.
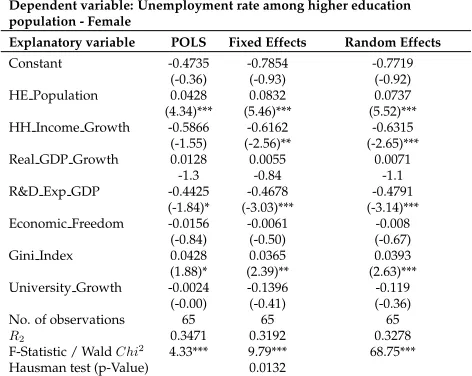
Table 3
Regression Results for Higher Education Female Population
Dependent variable: Unemployment rate among higher education population - Female
Explanatory variable POLS Fixed Effects Random Effects
Constant -0.4735 -0.7854 -0.7719
(-0.36) (-0.93) (-0.92) HE Population 0.0428 0.0832 0.0737 (4.34)*** (5.46)*** (5.52)*** HH Income Growth -0.5866 -0.6162 -0.6315
(-1.55) (-2.56)** (-2.65)*** Real GDP Growth 0.0128 0.0055 0.0071
-1.3 -0.84 -1.1
R&D Exp GDP -0.4425 -0.4678 -0.4791 (-1.84)* (-3.03)*** (-3.14)*** Economic Freedom -0.0156 -0.0061 -0.008
(-0.84) (-0.50) (-0.67)
Gini Index 0.0428 0.0365 0.0393
(1.88)* (2.39)** (2.63)*** University Growth -0.0024 -0.1396 -0.119
(-0.00) (-0.41) (-0.36)
No. of observations 65 65 65
R2 0.3471 0.3192 0.3278
F-Statistic / WaldChi2
4.33*** 9.79*** 68.75*** Hausman test (p-Value) 0.0132
Three estimations are applied in the analysis: Pooled Ordinary Least Squares, Fixed-Effect and Random-Fixed-Effect. The independent variables are Higher Education Population; Median Household Income growth; Real GDP growth; Research & Development expendi-ture as a percentage of GDP; Index of Economic Freedom; Gini Index; and growth of Uni-versities. Growth is calculated using natural logarithm of current-year minus previous-year value. After the initial evidence, we run regression analyses to check the relationship between higher education population and unemployment rate. POLS were run for refer-ence whereas in order to select between FE or RE models both Hausman test and Lagrange Multiplier (LM) test were used. In Tables 3 and 4, we have segregated the sample data into Female and Male population of all four provinces.
Table 4
Regression Results for Higher Education Male Population
Dependent variable: Unemployment rate among higher education population - Male
Explanatory variable POLS Fixed Effects Random Effects
HE Population 0.1036 0.1104 0.1036
(4.63)*** (2.38)** (4.63)*** HH Income Growth 0.8401 0.8718 0.8401
-0.64 -0.64 -0.64
Real GDP Growth -0.0038 -0.0046 -0.0038 (-0.11) (-0.13) (-0.11) R&D Exp GDP -0.545 -0.5198 -0.545 (-0.67) (-0.61) (-0.67) Economic Freedom 0.0098 0.0106 0.0098
-0.16 -0.17 -0.16
Gini Index -0.0403 -0.0436 -0.0403
(-0.51) (-0.52) (-0.51) University Growth -1.3961 -1.4132 -1.3961 (-0.77) (-0.76) (-0.77)
No. of observations 80 80 80
R2 0.2746 0.2744 0.2746
F-Statistic / WaldChi2
3.89*** 1.59 27.26***
Breusch and Pagan LM-test 0.1887
Three estimations are applied in the analysis: Pooled Ordinary Least Squares, Fixed-Effect and Random-Effect. The independent variables are Higher Education Population; Median Household Income growth; Real GDP growth; Research & Development expenditure as a percentage of GDP; Index of Economic Freedom; Gini Index; and growth of Universities. Growth is calculated using natural logarithm of current-year minus previous year value.
to the mismatch between the skills / qualification required by labour market and the skills or qualifications the graduates possess (N ´u ˜nez & Livanos,2010).
For male population regression analysis both Hausman and then LM tests were run and found insignificant i.e. POLS was more favorable. The Table 4 results also depict a similar picture for male population of Pakistan’s four provinces. With the growing num-ber of higher education population, the growth in unemployment rate is even higher. That is, a 1%increase in higher education male population, there is roughly 10%increase in unemployment rate. None of the control variables have significant relation with un-employment rate in case of male population. Moreover, the situation is slightly different among male graduates compared to female graduates in case of Pakistan.
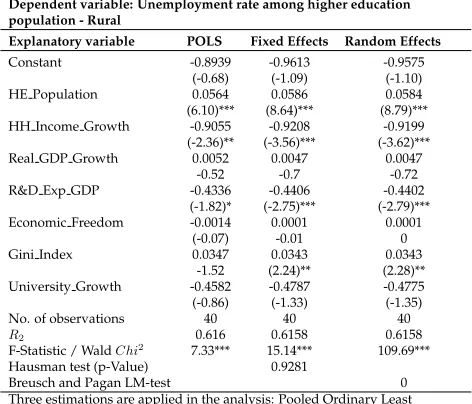
Lastly, we grouped our dataset into rural and urban regions from four provinces based on higher education population and their corresponding unemployment rate. Table 5 shows the coefficient of higher education population significantly positive at the 1%level. On the basis of Hausman and LM test results RE models were found appropriate for both rural and urban areas.
Table 5
Regression Results for Higher Education Rural Population
Dependent variable: Unemployment rate among higher education population - Rural
Explanatory variable POLS Fixed Effects Random Effects
Constant -0.8939 -0.9613 -0.9575
(-0.68) (-1.09) (-1.10)
HE Population 0.0564 0.0586 0.0584
(6.10)*** (8.64)*** (8.79)*** HH Income Growth -0.9055 -0.9208 -0.9199 (-2.36)** (-3.56)*** (-3.62)*** Real GDP Growth 0.0052 0.0047 0.0047
-0.52 -0.7 -0.72
R&D Exp GDP -0.4336 -0.4406 -0.4402 (-1.82)* (-2.75)*** (-2.79)*** Economic Freedom -0.0014 0.0001 0.0001
(-0.07) -0.01 0
Gini Index 0.0347 0.0343 0.0343
-1.52 (2.24)** (2.28)** University Growth -0.4582 -0.4787 -0.4775 (-0.86) (-1.33) (-1.35)
No. of observations 40 40 40
R2 0.616 0.6158 0.6158
F-Statistic / WaldChi2 7.33*** 15.14*** 109.69***
Hausman test (p-Value) 0.9281
Breusch and Pagan LM-test 0
Three estimations are applied in the analysis: Pooled Ordinary Least Squares, Fixed-Effect and Random-Effect. The independent variables are Higher Education Population; Median Household Income growth; Real GDP growth; Research & Development expenditure as a percentage of GDP; Index of Economic Freedom; Gini Index; and growth of Universities. Growth is calculated using natural logarithm of current-year minus previous year value.
*, **, and *** indicates significance at the 10%, 5%, and 1% levels, respectively.
areas, also portray a similar picture, i.e., with 1%increase in higher education population, the unemployment rate increases by 6.34% on average; and two control variables, i.e., median household income growth and R&D expenses to GDP have significantly negative influence on unemployment.
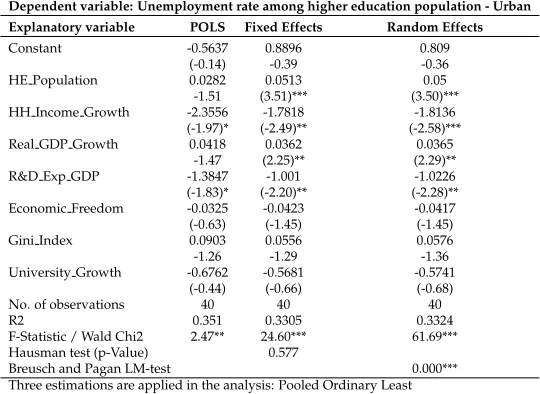
Table 6
Regression Results for Higher Education Urban Population
Dependent variable: Unemployment rate among higher education population - Urban Explanatory variable POLS Fixed Effects Random Effects
Constant -0.5637 0.8896 0.809
(-0.14) -0.39 -0.36
HE Population 0.0282 0.0513 0.05
-1.51 (3.51)*** (3.50)*** HH Income Growth -2.3556 -1.7818 -1.8136 (-1.97)* (-2.49)** (-2.58)***
Real GDP Growth 0.0418 0.0362 0.0365
-1.47 (2.25)** (2.29)** R&D Exp GDP -1.3847 -1.001 -1.0226 (-1.83)* (-2.20)** (-2.28)** Economic Freedom -0.0325 -0.0423 -0.0417 (-0.63) (-1.45) (-1.45)
Gini Index 0.0903 0.0556 0.0576
-1.26 -1.29 -1.36
University Growth -0.6762 -0.5681 -0.5741 (-0.44) (-0.66) (-0.68)
No. of observations 40 40 40
R2 0.351 0.3305 0.3324
F-Statistic / Wald Chi2 2.47** 24.60*** 61.69*** Hausman test (p-Value) 0.577
Breusch and Pagan LM-test 0.000***
Three estimations are applied in the analysis: Pooled Ordinary Least Squares, Fixed-Effect and Random-Effect. The independent variables are Higher Education Population; Median Household Income growth; Real GDP growth; Research & Development expenditure as a percentage of GDP; Index of Economic Freedom; Gini Index; and growth of Universities. Growth is calculated using natural logarithm of current-year minus previous year value.
*, **, and *** indicates significance at the 10%, 5%, and 1% levels, respectively.
Although these regression results for effect of higher education on unemployment slightly differ. However when we see growth rate of higher education population in Panel B of Table 1 for female 2.11%and 2.88%; male 4.31%and 5.30%for the two sub-samples in urban areas respectively; whereas, higher education population in Panel C of Table 1: female 0.46%and 0.46%, male 1.59%and 1.64% in rural areas; that is fairly lower than urban higher education population growth rate. Nevertheless, HE unemployment rate is slightly lower than urban areas, shows the fact that the rural areas of Pakistan offer fewer opportunities for highly educated working age population as compared to urban areas. The higher unemployment rate for urban areas points to the fact that more and more unemployed population are moving towards urban areas for better opportunities.
The evidence suggests that higher education unemployment is mainly contributing towards total unemployment. Further, consistent with the study of Schomburg(2000);
Male category. The signs are consistent with Panel A. The evidence from Table 2 is consis-tent withKettunen(1997) who states that chances of re-employment are more for persons with lowest levels of additional education, while the probability of employment re-duces with highest levels of education. SincePl ¨umper and Schneider(2007) suggest that due to high unemployment or friction in the labour market of an economy, unemployed youth are forced back into the university education. However this policy decision cannot reduce unemployment rate in view of the fact that size of job market does not change except that share of unemployed people with higher education increases. Therefore, Pak-istan is not an exception and overall, the results are consistent with extant literature 2.
Whereas our results contradict withWolbers (2000); Mincer(1991) they found that in-crease in level of education leads to dein-crease in the probability of unemployment.
Moreover, in the recent past, many degree awarding institutions have initiated pro-grams such as ‘Career Fair’ and established separate departments within the universities, such as ‘Job Placement / Corporate Liaison Units’ that facilitate their graduates during transition period from graduation to employment. However, anecdotal evidence suggests that those initiatives have achieved little success.
Recommendations and Implications for Future Research
Rural and urban distinction is necessary to make policies compatible with different eco-nomic situations (Goetz & Rupasingha,2004). Data available from LFS for higher edu-cation population includes graduates from all universities and professions. Due to this limitation it was not possible to investigate the unemployment incidence among individ-uals from different higher education segments, in this regard further research is required. Besides Urban category of LFS does not provide separate data on unemployment in in-dustrial hubs and other urban areas unavailability of data might be a hindrance to thor-oughly understand unemployment condition. Regular and thorough surveys and more research studies by national institutions and at individual researchers’ level are necessary to find reasons of unemployment so that more people can be motivated towards higher education.
In order to combat unemployment among highly educated individuals, interaction be-tween universities, Higher Education Commission of Pakistan and industry is crucial. So that universities can educate students in accordance with the requirement of an economy and available human capital can be utilized in an efficient manner. Because mismatch between labours of required skills supply and demand is the major cause of unemploy-ment. In this regard a long term perspective is kept in to consideration that in future in what sector economy will demand more labor force and where saturation condition will occur. At micro level, educational leaders can also play an important role because “lead-ers are appointed employees whose responsibility is to strive to create a positive change in their particular institution” (Hashmi, Saad, & Madden,2018), since university leaders have more social resources than other educational institutions.
2The job market for highly educated population in our neighboring country India can be gauged from this
Conclusion
High unemployment rate among highly educated individuals has become a serious prob-lem in Pakistan nevertheless scarcely researched yet. Results show higher unemployment rate among individuals with higher education as compare to other education levels. Re-gression analysis suggest that increase in higher education population leads to increase in unemployment rate, this rate was found higher in urban areas as 6.34%on average as compare to 5.70%in rural areas. While we also control for socio-economic factors that could have effect on our results. However, the results are robust to various control vari-ables, such as household median income growth, real GDP growth, R&D expenditure to GDP, Index of Economic freedom, Gini Index, and Universities’ growth. Consistent with the fact that due to limited job opportunities in rural regions people with higher qualification prefer to migrate towards urban areas that leads to increase probability of unemployment for highly qualified people.
References
Backes-Gellner, U., & Geel, R. (2014). A comparison of career success between graduates of vocational and academic tertiary education. Oxford Review of Education, 40(2), 266–291.
Bajaj, M. (2010). Intergenerational perspectives on education and employment in the Zambian copperbelt. Comparative Education Review,54(2), 175–197.
Barros, C. P., Guironnet, J.-P., & Peypoch, N. (2011). How to quickly get a job? The tran-sition from higher education to French labour market by a survival model. Applied Economics,43(4), 439–448.
Bornstein, D., & Davis, S. (2010). Social entrepreneurship: What everyone needs to knowR. Oxford University Press.
Cardoso, A. R., & Ferreira, P. (2009). The dynamics of job creation and destruction for university graduates: Why a rising unemployment rate can be misleading. Applied Economics,41(19), 2513–2521.
Chang, S.-C. (2014). Implication for cities of the liberalizing national economies in twenty-first century.Applied Economics,46(4), 400–407.
Detang-Dessendre, C., & Molho, I. (1999). Migration and changing employment status: A hazard function analysis. Journal of Regional Science,39(1), 103–123.
Economic Adviser’s Wing. (2014).Economic Survey: 2013-2014 Finance Division. Islamabad: Government of Pakistan.
Economic Adviser’s Wing. (2015).Economic Survey: 2014-2015 Finance Division. Islamabad: Government of Pakistan.
Erdem, E., & Tugcu, C. T. (2012). Higher education and unemployment: A cointegration and causality analysis of the case of Turkey. European Journal of Education,47(2), 299–309.
Gillani, S. Y. M., Rehman, H. U., & Gill, A. R. (2009). Unemployment, poverty, inflation and crime nexus: Cointegration and causality analysis of Pakistan.Pakistan Economic and Social Review,47(1), 79–98.
Goetz, S. J., & Rupasingha, A. (2004). The returns to education in Rural Areas. Review of Regional Studies,34(3), 245–259.
Green, W. H. (2008).Econometric analysis. NJ: Prentice Hall, Upper Saddle River.
Haapanen, M., & Tervo, H. (2009). Self-employment duration in urban and rural locations. Applied Economics,41(19), 2449–2461.
Hashmi, K., Saad, I., & Madden, M. (2018). The emotional politics of educational leaders in higher education institutions: A discursive perspective. Journal of Education & Social Sciences,6(1), 40–54.
Hausman, J. A. (1978). Specification tests in econometrics. Econometrica: Journal of the Econometric Society, 1251–1271.
Hilary, I., Ingham, M., & Herbst, J. (2011). Local unemployment in Poland: Rural–urban contrasts. Applied Economics,43(10), 1175–1186.
Huiban, J.-P. (2009). Urban versus rural firms: Does location affect labor demand?Growth and Change,40(4), 649–672.
International Labour Organization. (2015). World Employment and Social Outlook. Interna-tional Labour Office. Geneva.
IPR Fact Sheet. (2016). The Employment Situation in Pakistan. Institute for Policy Re-forms.Retrieved fromhttp://ipr.org.pk/wp-content/uploads/2016/01/ The-Employment-Situation-In-Pakistan-Fact-Sheet.pdf
Irwin, E. G., Isserman, A. M., Kilkenny, M., & Partridge, M. D. (2010). A century of research on rural development and regional issues. American Journal of Agricultural Economics,92(2), 522–553.
Kettunen, J. (1997). Education and unemployment duration. Economics of Education Re-view,16(2), 163–170.
Livanos, I. (2010). The relationship between higher education and labour market in Greece: the weakest link? Higher Education,60(5), 473–489.
Maqbool, M. S., Mahmood, T., Sattar, A., & Bhalli, M. (2013). Determinants of unemploy-ment: Empirical evidences from Pakistan.Pakistan Economic and Social Review,51(2), 191–208.
McGuinness, S. (2006). Overeducation in the labour market. Journal of Economic Surveys, 20(3), 387–418.
Mincer, J. (1991). Education and unemployment(Tech. Rep.). National Bureau of Economic Research.
Molho, I. (1995). Spatial autocorrelation in British unemployment. Journal of Regional Science,35(4), 641–658.
Nickel, S. (1979). Education and the lifetime pattern of employment. Journal of Political Economy,87(5), 117–131.
N ´u ˜nez, I., & Livanos, I. (2010). Higher education and unemployment in Europe: An analysis of the academic subject and national effects. Higher Education,59(4), 475– 487.
Olsson, M. (2009). Matching in the labour market: Modelling spatial aspects of the Swedish unemployment benefit rules.The Annals of Regional Science,43(2), 345–363. Patuelli, R., Schanne, N., Griffith, D. A., & Nijkamp, P. (2012). Persistence of regional
unemployment: Application of a spatial filtering approach to local labor markets in Germany. Journal of Regional Science,52(2), 300–323.
Paul, J.-J., & Murdoch, J. (2000). Higher education and graduate employment in France. European Journal of Education,35(2), 179–187.
Pl ¨umper, T., & Schneider, C. J. (2007). Too much to die, too little to live: Unemployment, higher education policies and university budgets in germany. Journal of European Public Policy,14(4), 631–653.
Portnov, B. A. (2006). Urban clustering, development similarity, and local growth: A case study of Canada. European Planning Studies,14(9), 1287–1314.
Schomburg, H. (2000). Higher education and graduate employment in Germany.European Journal of Education,35(2), 189–200.
Weber, B. A. (2002). The link between unemployment and returns to education: Evidence from 14 European countries. Education+ Training,44(4/5), 171–178.
Wolbers, M. H. (2000). The effects of level of education on mobility between employment and unemployment in the Netherlands.European Sociological Review,16(2), 185–200. Wolf, A. (2002). Does education matter?: Myths about education and economic growth.
Perspectives,64(4), 115–118.