Journal of Social Research & Policy, Vol. 3, Issue 2, December 2012
Journal of Social Research & Policy, Vol. 3, Issue 2, December 2012 ONLINE FIRST
Personal Well-Being among Spanish
Adolescents
FERRAN CASAS
1Institut de Recerca sobre Qualitat de Vida. Universitat de Girona
ARMANDO BELLO
UNICEF-Spain, Research Department
MÒNICA GONZÁLEZ
Institut de Recerca sobre Qualitat de Vida. Universitat de Girona
MIREIA ALIGUÉ
Institut de Recerca sobre Qualitat de Vida. Universitat de Girona
Abstract
Although results from several samples of 12 to 16-year-old adolescents in Catalonia (region of N.E. Spain), obtained and published between 1999 and 2012, suggesting a constant decrease in adolescents’ subjective well-being (SWB) with age, until now no such data have been available for the general Spanish adolescent population. In this article we present results for a representative Spanish sample (N=5934), limited to students in the year of ESO (Educación Secundaria Obligatoria or Compulsory Secondary Education) (mean age = 12.09). aims of this article are twofold: (a) to validate an adaptation of the PWI for Spanish adolescents of around 12-years-old, which we will call PWI8adp; and (b) to identify variables which show rences in children’s subjective well-being (SWB) – using the PWI8adp as an indicator of SWB – when dichotomically comparing groups or categories of children. With this sample, among other we observe that Spanish adolescents scoring highest in subjective well-being tend to live in semi-urban environments, were born in Spain, have not repeated a school year, live in only one family household, have two adults at home with paid employment, have parents with secondary education or higher and have more material and cultural belongings at home compared to children with lower SWB. Furthermore, the adolescents with higher subjective well-being are those that never worry about money, think other people treat them well, feel greater personal safety, feel they are listened to, report doing daily activities together with their family, do physical exercise or sport every day, have been told children have rights, have experienced fewer important recent changes in their lives and feel their time is well organized.
Keywords: Adolescents, Subjective well-being, PWI, Life satisfaction, Spain, Catalonia.
Introduction
Casas et al. (2007) reported to have included the items of the adult version of the PWI in a list of 19 items on satisfaction with rent aspects and domains of life in a questionnaire that was administered to a sample of N=1618 12 to 16 year-old adolescents in Catalonia in 2003.
1 Postal Address: Departament de Psicologia. Universitat de Girona. Pl. S. Domènec, 9. 17071-Girona. Spain.
was the first report of the PWI being used in Spain with adolescents. The same year, Casas et al. (2007) published a report in the Catalan language on television and other audiovisual media used among a representative sample N=5140 of Catalan 11 to 17 year-old students in compulsory secondary education, collected during the 2005-06 academic year, which also included results using the PWI. Data from this second survey were adopted as normative for Catalan adolescents (Casas, 2012).
Casas (2011) reported the results of different data collections from 12 to 16 year-old adolescents in Catalonia in 2003, 2006 and 2007, and another from 12 to 18 year-olds in 2008, demonstrating that in all samples PWI scores decreased with age in this age range. In Casas (2012), a more detailed report can be found of all publications using the PWI with adolescents in Catalonia, including some comparative research of Catalan samples with data from other countries and, in one article, data from another Spanish region.
However, until now no PWI data have been published for a sample of adolescents from the whole of Spain. In this article we present results for a representative Spanish sample (N=5934), limited to students in the first year of ESO (Educación Secundaria Obligatoria or Compulsory Secondary Education) (mean age = 12.09). The aims of this article are twofold: (a) to validate an adaptation of the PWI for Spanish adolescents of around 12-years-old, which we will call PWI8adp; and (b) to identify variables which show significant differences in children’s subjective well-being (SWB) – using the PWI8adp as an indicator of SWB – when dichotomically comparing groups or categories of children.
In order to check the reliability and validity of the PWI8adp, we test its fit statistics using Confirmatory Factor Analysis (CFA). We also check for convergent validity by comparing its results with other psychometric scales of well-being, the SLSS (Huebner, 1991a) and a single-item scale on overall life satisfaction (OLS). These two scales differ from the PWI in that they are context-free, that is to say, they are not based on satisfaction with different life domains.
The PWI Manual indicates that respondents who constantly provide extreme responses must be removed from the database, under the assumption that must be unreliable or are not able to discriminate on a scale of 11 points. On the basis of data obtained from previous samples of young Catalans it can be hypothesized that children of the ages studied here have a life optimism bias which is even more pronounced than that found in adult samples, and therefore population means which are higher than at later ages. This abundance of constant extreme positive responses entails a problem: are they due to children of this age lacking discriminative ability on an 11-point scale, which represents a problem with regard to the reliability of their responses? Or is it due to the aforementioned life optimism bias, more pronounced than among adults? This dilemma led us to consider that caution was required before taking the decision to simply eliminate subjects who give extreme responses on the assumption that they are unable to discriminate.
JSRP JSRP | 21| 3
Methodology
Instruments
The questionnaire that was administered, included the following three psychometric scales: single-item scale on Overall Life Satisfaction (OLS), a 5-single-item version of the Students’ Life Satisfaction Scale (SLSS5) proposed by Huebner (1991a), and an 8-item version of satisfaction with life domains, a variation of the Personal Well-Being Index proposed by Cummins et al. (2003), which we shall call the PWI8 adapted (PWI8adp) (Table 1).
It also contained a series of questions on children’s objective life situations, and another set of questions that explored respondents’ opinions, perceptions and evaluations. Some of these questions were formatted agree / disagree, using 5-point Likert scales, other questions were about the frequency of various activities, others addressed satisfaction with specific aspects of their life, rated on a scale of 0-10, and still others referred to values respondents aspired to for their future. All of the questions were subject to pilot testing in four different Spanish regions where different co-official languages are spoken to check they were understood by students of this age. Several improvements were made to the wording of some questions in the questionnaire following proposals by the children themselves.
Table 1: Items in the 3 psychometric scales used in this research.
Instrument Response scale Items included
OLS
11-point scale, from Completely dissatisfied (0) to Completely satisfied (10) with a label also in the neutral point (5) Not dissatisfied or satisfied.
To what extent are you satisfied with your life as a whole?
SLSS5 5-point scale, from Completely agree (0) to Completely disagree (5)
My life is going well My life is just right
I wish I had a different kind of life I have a good life
I have what I want in life
PWI8adp
11-point scale, from completely dissatisfied (0) to completely satisfied (10) with a label also in the neutral point (5) not dissatisfied or satisfied.
Satisfaction with your health Satisfaction with all the things you have
Satisfaction with your relations with other people in general Satisfaction with the school you attend
Satisfaction with your use of time Satisfaction with how safe you feel Satisfaction with your opportunities in life Satisfaction with people living in the area you live in
Scores for all items were collected using a 0-10 scale following Cummins & Gullone’s (2000) recommendations and scores for multi-item scales were transformed into a 0-100 scale to facilitate comparison.
Personal Well-Being Index (PWIadp)
This scale was designed by Cummins et al. (2003) as part of the Australian Unity Well-being Index. Originally, it included seven items on satisfaction with different life domains. In this study two additional items were included, one on satisfaction with school, as proposed by Tomyn & Cummins (2011), and another on satisfaction with use of time, as proposed by Casas et al (2012).
Personal Well-Being among Spanish Adolescents 2 | JSRP
was the first report of the PWI being used in Spain with adolescents. The same year, Casas et al. (2007) published a report in the Catalan language on television and other audiovisual media used among a representative sample N=5140 of Catalan 11 to 17 year-old students in compulsory secondary education, collected during the 2005-06 academic year, which also included results using the PWI. Data from this second survey were adopted as normative for Catalan adolescents (Casas, 2012).
Casas (2011) reported the results of different data collections from 12 to 16 year-old adolescents in Catalonia in 2003, 2006 and 2007, and another from 12 to 18 year-olds in 2008, demonstrating that in all samples PWI scores decreased with age in this age range. In Casas (2012), a more detailed report can be found of all publications using the PWI with adolescents in Catalonia, including some comparative research of Catalan samples with data from other countries and, in one article, data from another Spanish region.
However, until now no PWI data have been published for a sample of adolescents from the whole of Spain. In this article we present results for a representative Spanish sample (N=5934), limited to students in the first year of ESO (Educación Secundaria Obligatoria or Compulsory Secondary Education) (mean age = 12.09). The aims of this article are twofold: (a) to validate an adaptation of the PWI for Spanish adolescents of around 12-years-old, which we will call PWI8adp; and (b) to identify variables which show significant differences in children’s subjective well-being (SWB) – using the PWI8adp as an indicator of SWB – when dichotomically comparing groups or categories of children.
In order to check the reliability and validity of the PWI8adp, we test its fit statistics using Confirmatory Factor Analysis (CFA). We also check for convergent validity by comparing its results with other psychometric scales of well-being, the SLSS (Huebner, 1991a) and a single-item scale on overall life satisfaction (OLS). These two scales differ from the PWI in that they are context-free, that is to say, they are not based on satisfaction with different life domains.
The PWI Manual indicates that respondents who constantly provide extreme responses must be removed from the database, under the assumption that must be unreliable or are not able to discriminate on a scale of 11 points. On the basis of data obtained from previous samples of young Catalans it can be hypothesized that children of the ages studied here have a life optimism bias which is even more pronounced than that found in adult samples, and therefore population means which are higher than at later ages. This abundance of constant extreme positive responses entails a problem: are they due to children of this age lacking discriminative ability on an 11-point scale, which represents a problem with regard to the reliability of their responses? Or is it due to the aforementioned life optimism bias, more pronounced than among adults? This dilemma led us to consider that caution was required before taking the decision to simply eliminate subjects who give extreme responses on the assumption that they are unable to discriminate.
There is a wealth of scientific literature to demonstrate that SWB is positively related to many of the so-called positive constructs in psychology. These findings refer to adult populations, however, and evidence with children and adolescents is restricted to just a few authors, most of whom worked with samples in the USA. We therefore think it is worth conducting a broad analysis of how well-being relates to different variables that reflect children’s living conditions and the diverse activities they participate in, and how it may be influenced by the different perceptions and evaluations of children themselves.
The wording of the other items – except satisfaction with your health – has been slightly changed in order to make them more clearly understandable for the age of the intended sample. Satisfaction with your standard of living has been substituted by satisfaction with all the things you have, which is a similar wording to that in the PWI-SC (Cummins & Lau, 2005). Satisfaction with your personal relationships has been substituted by satisfaction with your relations with other people in general. Satisfaction with your safety has been substituted by satisfaction with how safe you feel. Satisfaction with what you have achieved in life has been substituted by satisfaction with your opportunities in life. Satisfaction with feeling part of your community has been substituted by Satisfaction with people living in the area you live in. Satisfaction with your future security was not included.
The scale used has an end-labelled format, from completely dissatisfied (0) to completely satisfied (10) with a label also in the neutral point (5) not dissatisfied or satisfied. The addition of a neutral-point label was decided in order to make it more clear to children that there was a range of positive and a range of negative values – we thought this might help them not to focus so much on the highest values of the scale.
The psychometric properties of the PWI have been published in several articles (see, for example, Lau, Cummins & McPherson, 2005; International Wellbeing Group, 2006). Cronbach’s
α was originally reported to lie between 0.7 and 0.8. The seven original domains form a single component and predict over 50% of the variance for “satisfaction with life as a whole” (Cummins et al., 2003) with adult samples.
Cronbach’s α of the PWI8adp was .78. The scale shows a single component explaining 40.61% of the variance.
Students’ Life Satisfaction Scale (SLSS)
This scale was designed by Huebner (1991a) as a context-free 7-item one-dimensional scale. Up until 1994 it was tested on small samples of 10 to 13-year-olds (N=79) (Huebner, 1991b) and 7-14-year-olds (N=254) (Huebner, 1991a) in the USA using a 4-point frequency scale (from never to almost always). Reported Cronbach alphas ranged from .73 (Terry & Huebner, 1994) to .82 (Huebner, 1990b; Huebner, Suldo & Valois, 2003).
In Fogle, Huebner & Laughlin (2002) the scale is reported to use a 6-point scale from strongly agree to strongly disagree, and Cronbach’s alpha is reported at 0.86 (N=160, 10-15-year-olds). Gilman & Huebner (1997) suggested caution with respect to assuming the comparability of scores across the two formats. Not all of the 7 items on the original scale have always been found to make the same high contributions to the overall index of the scale (Terry & Huebner, 1994).
After reviewing these results, for our questionnaire we decided on a 5-item, 5-point scale labelled from completely agree to completely disagree, which we shall call SLSS5.
Cronbach’s α of the SLSS5 in our sample was .80. The scale shows a single component explaining 60.99% of the variance.
Single-item scale on Overall Life Satisfaction (OLS)
JSRP JSRP | 23| 5
satisfied. The translation of the item back into English is To what extent are you satisfied with your life as a whole?
Procedure
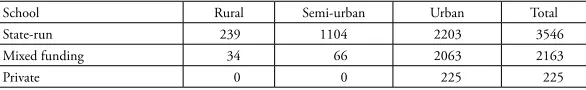
A two-stage cluster sampling design was used to select a representative stratified sample of Spanish children in the first year of ESO. In the first stage, schools in each autonomous region or city (17+2) in Spain were stratified according to whether they were state-run, mixed funding or private, and whether they were located in urban (>20,000 inhabitants), semi urban (between 2,000 and 20,000) or rural (<2,000) environments, in order to calculate the minimum number of schools in each strata for the sample to be representative with less than 2% error at a confidence level of 95%. We then randomly selected the fixed number of schools in each stratum for the chosen region. The real margin of error in the sample assuming maximum uncertainty was 1.9%.
At each school, we proceeded in accordance with the regular ethical guidelines for administering questionnaires to children in Spain and asked for the consent of the director. When a school agreed to participate, we randomly selected two classes in the first year of ESO. We then asked for cooperation from the class teacher. Following approval, and as soon as the ethical and formal procedures were concluded, the children were asked for their cooperation and were informed that their data would be treated confidentially and that they were free to refuse. The questionnaires were group-administered in their regular classroom. One of their usual teachers and one or two researchers were present during administration of the questionnaires to answer any questions that arose.
Sample
The sample is composed of 5,934 children (50.1% boys and 49.9% girls) aged 11 to 14 (mean =12.09) in the first year of ESO. Age of N=117 is unknown (2%). The 13 and 14-year-olds (19.4%) are mainly children repeating a year, although some of them may be immigrants with a lower academic level than expected for their age and therefore placed in a lower year than other children of the same age. 11.2% of the children in the sample reported they were not born in Spain. 78.2% reported living in only one household with both parents; 14.1% reported living in more than a household regularly or occasionally; and 2.7% reported living in a household NOT with their own family. We cannot understand the last figure without further qualitative research, as only 0.8% of the children in Spain are at present in residential or foster care.
Table 2: Surveyed children: Real sample
School Rural Semi-urban Urban Total
State-run 239 1104 2203 3546
Mixed funding 34 66 2063 2163
Private 0 0 225 225
Personal Well-Being among Spanish Adolescents 4 | JSRP
The wording of the other items – except satisfaction with your health – has been slightly changed in order to make them more clearly understandable for the age of the intended sample. Satisfaction with your standard of living has been substituted by satisfaction with all the things you have, which is a similar wording to that in the PWI-SC (Cummins & Lau, 2005). Satisfaction with your personal relationships has been substituted by satisfaction with your relations with other people in general. Satisfaction with your safety has been substituted by satisfaction with how safe you feel. Satisfaction with what you have achieved in life has been substituted by satisfaction with your opportunities in life. Satisfaction with feeling part of your community has been substituted by Satisfaction with people living in the area you live in. Satisfaction with your future security was not included.
The scale used has an end-labelled format, from completely dissatisfied (0) to completely satisfied (10) with a label also in the neutral point (5) not dissatisfied or satisfied. The addition of a neutral-point label was decided in order to make it more clear to children that there was a range of positive and a range of negative values – we thought this might help them not to focus so much on the highest values of the scale.
The psychometric properties of the PWI have been published in several articles (see, for example, Lau, Cummins & McPherson, 2005; International Wellbeing Group, 2006). Cronbach’s
α was originally reported to lie between 0.7 and 0.8. The seven original domains form a single component and predict over 50% of the variance for “satisfaction with life as a whole” (Cummins et al., 2003) with adult samples.
Cronbach’s α of the PWI8adp was .78. The scale shows a single component explaining 40.61% of the variance.
Students’ Life Satisfaction Scale (SLSS)
This scale was designed by Huebner (1991a) as a context-free 7-item one-dimensional scale. Up until 1994 it was tested on small samples of 10 to 13-year-olds (N=79) (Huebner, 1991b) and 7-14-year-olds (N=254) (Huebner, 1991a) in the USA using a 4-point frequency scale (from never to almost always). Reported Cronbach alphas ranged from .73 (Terry & Huebner, 1994) to .82 (Huebner, 1990b; Huebner, Suldo & Valois, 2003).
In Fogle, Huebner & Laughlin (2002) the scale is reported to use a 6-point scale from strongly agree to strongly disagree, and Cronbach’s alpha is reported at 0.86 (N=160, 10-15-year-olds). Gilman & Huebner (1997) suggested caution with respect to assuming the comparability of scores across the two formats. Not all of the 7 items on the original scale have always been found to make the same high contributions to the overall index of the scale (Terry & Huebner, 1994).
After reviewing these results, for our questionnaire we decided on a 5-item, 5-point scale labelled from completely agree to completely disagree, which we shall call SLSS5.
Cronbach’s α of the SLSS5 in our sample was .80. The scale shows a single component explaining 60.99% of the variance.
Single-item scale on Overall Life Satisfaction (OLS)
The importance of including a single-item scale on overall life satisfaction when studying SWB has been highlighted by Campbell, Converse & Rodgers (1976). In our research, we included a question on Satisfaction with your overall life, using an end-labelled 0-10 scale from completely dissatisfied to completely satisfied, and with a label also at the neutral point (5) of not dissatisfied or
According to the sample design, 4.6% of the students surveyed attend schools located in rural
settings, 19.7% in semi-urban environments and 75.7% urban environments. 59.7% are students at state schools, 36.5% mixed funding schools and 3.8% private schools (Table 2).
Statistical analyses
In order to carry out a Confirmatory Factor Analysis (CFA) of the version of the PWI used here, all values missing from the items on any of the three psychometric scales have been substituted by regression.
In our sample, the number of subjects who obtained 100 out of 100 points in the PWI is N=834, which represents a high percentage of the total sample (14.05%). No subject had a constant 0 answer on the PWIadp.
If we consider the subjects exhibiting constant extreme responses for all items of the three scales (14), the total is N=410 (6.91% of the total). We believe these subjects can be eliminated from the sample under the assumption of little discriminative ability or unreliability. However, it was not possible to state that the rest of the adolescents who scored 100 on the PWI could not qualify their answers, though they may discriminate differently from adults on the same scale.
In order to make our results comparable with other samples that have applied the PWI manual, the data presented in this study did not include the N=834 subjects who scored 100 out of 100 on the PWIadp. However, we would like to state that we see this as an excessive selection criterion when it comes to people in this age group which could seriously distort the results obtained with small samples.
General results
PWI8adp performance
Only 0.5% of respondents scored less than 50 out of 100; 14% scored between 50 and 79.9; 24% scored between 80 and 89.9; and 47.3% scored between 90 and 99.9. If we do not delete any respondent, the mean score for Spanish adolescents in the first year of ESO is 89.60 out of 100 (89.13 for boys and 90.07 for girls). When deleting the 410 children that had constant extreme answers in 14 well-being items, the mean overall score decreases only slightly: 88.83 (88.28 for boys and 89.37 for girls). Deleting all subjects with extreme constant answers in the PWI8adp (N=834) gives a mean score of 87.89 (87.43 for boys and 88.37 for girls).
JSRP JSRP | 25| 7
Table 3: Correlation among psychometric scales and PWI items
PWI8
adp OLS SLSS5 Sat. thingshave
Sat. people area
Sat. relat.
Sat. school
S. time use
Sat. health
Sat. safe feel
OLS 0.643**
SLSS5 0.570** 0.567**
Sat things you have 0.595** 0.406** 0.416**
Sat people living area 0.645** 0.288** 0.276** 0.286**
Sat relations other p. 0.639** 0.365** 0.326** 0.339** 0.386**
Sat school you attend 0.584** 0.314** 0.330** 0.285** 0.251** 0.297**
Sat your use of time 0.683** 0.434** 0.383** 0.308** 0.326** 0.334** 0.288**
Sat health 0.555** 0.385** 0.314** 0.268** 0.210** 0.273** 0.247** 0.326**
Sat how safe you feel 0.695** 0.552** 0.429** 0.305** 0.291** 0.366** 0.281** 0.441** 0.359**
Sat opportunities in life 0.671** 0.564** 0.457** 0.350** 0.263** 0.324** 0.284** 0.417** 0.331** 0.481**
**. Correlation is significant at the 0.01 level (2-tailed).
Table 4: Regression of PWI items on OLS.
Beta t Sig.
(Constant) 3.077 0.002
Satisfaction with your health 0.102 9.700 0.000
Satisfaction with all the things you have 0.136 12.676 0.000 Satisfaction with your relations with other people in general 0.053 4.788 0.000 Satisfaction with the school you attend 0.051 4.920 0.000 Satisfaction with your use of time 0.088 7.755 0.000
Satisfaction with how safe you feel 0.260 0.000
Satisfaction with your opportunities in life 0.286 24.803 22.224
0.000 Satisfaction with people living in the area you live in 0.015 1.366 0.172
The regression of these items on OLS displays an adjusted R² of .476. All items make a significant contribution to OLS, except satisfaction with people in the area I live in. The highest betas are for
satisfaction with opportunities I have in life and satisfaction with my personal safety (Table 4).
Confirmatory Factor Analysis displays good fit statistics for the model, with standardized estimates slightly lower for satisfaction with people in the area I live in and satisfaction with school
(Figure 1), the highest being satisfaction with safety, with time use and with opportunities in life.
Figure 1:Confirmatory Factor Analysis. Standardized estimates for the latent variable PWI
c
with 8 items. ²=186.30; df=18; p=0.000; NFI=0.981; CFI=0.983; RMSEA=0.040(0.035-0.045); SRMR=0.021
We can therefore conclude that the PWI8adp scale is good enough to be used with adolescents of this age, displaying good psychometric properties, good reliability and convergent validity with other psychometric well-being scales. Among its items, only satisfaction with people in the area you live in does not seem to make a relevant contribution to OLS.
Subjective well-being and gender
JSRP JSRP | 27| 9
Table 5: Satisfaction indicators and well-being indexes, according to gender
Spanish mean
Satisfaction with Total Boys Girls
all the things you have 9.31* 9.24 9.37
people living in the area you live in 8.26* 8.18 8.33 your relations with other people in general 9.12* 9.05 9.19
your health 9.47 9.48 9.46
your use of time 8.74 8.77 8.71
the school you attend 8.92* 8.72 9.11
how safe you feel 8.97* 9.04 8.90
your opportunities in life 9.03* 8.97 9.08
your life as a whole x10 (OLS) 91.57 91.57 91.56
SLSS 85.15 84.84 85.46
PWI8adp, no subject deleted 89.60* 89.13 90.07
PWI8adp, constant extreme answers in 31 items (N=102) deleted 89.42* 88.95 89.88
PWI8adp, constant extreme answers deleted (N=835) 87.89* 87.43 88.37 * Gender differences significant at 0.05
These results seem to suggest that at this age both sexes tend to display a high level of life satisfaction, which is reflected in different aspects or domains according to sex, and that these “compensate” one another to leave no significant overall differences when “we look beyond individual domains” (the logic of context-free scales lies in capturing that “something else” from the classic gestalt principle that “the whole is more than the sum of its parts”).
Subjective well-being according to some personal characteristics and material and psychosocial life conditions
The fact of the child being born in the country he or she is now living in or not displays a relationship with level of SWB. When we compare children reporting that they were born in Spain to those reporting that they were not, the former display higher SWB (F(1, 5902) = 18.870, p < 0.0005).
Another fact influencing SWB during adolescence is age, which in our case is mixed up with the fact of repeating an academic year. When in this study we compare 13 and 14 year-olds, who are presumably repeating an academic year, with those in the school year corresponding to their age, the latter display higher SWB (F(1, 5802) = 100.78, p < 0.0005).
When it came to giving the level of education of their parents, 28.6% of respondents were unable to do so for their father and 24.1% for their mother. Among those who provided these data, it appears that the higher the educational level of the mother, the higher the child’s PWI8adp score. By contrast, this increase is not constant in the case of the father, as children of fathers with a university degree display a slightly lower SWB than those with “A” levels, VT, or equivalent, without the difference being statistically significant. Furthermore, those boys and girls with either a mother or father who did not complete primary school display significantly lower subjective well-being than others (Table 6).
When we compare children reporting that their father finished higher education or a university degree with those reporting their father having a lower level of education, the former display higher SWB (F(1, 5721) = 17.34, p < 0.0005). When we test the same comparison with the
mother, the former also display higher SWB(F(1, 5743) = 29.55, p < 0.0005). By contrast, the
same cannot be said for those with parents who finished secondary education and those with university-educated parents.
Table 6: Subjective well-being measured with PWI8adp, according to parents education
Father’s education Mother’s education
Did not finish primary studies 84.52 83.66
Primary or secondary, or equivalent 87.76 87.33
Upper secondary or equivalent 88.95 88.49
University career 88.61 88.97
(F(3, 3622) = 14.64, p < 0.0005)
(F(3, 3859) = 20.82, p < 0.0005)
When we compare children reporting that one of their parents did not finish primary education with those reporting parents that did, the former display lower SWB. This is the case with both the father (F(1, 5721) = 20.41, p < 0.0005) and the mother (F(1, 5743) = 34.35, p < 0.0005).
Although the questionnaire uses open questions to ask respondents about the current
occupation of each parent, the answers were not easy to categorize, and the results do not
clearly display whether a relationship exists between the subjective well-being of children and their parents’ current occupations.
Material and cultural belongings at home seem to have an influence on the child’s SWB. When we compare those children reporting to have the highest number of belongings at home with children giving any other answer about the number of belongings, the former display higher SWB. This happens with the number of bathrooms at home (F(1, 5818) = 6.70, p = .01), the number of cars (F(1, 5814) = 19.88, p < 0.0005), the number of books (F(1, 5734) = 15.68, p < 0.0005) and the highest frequency a newspaper is bought at home (everyday) compared with any other answer, the former again displaying higher SWB (F(1, 5746) = 14.59, p < 0.0005).
When we compare children reporting they do not have access to any ICTs (Information and Communication Technologies) with those reporting they do, the former display lower SWB. This happens with having a computer that can be used when needed (F(1, 5878) = 92.103, p < 0.0005), having Internet (F(1, 5863) = 38.65, p < 0.0005) and having a mobile phone (F(1, 5840) = 32.32, p < 0.0005).
Children were also asked about the availability of clothing in good condition to go to school
and whether in the last year they had had at least a week’s holiday away from home. In both cases those responding affirmatively display significantly higher SWB than those who do not (Table 7).
Table 7: Subjective well-being measured with PWI8adp, according availability of different belongings
Computer to be used
when needed The Internet Mobile phone
Cloths in good conditions
Out of home holidays at least
1 week
Yes
Boys 87.78 87.74 87.91 87.56 88.08
Girls 88.78 88.70 88.66 88.53 88.83
Total 88.28 88.22 88.29 88.04 88.46
No
Boys 82.07 84.63 85.20 78.20 84.76
Girls 82.77 85.83 86.99 57.35 86.23
Total 82.40 85.25 86.01 73.57* 85.49
(F(1, 5048) = 93.55, p < 0.0005)
(F(1, 5033) = 40.30, p < 0.0005)
(F(1, 5018) = 33.67, p < 0.0005)
(F(1, 5037) = 55.49, p < 0.0005)
JSRP | 29 JSRP | 11
When we compare children reporting that two adults living at home are in paid employment
with those reporting living with adults in any other situation, the former display higher SWB (F(1, 5765) = 14.76, p < 0.0005). By contrast, when we compare children reporting no adult at home in paid employment with those giving any other answer, the former display higher SWB (F(1, 5765) = 39.45, p < 0.0005).
The demographical context of the school children attend seems to make a difference to children’s SWB. When we compare children attending schools in semi-urban contexts with those living in urban or rural contexts, the former display higher SWB (F(1, 5917) = 29.29, p < 0.0005).
The fact of living in (only) one family household seems to be related to higher levels of SWB. When we compare children living in only one home with those living in two, or in any other kind of living arrangement, the former display higher SWB (F(1, 5827) = 25.179, p < 0.0005). By contrast, when we compare children reporting tolive in care with those reporting to live with their family, the former display lower SWB (F(1, 5624) = 14.21, p < 0.0005).
The type of school they are attending also appears to influence subjective well-being at this age. Those who attend state schools score significantly higher on the PWI (89.27) than those who attend private schools (87.00) or mixed funding schools (88.31) (F(2, 5507) = 8.79, p < 0.0005).
When we compare children that had never missed school in the previous two months due to
illness with any other answer (from never to every day), the former display higher SWB (F(1, 5598) = 50.64, p < 0.0005) (Table 8). While those with the lowest scores are children reporting to have been ill almost every day (N=38), the few children that report they have been ill every day seem to have adapted to their situation and report similar scores to those that had never been ill in the previous two months.
Table 8: Subjective well-being measured with PWI8adp, according how often missed school because of health problems during the last two months
Never missed
Boys 87.97
Girls 89.37
Total 88.66
Very few times
Boys 87.47
Girls 87.19
Total 87.33
Once a week, more or less
Boys 83.98
Girls 84.52
Total 84.26
Almost every day
Boys 71.95
Girls 82.68
Total 77.65*
Almost all days
Boys 89.58
Girls 87.11
Total 88.68** * N=38; ** N=35; (F(4, 4803) = 19.46, p < 0.0005)
When we compare children reporting not to receive any pocket money with those reporting they did, the former display higher SWB (F(1, 5867) = 106.96, p < 0.0005).
Personal Well-Being among Spanish Adolescents 10 | JSRP
Table 6: Subjective well-being measured with PWI8adp, according to parents education
Father’s education Mother’s education
Did not finish primary studies 84.52 83.66
Primary or secondary, or equivalent 87.76 87.33
Upper secondary or equivalent 88.95 88.49
University career 88.61 88.97
(F(3, 3622) = 14.64, p < 0.0005)
(F(3, 3859) = 20.82, p < 0.0005)
When we compare children reporting that one of their parents did not finish primary education with those reporting parents that did, the former display lower SWB. This is the case with both the father (F(1, 5721) = 20.41, p < 0.0005) and the mother (F(1, 5743) = 34.35, p < 0.0005).
Although the questionnaire uses open questions to ask respondents about the current
occupation of each parent, the answers were not easy to categorize, and the results do not
clearly display whether a relationship exists between the subjective well-being of children and their parents’ current occupations.
Material and cultural belongings at home seem to have an influence on the child’s SWB. When we compare those children reporting to have the highest number of belongings at home with children giving any other answer about the number of belongings, the former display higher SWB. This happens with the number of bathrooms at home (F(1, 5818) = 6.70, p = .01), the number of cars (F(1, 5814) = 19.88, p < 0.0005), the number of books (F(1, 5734) = 15.68, p < 0.0005) and the highest frequency a newspaper is bought at home (everyday) compared with any other answer, the former again displaying higher SWB (F(1, 5746) = 14.59, p < 0.0005).
When we compare children reporting they do not have access to any ICTs (Information and Communication Technologies) with those reporting they do, the former display lower SWB. This happens with having a computer that can be used when needed (F(1, 5878) = 92.103, p < 0.0005), having Internet (F(1, 5863) = 38.65, p < 0.0005) and having a mobile phone (F(1, 5840) = 32.32, p < 0.0005).
Children were also asked about the availability of clothing in good condition to go to school
and whether in the last year they had had at least a week’s holiday away from home. In both cases those responding affirmatively display significantly higher SWB than those who do not (Table 7).
Table 7: Subjective well-being measured with PWI8adp, according availability of different belongings
Computer to be used
when needed The Internet Mobile phone
Cloths in good conditions
Out of home holidays at least
1 week
Yes
Boys 87.78 87.74 87.91 87.56 88.08
Girls 88.78 88.70 88.66 88.53 88.83
Total 88.28 88.22 88.29 88.04 88.46
No
Boys 82.07 84.63 85.20 78.20 84.76
Girls 82.77 85.83 86.99 57.35 86.23
Total 82.40 85.25 86.01 73.57* 85.49
(F(1, 5048) = 93.55, p < 0.0005)
(F(1, 5033) = 40.30, p < 0.0005)
(F(1, 5018) = 33.67, p < 0.0005)
(F(1, 5037) = 55.49, p < 0.0005)
(F(1, 4974) = 63.33, p < 0.0005) * N=27.
Table 9:Subjective well-being assessed by means of the PWI8adp, according to available pocket money
I do not have pocket money
Boys 85.55 Girls 86.44 Total 85.96
I get pocket money weekly
Boys 89.62 Girls 90.43 Total 89.99
I get pocket money monthly
Boys 88.74 Girls 89.28 Total 88.97
I get money every time I need it
Boys 88.97 Girls 89.84 Total 89.46
I do not get pocket money, but they buy me anything I want
Boys 87.15 Girls 89.58 Total 88.46 (F(4, 5464) = 25.05, p < 0.0005)
Perceptions and evaluations
Each child’s perceptions may influence how they evaluate their own well-being. This seems to be the case when we compare children that perceive their family as being less or much less wealthy
than the other families in the area they live in with any other perception (equally, more or much more wealthy), the former displaying higher SWB (F(1, 5157) = 284.15, p < 0.0005) (Table 10).
Table 10:Subjective well-being assessed by means of the PWI8adp, according to perceived poverty of own family
Much more wealthy
Boys 89.86 Girls 90.51 Total 90.12
A little more wealthy
Boys 88.26 Girls 87.96 Total 88.13
Equally wealthy
Boys 88.33 Girls 89.50 Total 88.92
Less wealthy
Boys 82.31 Girls 83.51 Total 82.96
Much less wealthy
Boys 74.87 Girls 76.64 Total 75.73 (F(4, 4438) = 74.04, p < 0.0005)
Children’s evaluation of how often they worry about family money shows us that those that never
JSRP | 31 JSRP | 13
Table 11:Subjective well-being assessed by means of the PWI8adp, according to frequency of being worried by the money of the family
Never
Boys 88.89 Girls 91.04 Total 89.74
Sometimes
Boys 86.88 Girls 88.40 Total 87.64
Often
Boys 87.07 Girls 87.31 Total 87.20
Always
Boys 87.43 Girls 87.82 Total 87.64 (F(3, 4850) = 11.26, p < 0.0005)
Results are similar when it comes to other perceptions or evaluations, such as having enough own space at home, or considering there are enough spaces to play and enjoy themselves in the area they live in (Table 11). When we compare children that completely agree they have a space at home of their own with all other answers on a 5-point Likert scale, the former display higher SWB (F(1, 5524) = 454.301, p < 0.0005). When we compare children that completely agree there are enough spaces to play and enjoy themselves in the area they live in with all other answers on a 5-point Likert scale, the former display higher SWB (F(1, 5815) = 484.18, p < 0.0005).
Children who agree that they very much like going to the school they attend also display higher SWB than all other students (Table 12).
Table 12: Subjective well-being assessed by means of the PWI8adp, according to different personal evaluations
I have enough personal space for myself at home
In my neighbourhood or town there are enough places
to play or have a good time
I like going to school
Very much agree
Boys 89.52 90.36 90.76
Girls 90.35 90.99 91.29
Total 89.94 90.67 91.06
Agree
Boys 85.59 86.96 88.58
Girls 86.31 88.20 88.88
Total 85.94 87.61 88.74
Neither agree nor di-sagree
Boys 82.82 84.24 86.80
Girls 83.20 85.67 86.52
Total 83.01 85.03 86.66
Disagree
Boys 79.91 83.62 83.58
Girls 79.04 84.91 83.06
Total 79.46 84.21 83.37
Strongly disagree
Boys 75.86 81.70 82.91
Girls 76.48 81.26 83.08
Total 76.12 81.52 82.96
(F(4, 4735) = 95.89,
p < 0.0005)
(F(4, 4989) = 99.80,
p < 0.0005)
(F(4, 5010) = 88.26,
p < 0.0005)
When we compare children that are very satisfied with their own organization of their time (9 or 10 on a 0-10 scale) with those giving any other evaluation (8 or less on a 0-10 scale), the former display higher SWB. This happens with satisfaction with my use of time (F(1, 5803) = 2771.29,
p < 0.0005) and with satisfaction things I do in my leisure time (F(1, 5810) = 1607.43, p < 0.0005).
Interpersonal relationships and treatment received
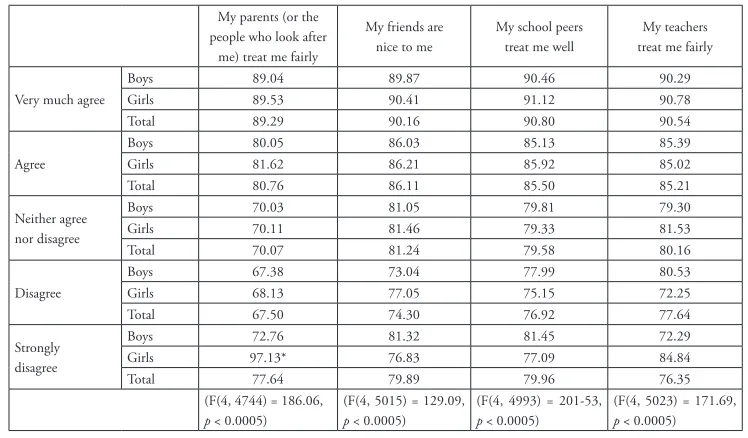
A direct relationship is observed between subjective well-being and the perception of being treated well. Those respondents who perceive that they are treated well display significantly higher scores in their well-being (Table 13). It is worth bearing in mind, however, that a large percentage of those surveyed responded strongly agree or agree to these questions.
When we compare children that completely agree that other people treat them well with all other answers on a 5-point Likert scale, the former display higher SWB. This happens with
my parents treat me well (F(1, 5533) = 704.81, p < 0.0005), my friends are usually nice to me
(F(1, 5847) = 568.27, p < 0.0005), my schoolmates treat me well (F(1, 5819) = 915.44, p < 0.0005)
and my teachers treat me well (F(1, 5852) = 862.75, p < 0.0005).
Table 13: Subjective well-being assessed by means of the PWI8adp, according to how fairly the child feels treated
My parents (or the people who look after
me) treat me fairly
My friends are nice to me
My school peers treat me well
My teachers treat me fairly
Very much agree
Boys 89.04 89.87 90.46 90.29
Girls 89.53 90.41 91.12 90.78
Total 89.29 90.16 90.80 90.54
Agree
Boys 80.05 86.03 85.13 85.39
Girls 81.62 86.21 85.92 85.02
Total 80.76 86.11 85.50 85.21
Neither agree nor disagree
Boys 70.03 81.05 79.81 79.30
Girls 70.11 81.46 79.33 81.53
Total 70.07 81.24 79.58 80.16
Disagree
Boys 67.38 73.04 77.99 80.53
Girls 68.13 77.05 75.15 72.25
Total 67.50 74.30 76.92 77.64
Strongly disagree
Boys 72.76 81.32 81.45 72.29
Girls 97.13* 76.83 77.09 84.84
Total 77.64 79.89 79.96 76.35
(F(4, 4744) = 186.06,
p < 0.0005)
(F(4, 5015) = 129.09,
p < 0.0005)
(F(4, 4993) = 201-53,
p < 0.0005)
(F(4, 5023) = 171.69,
p < 0.0005) * N=1
JSRP | 33 JSRP | 15
Table 14: Subjective well-being assessed by means of the PWI8adp, according to different interpersonal relationships
We have a good time
together in my family I have enough friends
I relate with people in the area where I live
Very much agree
Boys 90.32 89.60 90.46
Girls 91.02 90.45 91.06
Total 90.67 90.02 90.76
Agree
Boys 85.79 85.15 86.99
Girls 85.46 85.88 88.26
Total 85.62 85.51 87.63
Neither agree nor disagree
Boys 79.39 77.30 83.94
Girls 82.23 80.33 84.22
Total 80.79 78.84 84.09
Disagree
Boys 75.47 75.52 80.19
Girls 75.25 73.43 78.02
Total 75.39 74.51 79.14
Strongly disagree
Boys 80.18 75.57 74.54
Girls 77.20 78.29 79.07
Total 79.36 76.83 76.44
(F(4, 4724) = 197.72,
p < 0.0005)
(F(4, 5008) = 179.54,
p < 0.0005)
(F(4, 4951) = 198.70,
p < 0.0005)
When we compare children that are very satisfied with how they are treated when they go to the
doctor (9 or 10 on a 0-10 scale) with those giving any other evaluation (8 or less on a 0-10 scale),
the former display higher SWB (F(1, 5835) = 960.35, p < 0.0005).
Activities
Doing family activities every day makes a big difference to respondents’ well-being, those who do such activities less often scoring significantly lower in their subjective well-being (Table 15).
Table 15:Subjective well-being assessed by means of the PWI8adp, according to the frequency of different activities with your family
Talking together Having fun together Learning together
Every day
Boys 88.78 90.53 90.58
Girls 89.41 92.17 91.91
Total 89.10 91.33 91.25
Most days
Boys 84.65 88.32 88.68
Girls 86.90 88.45 89.27
Total 85.68 88.39 88.98
Once or twice
Boys 80.68 81.41 84.62
Girls 80.88 82.75 84.69
Total 80.77 82.04 84.66
Not at all
Boys 75.96 77.60 79.02
Girls 72.55 75.19 79.26
Total 74.20 76.66 79.13
(F(3, 5015) = 115.40,
p < 0.0005)
(F(3, 4955) = 241.20,
p < 0.0005)
(F(3, 4874) = 211.18,
p < 0.0005)
When we compare children that report doing family activities every day with any other answer (from every day to never), the former display higher SWB, whatever this activity may be: talking
together (F(1, 5843) = 286.55, p < 0.0005), having fun together (F(1, 5780) = 508.74, p < 0.0005)
or learning together (F(1, 5696) = 450.61, p < 0.0005).
A similar finding is observed for activities done with friends, but with one exception: the subjective well-being displayed by those who meet every day to study is no higher than that of those who meet most days. However, if we add the two answers together they display greater subjective well-being than those who meet less frequently (Table 16).
Table 16:Subjective well-being assessed by means of the PWI8adp, according to the frequency of different activities with friends
Talking together Having fun together
Meeting to study (apart from at
school)
Every day
Boys 88.73 89.26 89.26
Girls 89.17 89.97 90.45
Total 88.96 89.63 89.86
Most days
Boys 84.96 85.74 91.03
Girls 85.26 85.84 90.45
Total 85.08 85.78 90.68
Once or twice
Boys 80.11 81.25 88.38
Girls 82.50 84.28 89.04
Total 81.00 82.44 88.76
Not at all
Boys 69.81 73.26 86.10
Girls 74.28 74.17 86.45
Total 71.60 73.65 86.24
(F(3, 5005) = 99.55,
p < 0.0005)
(F(3, 4986) = 124.76,
p < 0.0005)
(F(3, 4895) = 40.44,
p < 0.0005)
JSRP | 35 JSRP | 17
Table 17:Subjective well-being assessed by means of the PWI8adp, according to the frequency of different activities alone or together with other people
Taking classes outside school time on mat-ters you have chosen
Hanging out with friends
Reading for fun (not home-work)
Helping with
house-work Doing home-work
Rarely or never
Boys 84.99 84.02 85.69 84.33 82.40
Girls 85.98 85.79 86.26 83.36 83.13
Total 85.49 84.88 85.92 83.98 82.69
Less than once a week
Boys 85.82 86.26 87.17 85.15 82.11
Girls 87.33 87.88 87.27 86.14 80.11
Total 86.54 87.14 87.22 85.60 81.43
Once or twice a week
Boys 87.58 87.61 88.90 87.62 83.36
Girls 89.07 88.72 89.28 88.50 84.47
Total 88.36 88.18 89.10 88.01 83.73
Everyday or almost everyday
Boys 89.85 89.16 88.31 88.59 88.12
Girls 90.37 89.45 89.42 89.16 88.78
Total 90.08 89.29 89.00 88.91 88.46
(F(3, 4749) = 52.23,
p < 0.0005)
(F(3, 4965) = 33.78,
p < 0.0005)
(F(3, 4912) = 28.80,
p < 0.0005)
(F(3, 4999) = 34.34,
p < 0.0005)
(F(3, 5009) = 43.08,
p < 0.0005)
When we compare children that report doing sports or physical exercise every day or almost every day with any other answer (from every day to never), the former display higher SWB (F(1, 5840) = 141.93, p < 0.0005).
One surprising result is that those respondents who report caring for siblings or other family members every day or almost every day display significantly higher subjective well-being than all others. One possible interpretation is that if this care is understood as voluntary and not an obligation, it signals the existence of a helping or prosocial behaviour, and the practice of prosocial behaviours has been noted by many authors as a factor that increases subjective well-being.
Table 18:Subjective well-being assessed by means of the PWI8adp,
according to the frequency of different activities alone or together with other people (continued)
Watching TV or videos, or listen to music
Playing sports or
doing exercise Using a computer
Taking care of brothers or sisters or other family members
Rarely or never
Boys 83.44 84.32 84.89 85.76
Girls 86.05 83.19 85.48 86.83
Total 84.65 83.59 85.17 86.30
Less than once a week
Boys 85.63 82.22 85.96 85.63
Girls 87.40 85.34 88.19 87.66
Total 86.59 84.31 87.15 86.63
Once or twice a week
Boys 87.50 85.26 87.97 87.00
Girls 89.25 88.06 89.37 88.58
Total 88.38 87.08 88.64 87.75
Everyday or almost everyday
Boys 87.70 88.61 87.81 89.03
Girls 88.28 90.16 88.30 89.40
Total 87.99 89.19 88.06 89.21
(F(3, 5027) = 6.78,
p < 0.0005)
(F(3, 5014) = 48.40,
p < 0.0005)
(F(3, 4992) = 13.21,
p < 0.0005)
(F(3, 4640) = 22.86,
p < 0.0005)
Concerns and emotions
In order to determine whether certain emotions or concerns subjective well-being, we explored the feelings of loneliness, optimism and happiness, the fact of worrying a lot about things and being able to go to school alone. who worry most about things, the more optimistic and those who feel happier, along with those who feel less alone and are able to go to school alone are the ones with higher levels of subjective well-being (Table 19). last item is not easy to interpret, however, as it is unclear whether it r the importance of a sense of
fr response.
Table 19:Subjective well-being assessed by means of the PWI8adp,
accor rent worries and feelings
I worry about things
a lot I feel lonely
I feel positive about my future
I am allowed to go alone from home
to school
I feel happy
Very much agree
Boys 89.07 82.81 90.69 88.14 90.56
Girls 89.82 72.78 91.21 88.45 91.26
Total 89.45 78.90 90.93 88.29 90.91
Agree
Boys 87.35 78.68 87.00 85.91 83.43
Girls 88.03 81.16 89.11 87.81 84.13
Total 87.69 79.85 88.06 86.86 83.78
Neither agree nor disagree
Boys 84.59 82.28 84.89 85.60 74.53
Girls 85.87 83.56 84.27 89.08 77.19
Total 85.21 82.95 84.56 87.43 75.86
Disagree
Boys 84.76 86.08 79.36 86.19 70.05
Girls 86.85 86.96 85.15 88.52 67.80
Total 85.61 86.52 82.25 87.56 69.05
Strongly disagree
Boys 82.40 90.44 85.19 87.18 72.45
Girls 83.56 91.46 87.00 88.86 68.50
Total 82.81 90.95 86.01 88.16 70.95
(F(4, 4993) = 28.31,
p < 0.0005)
(F(4, 4914) = 197.56,
p < 0.0005)
(F(4, 4628) = 89.58,
p < 0.0005)
(F(4, 4893) = 3.51,
p = .007)
(F(4, 4991) = 409.55,
p < 0.0005)
Values and aspirations
JSRP | 37 JSRP | 19
Table 20: Rotated matrix of the PCA of 11 qualities aspired to be valued for, when becoming 21 years-old
Component
Materialism Relational Knowledge
money 0.891
power 0.875
image 0.694 0.149 0.222
family 0.492 0.267 0.178
niceness 0.747
kindness 0.726 0.244
relationships with people 0.224 0.695
personality 0.692 0.186
working capacity 0.293 0.141 0.763
knowledges 0.258 0.143 0.762
solidarity 0.245 0.659
Extraction Method: Principal Component Analysis. Rotation Method: Varimax with Kaiser Normalization.
Rotation converged in 5 iterations.
Each of these components correlates significantly and positively with the PWI8adp in all three cases, but only very weakly with the materialistic component, and more notably with the relational component (Table 21). The results follow a similar trend if the correlations are calculated using the other two psychometric scales, the SLSS5 and OLS.
Table 21: Correlations between components of the PCA of the values aspired to by students, and the three psychometric scales
Component Materialism Relational Knowledge
Relational -0.003 1
Knowledge -0.009 -0.009 1
PWI8adp 0.105** 0.346** 0.223**
SLSS5 0.026 0.208** 0.144**
OLS 0.075** 0.212** 0.165**
** Correlation is significant at the 0.01 level (2-tailed).
Children who report high aspirations for relational values (9 or 10 on a 0-10 scale) and low aspirations for materialistic values (8 or less on a 0-10 scale) display significantly higher SWB than those reporting high aspirations for materialistic values and low aspirations for relational values (F(1, 2773) = 59.59, p < 0.0005). However, those children having very high aspirations for both relational and materialistic values display the highest scores in SWB (Table 22).
Personal Well-Being among Spanish Adolescents 18 | JSRP
Concerns and emotions
In order to determine whether certain emotions or concerns influence subjective well-being, we explored the feelings of loneliness, optimism and happiness, the fact of worrying a lot about things and being able to go to school alone. Those who worry most about things, the more optimistic and those who feel happier, along with those who feel less alone and are able to go to school alone are the ones with higher levels of subjective well-being (Table 19). The last item is not easy to interpret, however, as it is unclear whether it reflects the importance of a sense of freedom or that of confidence, while distance to school also clearly influences the response.
Table 19: Subjective well-being assessed by means of the PWI8adp, according different worries and feelings
I worry about things
a lot I feel lonely
I feel positive about my future
I am allowed to go alone from home
to school
I feel happy
Very much agree
Boys 89.07 82.81 90.69 88.14 90.56
Girls 89.82 72.78 91.21 88.45 91.26
Total 89.45 78.90 90.93 88.29 90.91
Agree
Boys 87.35 78.68 87.00 85.91 83.43
Girls 88.03 81.16 89.11 87.81 84.13
Total 87.69 79.85 88.06 86.86 83.78
Neither agree nor disagree
Boys 84.59 82.28 84.89 85.60 74.53
Girls 85.87 83.56 84.27 89.08 77.19
Total 85.21 82.95 84.56 87.43 75.86
Disagree
Boys 84.76 86.08 79.36 86.19 70.05
Girls 86.85 86.96 85.15 88.52 67.80
Total 85.61 86.52 82.25 87.56 69.05
Strongly disagree
Boys 82.40 90.44 85.19 87.18 72.45
Girls 83.56 91.46 87.00 88.86 68.50
Total 82.81 90.95 86.01 88.16 70.95
(F(4, 4993) = 28.31, p < 0.0005)
(F(4, 4914) = 197.56, p < 0.0005)
(F(4, 4628) = 89.58, p < 0.0005)
(F(4, 4893) = 3.51, p = .007)
(F(4, 4991) = 409.55, p < 0.0005)
Values and aspirations
The responses to the 11 values or qualities explored relating to how respondents wish to be acknowledged by others when they are 21 were subjected to a Principal Component Analysis (PCA), which identified three components accounting for 59.38% of the variance: one component relating to materialistic values , one relating to relational values , and another relating to academic or learning aspects (Table 20). These components are similar to those identified in previous research conducted on children of this age (Casas et al., 2007). However, in this sample it is notable that the value “family” weights much more on the materialistic component than on the relational.
Table 22:Subjective well-being assessed by means of the PWI8adp, according observed combination of materialistic and relational values
High Materialistic values + Low Relational values
Boys 82.99 Girls 84.81 Total 83.64
Low Materialistic values + High Relational values
Boys 89.12 Girls 89.63 Total 89.40
High Materialistic values + High Relational va-lues
Boys 91.50 Girls 91.84 Total 91.66 (F(2, 3522) = 61.90, p < 0.0005)
Children and their rights
Respondents who have heard of the Convention on the Rights of the Child display significantly higher levels of subjective well-being than those who have not or than those who do not know. Children that answer yes when asked whether they have been told about it display significantly higher SWB than those that answer no (F(1, 5710) = 20.32, p < 0.0005) (Table 23).
Table 23: Subjective well-being assessed by means of the PWI8adp,
according to whether they have listened about a document named Children’s Rights Convention
Yes No I do not know
Boys 88.22 86.61 87.51 Girls 89.22 87.63 88.14 Total 88.72 87.11 87.83 (F(2, 4907) = 12.05, p < 0.0005)
Those who report that they have been told about the rights of children and adolescents display higher levels of subjective well-being than those reporting they have not. This level of well-being decreases progressively according to how much they have been told about rights (Table 24). When we compare children that completely agree that they have been told that children have rights with all other answers on a 5-point Likert scale, the former display higher SWB. This happens when they have been told about children’s rights in their family (F(1, 5542) = 420.38, p < 0.0005), at
school (F(1, 5464) = 329.36, p < 0.0005) or by others (F(1, 5258) = 168.79, p < 0.0005).
JSRP | 39 JSRP | 21
Table 24:Subjective well-being assessed by means of the PWI8adp, according to their information about children’s and adolescents’ rights
All children have rights
I have heard about the children’s rights convention in my family
I have heard about the children’s rights convention at my school
I have heard about the chil-dren’s rights convention from other people
Very much agree
Boys 89.22 90.23 89.62 90.09
Girls 89.51 91.27 90.34 90.04
Total 89.37 90.73 89.98 90.07
Agree
Boys 84.83 87.63 86.76 88.41
Girls 86.01 88.51 86.91 89.19
Total 85.36 88.08 86.84 88.82
Neither agree nor disagree
Boys 83.42 85.25 85.93 86.66
Girls 85.83 86.61 86.31 88.01
Total 84.66 85.96 86.12 87.35
Disagree
Boys 80.35 82.96 82.28 85.60
Girls 83.38 83.10 84.00 86.42
Total 81.83 83.03 83.19 86.04
Strongly disagree
Boys 82.22 83.15 83.29 85.08
Girls 86.19 81.87 86.56 86.16
Total 84.04 82.59 84.54 85.53
(F(4, 4908) = 54.88,
p < 0.0005)
(F(4, 4749) = 89.88,
p < 0.0005)
(F(4, 4671) = 50.91,
p < 0.0005)
(F(4, 4490) = 29.79,
p < 0.0005)
Participation
Children’s participation in family and social life is an area in which social awareness has gradually increased in most countries since the Convention identified it as a right, and the Children’s Rights Committee (the body responsible for monitoring the Convention on the Rights of the Child) has placed special emphasis on ensuring this is respected. In this study, we used three indicators for participation: participation in decisions taken at home, the local City Council consulting children’s opinions, and children’s teachers at school listening to them and taking their views into account.
We observe that boys and girls who participate and are taken into account in different contexts of their lives display higher levels of subjective being. As participation decreases, so does well-being, with the exception of when the City Council asks their opinion: those who strongly disagree
and those who disagree display the same levels of SWB (Table 25).
When we compare children that completely agree that they are listened to with all other answers on a 5-point Likert scale, the former display higher SWB. This happens with participating in
decisions at home (F(1, 5404) = 311.84, p < 0.0005), having the City Council consult theiropinions
on things that are of importance to them (F(1, 5155) = 119.81, p < 0.0005) or being listened to and
taken into account by their teachers (F(1, 5839) = 720.87, p < 0.0005).
When we compare children that disagree or completely disagree agree that they can participate in decisions taken at home with all other answers on a 5-point Likert scale, the former display lower SWB (F(1, 5404) = 332.98, p < 0.0005).
Table 25:Subjective well-being assessed by means of the PWI8adp,
according to how much they report to feel they par rent environments
I am allowed to participate in decisions taken at home
-dren and young people their opinion about things that are important to them
My teachers listen to me and take what I say into account
Very much agree
Boys 90.18 89.77 90.98
Girls 90.87 89.76 91.05
Total 90.54 89.76 91.02
Agree
Boys 88.12 88.02 86.39
Girls 89.24 89.17 87.36
Total 88.71 88.60 86.87
Neither agree nor disagree
Boys 86.30 87.22 82.04
Girls 86.02 87.79 82.02
Total 86.16 87.51 82.03
Disagree
Boys 81.33 83.98 77.72
Girls 79.22 87.06 82.89
Total 80.52 85.58 80.14
Strongly disagree
Boys 78.11 85.47 76.90
Girls 74.77 85.77 80.35
Total 77.01 85.59 77.75
(F(4, 4626) = 106.42,
p < 0.0005)
(F(4, 4434) = 26.40,
p < 0.0005)
(F(4, 5012) = 143.83,
p < 0.0005)
Safety from the perspective of children
Feeling safe is another aspect proven to be relevant for children to display high levels of well-being when they evaluate their lives. In this study we used three indicators for safety: feeling safe at home, walking the streets of their neighbourhood or town.
Not only do those who feel safer display decidedly higher levels of well-being, but well-being also decreases extremely quickly as safety decreases. exception is security at home, which increases a little among those who disagree compared with those who neither agree nor disagree
(Table 26).
When we compare children that completely agree they feel safe with all other answers on a 5-point Likert scale, the former display higher SWB. happens with safety at home (F(1,5546)=578.97, p<0.0005), walking the streets of their neighbourhood or town (F(1,5782) = 509.12,
p < 0.0005), and at school (F(1,5827) = 854.35, p < 0.0005).
When we compare children that completely disagree they feel safe with all other answers on a 5-point Likert scale, the former display lower SWB. happens with safety at home (F(1, 5546) = 30.28, p < 0.0005), walking the streets of their neighbourhood or town (F(1, 5782) = 297.77,
JSRP | 41 JSRP | 23
Table 26:Subjective well-being assessed by means of the PWI8adp, according to the feelings of safety in different environments
I feel safe at home I feel safe when I walk
aro-und in the area I live in I feel safe at school
Very much agree
Boys 88.99 90.24 90.52
Girls 89.84 91.11 91.00
Total 89.42 90.64 90.77
Agree
Boys 83.12 87.06 86.35
Girls 83.34 88.44 86.42
Total 83.23 87.78 86.38
Neither agree nor disagree
Boys 75.36 84.07 80.93
Girls 72.99 85.75 82.24
Total 74.33 85.00 81.51
Disagree
Boys 78.39 81.98 77.67
Girls 77.80 82.70 78.09
Total 78.17 82.38 77.86
Strongly disagree
Boys 60.93 78.56 73.59
Girls 73.75 80.33 72.69
Total 63.07 79.36 73.33
(F(4, 4753) = 135.63,
p < 0.0005)
(F(4, 4952) = 118.65,
p < 0.0005)
(F(4, 5001) = 204.69,
p < 0.0005)
Changing contexts in the lives of children
Significant changes in children’s lives, especially those occurring outside their own free choice, often put them at emotional risk. There is an abundance of research to show how subjective well-being decreases with major or unexpected change. In this study, we have used 5 different types of change: the flat or house you live in, city or town, school, country for over a month, and one of the parents you live with.
In all cases except for change of school, those who have not experienced any change display significantly higher levels of subjective well-being than those who have (Table 27). Change of school, which a majority of respondents have experienced due to the start of the new school year and moving from primary at secondary education, is the exception to the rule, as no significant differences are observed in the SWB of those have changed and those have not. It is possible that most classmates experiencing the same change acts as a protective element against the stress that such change can cause.
It is observed that the SWB of those who have changed parents or person they live with has suffered the greatest decrease of all the changes considered here.