Angular Spread Quantification of Multi-Antenna
Vehicular Radio Communication Channels
Abrar Ahmed
*, Syed Junaid Nawaz
*, Sardar Muhammad Gulfam
*, Shurjeel Wyne
*,
Mohammad N. Patwary
†, and Haris Pervaiz
§.
*
Department of Electrical Engineering, COMSATS University Islamabad, Islamabad, Pakistan.
†
School of Computing and Digital Technology, Birmingham City University, Birmingham, UK.
§5G Innovation Centre, Faculty of Engineering and Physical Sciences, University of Surrey, UK.
abrar [email protected],
[email protected],
sardar [email protected],
[email protected],
[email protected], and
[email protected]
Abstract—The deployment of multi-antenna systems with software defined reconfigurable beam patterns can potentially benefit vehicle-to-vehicle (V2V) communications by increasing the channel coherence time. This in turn necessitates an accurate characterization and modeling of the angular statistics of ve-hicular radio propagation environments. This work proposes an improved three-dimensional (3-D) spatial description of vehicular propagation environments and derives the closed-form analytical expressions for the joint and marginal statistics of the 3-D angle-of-arrival (AoA) and angle-of-departure (AoD). Then, based on the proposed geometric channel model, the AoA and AoD angular spreads are quantified in terms of the joint angular spread, elevational constriction, and the azimuthal constriction. These considered quantifiers are shown to be of high significance in quantification of angular spread in V2V radio propagation environments. The impact of various physical parameters on the angular spread is also investigated. These parameters include the link-distance, scattering volume, and the number of scatterers along the azimuth and elevation axes. The derived analytical expressions are also validated by simulations.
Keywords: Angular spread, vehicle-to-vehicle, directional an-tennas, geometric modeling
I. INTRODUCTION
The deployment of directional antennas with software de-fined reconfigurable beam patterns in vehicle-to-vehicle (V2V) communication systems has a strong potential in enhancing the link capacity [1]. V2V communications is an emerging paradigm of communication networks with applications in in-telligent transport systems (ITS) and urban traffic management [2, 3]. The V2V radio propagation channels are different in many aspects from the widely studied land mobile cellular communication channels [4, 5]. The mobility at both commu-nicating nodes and a typically low altitude of the antennas surrounded by rich scattering makes the V2V communication channels highly time-variant. The large angular spread in such mobility scenarios imposes a high Doppler spread, which translates to a fast time-variability of the channel and a reduced channel coherence time. However, highly directional antennas can be deployed at both ends of the link to potentially reduce the spatial spread and thereby increase the channel coherence time. Designing of such software controlled reconfigurable
directional antenna beams necessitate an accurate spatial de-scription of the V2V radio propagation environments. Such modeling of the propagation environment is also of vital importance in characterizing the channel fading statistics.
Dual annular strip model is proposed in [16], where analytical expressions for the probability distribution function (PDF) of the Angle-of-Arrival (AoA) in V2V communication scenarios is derived. In [5], a geometric channel model for V2V massive-MIMO communications is presented by considering the PDF of both azimuth and elevation AoA as Gaussian. In [4, 7], a more realistic description of the scattering environments is pre-sented for the characterization of angular statistics in massive-MIMO vehicular radio communication environments. Various other studies are also available in the literature which aim at defining the scattering volumes as realistic yet simple enough to keep the advantages of the model’s tunability and generality, see e.g., [17–19]. In this quest for an accurate, tuneable, and generalized 3-D spatial description of scattering volumes in the vicinity of communication nodes, there is a significant scope to conduct intensive research work. Such studies can be of high significance for characterization of the Doppler spectrum, second-order fading statistics, and optimal beam designing in vehicular radio communication environments.
Quantification of the joint 3-D angular spread at transmitter and receiver side is of vital importance in enabling the employment of massive-MIMO in V2V communication sys-tems. In [20], spatial spread quantifiers for vehicle-to-vehicle radio propagation environments are proposed, however the presented analysis is conducted for over simplified geometry of the scattering clusters. In this paper, a geometry based generalized and tunable 3-D stochastic model is presented for V2V communication environments. Analytical expressions for the joint and marginal 3-D description of AoA and angle-of-departure (AoD) are derived. A thorough analysis of the impact of various physical channel parameters on spatial statistics of vehicular propagation environments is conducted. Analysis is further extended from plain angular statistics to the quantification of angular spread in azimuth and elevation planes for both transmitting and receiving sides of the link.
The remainder of this paper is organized as follows. In Section II, the proposed channel model is presented. Section III provides the derivations of the analytical expressions for the joint and marginal PDFs of AoA and AoD and the definitions of the considered angular spread quantifiers is also presented. In Section IV, some results and discussion along with the validation of the analysis is provided. Finally, the conclusion is presented in Section V.
II. GEOMETRY OFSCATTERINGCLUSTERS
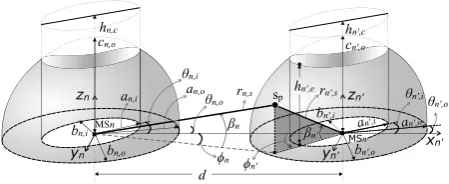
This section presents the description of proposed 3-D geo-metrically based V2V channel model. The effective scattering region is defined as confined within the non overlapping region of an inner-bounding elliptical-cylindric and outer-bounding ellipsoidal shaped volumes centered at the position of each mobile station (MS). The scattering objects are assumed to be uniformly distributed within the defined scattering volumes located around each vehicular node. The considered geometric composition of the scattering volumes in illustrated in Fig. 1. Both the vehicular nodes are separated by a horizontal distance d. The outer and inner boundaries of the scattering
Fig. 1. Geometry of 3-D scattering regions in V2V communications.
clusters around the vehicular nodes are modeled as ellipsoidal and elliptic-cylinder, respectively. These geometric shapes modeling the boundaries of the scattering volumes are labeled asEn,k, where the subscriptskandnrepresents the scattering
region’s boundaryk(inner or outer) aroundnthMS. The index ktakes the label ask=oandk=ito represent the outer and inner boundary, respectively. The outer bounding ellipsoids around each MS (e.g., MSn) is modeled as independently scalable along x-, y-, and z-axis with the parameters an,o,
bn,o, and cn,o, respectively. The outer and inner boundary
of the scattering volumes around a MSn/n0 is modeled as rotatable in x-y plane with an angle θn/n0,i/o. In typical
outdoor vehicular radio propagation scenarios, the arrival of signals from the elevation angles around 90◦ is unlikely, this is because of the absence of any scatterers in the directions right above the MSs, this motivates the modeling of inner boundary of scattering volumes as hollow cylindric region. Major and minor axis of the elliptical cylinders are represented by an,i and bn,i, respectively. The inner bounding cylinders
are taken of height hn,c to be more than minor axis of
outer bounding ellipsoid cn,o. The inner elliptical-cylindric
shaped boundary is also modeled as rotatable in azimuth plane with angleθn,i. The scattering volumes in the proposed
system can effectively adapt to model various communication environments and scenarios with the provided seven degrees-of-freedom (θn,o, and θn,i,an,i, bn,i, an,o, bn,o, cn,o.). This
flexibility in the shape of scattering volumes can also help in studying the channel characteristics in various dynamic scenarios, including V2V communications. The position of a certain MS can be represented by (xn, yn, zn) in the Cartesian
coordinate system. The outer bounding ellipsoids around MSn can thus be defined as,
((xn,k−xn) cosθn,k+ (yn,k−yn) sinθn,k)2
a2
n,k
+(zn,k−zn)
2
c2
n,k
+(−(xn,k−xn) sinθn,k+ (yn,k−yn) cosθn,k)
2
b2
n,k
= 1. (1)
The spatial position of MSn and MSn0 at a temporal snap is taken as (0,0,0) and (d,0,0), respectively. Following are some important relationships, which are later used in the applied transformations: xn = rncosβncosφn, yn =
rncosβnsinφn, zn = rnsinβn, xn0 = xn+d, yn0 = yn,
andzn0 =zn. The azimuth and elevation AoA is represented
byφnandβn, respectively. The volumeVnof scattering region
cylinder Vn,i from the volume of outer ellipsoid Vn,o, i.e., Vn=Vn,o−Vn,i.Vn is obtained as,
Vn=23πan,obn,ocn,o−2 Z γm
0
cγn,o aγn,o
Z ηu+
η−l q
aγn,o2−η2dη dγ, (2)
where η represents the dimension of an arbitrary horizontal plane along x-axis, in parallel to y-z plane. The parameter γ represents the length of scattering region along y-axis, parallel to the x-z plane. Closed-form solution for the volume of a single scattering cluster can be obtained, as derived in [19] for similar geometry in fixed-to-vehicle communication context. Total volume of illuminated scattering region can thus be represented as Ve =Vn+Vn0. As illustrated in Fig.
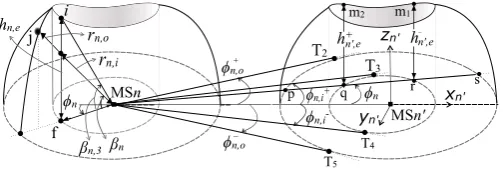
2, the important azimuth threshold angles, separating among different regions of the scattering volumes with different geometric compositions, can be derived as,
φ±n,k= arctan (a2
n,k−b
2
n,k) cosθn,ksinθn,k a2
n,kcos2θn,k+b2n,ksin
2
θn,k−d2
±
d2(a2
n,ksin
2θ
n,k+b2n,kcos
2θ
n,k)−a2n,kb
2
n,k
1 2
.
(3)
An azimuth threshold angle represent a particular azimuth direction of observation in which an extended line from MSn draws a tangent point at the outer or inner boundary of far-end (i.e., MSn0) scattering volume, see Fig. 2. By settingk =
i and k = o in (3), the azimuth threshold angles φ±n,i and φ±n,ocan be drawn, respectively. Along the elevation axis, the effective portion of a scattering volume is divided into different angular partitions. The important elevation threshold angles to classify among these partitions are represented byβn,1,βn,2, βn,3 andβn,o, as shown in Fig. 3. Simplified expressions of
the aforementioned angles is given below,
β−n,1 β+n,2
= arctan h
∓
n0,e
ρ∓φn,i
!
. (4)
Observing in a specific direction (φn andβn), the
parame-tersh±n0,e of inner cylinder can be expressed as,
h±n0,e=
cn0,o
an0,obn0,o
1 2(a
2
n0,o(2b2n0,o−d2−ρ±φn,i 2
)
−b2
n0,o(d2+ρ±φn,i 2
) + (a2
n0,o−b2n0,o) cos(2(α−θn0,o))
×(d2+ρ±
φn,i
2
−2dρ±φn,icosφn))
12
,
(5)
where,
α=π−arcsin
ρ±φn,isinφn
q
d2+ρ±
φn,i
2
−2dρcosφn
. (6)
When observing from MSn in a given direction, the height of local-end cylindric wall is shown by hn,e, while
the maximum elevation angle formed with the line is βn,3,
see Fig. 3. These parameters can be expressed as,
hn,e=cn,o r
4a4
n,ob4n,o−r2n,icos2βn(gn,o)2 2a2
n,ob2n,o(gn,o) , (7)
Fig. 2. Important azimuth threshold angles of the proposed scattering model.
and
βn,3= arctan
h
n,e
rn,icosβn
, (8)
where,
gn,o=a2n,o+b
2
n,o+ (−a
2
n,o+b
2
n,o) cos 2(θn,o−φn). (9)
Another important threshold angle indicated in Fig. 3 is βn,o. It represents the elevation angle made with the line drawn
from the MSn at a particular azimuth angle to the tangent point formed at the outer bounding ellipsoid around the MSn0 (far-end), which can be represented by,
βn,o=
arctan
2cφ,n q
(ρ+ φn,o+ρ
−
φn,o) 2−4a2
φ,n
;φ−n,o≤φn≤φ+n,o
0 ; otherwise.
(10)
In a given particular direction of observation from MSn, the parametersrn,i andrn,o represent the distance from MSnto
the nearest (at inner surface) and farthest (at outer surface) of the scattering cluster around MSn, respectively. These distances can be expressed in simplified form as,
r
n,i=
cos1βnr
2a2
n,ib
2
n,i
a2
n,i+b2n,i+(b2n,i−a2n,i) cos 2(θn,i−φn)
,
(11)rn,o=
a2
n,ob
2
n,osin
2β
n+a2n,osin
2(θ
n,o−φn)
+c2
n,ocos2βn(b2n,ocos2(θn,o−φn))
−1 2a
n,obn,ocn,o
(12)
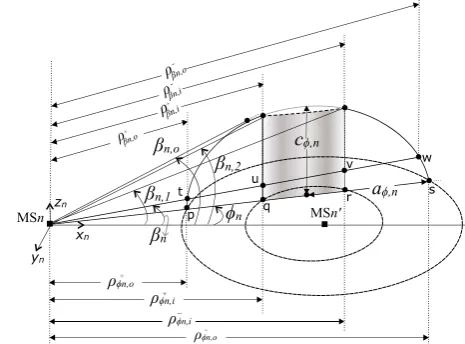
For the elevation angle fixed at βn = 0◦, the horizontal
distances from MSn, at a particular azimuth angle φn, to the
intersection pointspandswith outer bounding ellipsoid andq
andrwith inner cylindric boundary are represented byρ±φ n,k,
see Fig. 3, which can be expressed as,
ρ+
φn,k
ρ−φ
n,k
)
= −1
a2
n,k+b
2
n,k+ (b
2
n,k−a
2
n,k) cos(2(θn,k−φn)) n
2d(b2
n,kcosθn,k
×cos(θn,k−φn) +a2n,ksinθn,ksin(θn,k−φn))±
2a2
n,kb2n,kcos2φn(a2n,k
+b2
n,k−d2+ (b2n,k−a2n,k) cos(2(θn,k−φn)) +d2cos(2φn)) 12o
,
(13) The simplification parameters, can be defined as,
cφ,n=−
cn0,o
an0,obn0,o
×qa2
n0,ob2n0,o−a2n0,ox2n,esin
2
θn,e−b2n0,ox2n,ecos2θn,e,
aφ,n=
1 (a2
n0,o+b2n0,o+ (b2n0,o−a2n0,o) cos 2(θn0,o−φn)) cosφn ×
−2a2
n0,ob2n0,ocos2φn(d2−a2n0,o−b2n0,o
+(a2
n0,o−b2n0,o) cos 2(θn0,o−φn)−d2cos 2φn)
12
,
(15)
xn,e=
q
d2+ (a
φ,n+ρ+φn,o)2−2d(aφ,n+ρ+φn,o) cosφn, (16)
θn,e=
(
π−(θn,r+θn,o) ; φn<0◦,
θn,r+θn,o ; otherwise,
(17)
and
θn,r=
arcsin aφ,n+ρ
+
φn,o
xn,ecscφn !
; φn6= 0,
0 ; φn= 0◦.
. (18)
In a particular direction of observation from MSn, the distances to the intersection points t, w andu, v formed at inner and outer boundary of the far-end cluster is represented byρ±βn,o andρ±βn,i. These parameters can be expressed as,
ρ+βn,o ρ−βn,o
= secβn
1
a2
φ,n+c2φ,n+ (cφ,n2 −a2φ,n) cos(2βn)
(aφ,n+ρ+φn,o)− 2a
2
φ,nsinβn((aφ,n+ρ+φn,o) sinβn)
±(2(a2
φ,nc
2
φ,ncos
2β
n(a2φ,n+c
2
φ,n−(aφ,n+ρ+φn,o)
2
+(c2
φ,n−a2φ,n+ (aφ,n+ρ+φn,o)2) cos(2βn))))
1 2
,
(19)
ρ±β n,i =ρ
±
φn,isecβn. (20)
When observing from a certain vehicular node (e.g., MSn) the effective scattering region can be partitioned into four angular partitions based on the geometric composition of the regions. Using the defined threshold azimuth and elevation angles, the angular partitions can be defined as,
φ−n,i< φn< φ+n,i and 0≤βn≤βn,1 →Pn,1, (21)
φ−n,i< φn< φ+n,i and βn,1≤βn≤βn,2 →Pn,2, (22)
φ+n,i< φn< φ+n,o or φ−n,o< φn< φ−n,i
and 0≤βn≤βn,o
→Pn,3, (23)
φ+
n,o< φn< φ−n,o and βn,o≤βn≤βn,3 →Pn,4. (24)
III. SPATIALSPREADSTATISTICS
In this section, PDFs of AoD and AoA in azimuthal and elevational planes have been presented. Considering a single bounce scenario, the arrival of signal at MSn from a given direction of arrival (φn, βn) is only likely, if the line drawn
in this direction intersects with the line drawn from the far-end MSn0 in a given direction of departure (φ
n0, βn0) and the
intersection point lies within the defined effective scattering region. This proposition helps in defining the 3-D joint PDF
Fig. 3. Cross-section view of the scattering clusters.
of AoA and AoD as given below,
f(φn, βn, φn0, βn0) =
1 Ve
;rn,i≤
dsinφn0
sin(φn0−φn) cosβn
≤rn,o,
or
rn0,i≤ dsinφn
sin(φn0−φn) cosβn0
≤rn0,o,
j1
Ve
;φn=βn=φn0=βn0= 0o,
j2
Ve
;φn=βn=βn0= 0o, φn0= 180o,
j3
Ve
;φn=φn0= 180o, βn=βn0= 0o,
0 ; otherwise,
(25) where the simplification parameters can be expressed as,j1= ρ−βn,o−ρ−βn,i,j2=rn,o−rn,i+ρ+βn,i−ρ
+
βn,o,j3=rn,o−rn,i.
By integrating the density functionf(φn, βn, φn0, βn0)over an
appropriate set of parameters for their defined range, closed-from expression for the joint PDF of AoA observed at MSn can be expressed as,
p(φn, βn) =
{(rn,o−rn,i) + (ρ−βn,o−ρ
−
βn,i) + (ρ
+
βn,i−ρ
+
βn,o)}
3cosβ
n
3Ve
;Pn,1,
{(rn,o−rn,i) + (ρ+βn,i−ρ
+
βn,o)}
3cosβ
n
3Ve
;Pn,2,
{(rn,o−rn,i) + (ρ−βn,o−ρ
+
βn,o)}
3cosβ
n
3Ve
;Pn,3,
(rn,o−rn,i)3cosβn 3Ve
;Pn,4. (26) Marginal PDF of azimuth and elevation AoA and AoD can be obtained by integrating (26) over appropriate parameters, e.g., the marginal PDF of azimuth AoA can be obtained as, p(φn) =
Rπ/2
0 p(φn, βn)dβn. The joint beam pattern of
transmitter and receiver side antennas can be represented by G(φn, βn, φn0, βn0). Therefore, the joint angular power
spectrum can be given as,
Since the antennas of transmitter and receiver are indepen-dent of each other, so the joint beam pattern can be expressed as G(φn, βn, φn0, βn0) = G(φn, βn)G(φn0, βn0). The beam
pattern can be assumed as Gaussian shaped [21], for the purpose of achieving mathematical simplicity. The Gaussian shaped antenna gain function for MSncan be written as,
G(φn, βn) = exp −
(φn−µφn) 2
σ2
φn
−(βn−µβn) 2
σ2
βn !
, (28)
where µφn and µβn represent the angle at which the peak
(mean) of the beam is pointed in azimuth and elevation planes, respectively; while σ2
φn andσ 2
βn represent the width
(standard deviation) of the beams in azimuth and elevation planes, respectively. This multiplicative factor of antennas directional gain overshadows the impact of various important fine details in the angular statistics caused by various physical channel parameters. Since the focus of this paper is mainly on investigating the behavior of transformation in shape, size, and orientation of the scattering clusters on the joint 3-D spatial spread, therefore the gain function is assumed as unity in all the directions, i.e., G(φn, βn) = 1. For quantification
of energy dispersion in 2-D (angular) domain, a theory of multipath shape factors is proposed in [22]. This theory is extended in [20] for quantification of spatial spread in 3-D for fixed-to-vehicle and 6-D (i.e., 3-D AoA and 3-D AoD) for V2V channels. Among the proposed quantifiers for spatial spread in V2V propagation environments, the notable are joint angular spread (Υ), azimuthal constriction (ξ), and elevational constriction (ζ), which are defined as,
Υn=
r
1−S
0,0 1,0 2
+|S11,,00|2
S00,,002 , Υn0= r
1−S
0,0 0,1 2
+|S00,,11|2
S00,,002 , (29)
ξn= 3 2S
0,0 2,0S
0,0 0,0−
S10,,00 2
−1 2|S
1,0 1,0|2
S00,,002−S10,,002+|S11,,00|2
, ξn0=
3 2S
0,0 0,2S
0,0 0,0−
S01,,00 2
−1 2|S
1,0 1,0|2
S00,,002−S10,,002+|S11,,00|2
,
(30)
ζ
n=
|S22,,00S00,,00−S11,,002|
S00,,00 2
−S10,,00 2
+|S11,,00|2
, ζ
n0=
|S00,,22S00,,00−S11,,002|
S00,,00 2
−S10,,00 2
+|S11,,00|2
.
(31) The joint angular spread, ranges from 0 to 1; with the value 0 representing the energy concentrated in one physi-cal direction, whereas 1 showing no clear bias. Elevational constriction ranges from −0.5 to 1, with the value of −0.5
indicating the arrival of signals concentrated around single elevational cone and 1 representing the arrival of signals from exactly opposite elevational angle at the same azimuthal angle. The azimuthal constriction ranges from 0 to 1, with the value of 1 representing the signal arriving from two different physical paths from same elevation angle and its value0represent no clear bias. The important double spherical harmonic coefficientsSs,lm,p can be computed as,
Sm,ps,l = π Z
−π
π 2
Z
0
π Z
−π
π 2
Z
0
p(φn, βn, φn0, βn0)
×Ws,lm,p∗cosβncosβn0dβndβn0dφndφn0.
(32)
The simplification parameters Ws,lm,p are given as below,
W00,,00= 1, W10,,10= sinβnsinβn0, W10,,00= sinβn,
W00,,10= sinβn0, W10,,11= cosβn0ejφn0sinβn, W11,,10= cosβnejφnsinβn0, W11,,11= cosβncosβn0ej(φn+φn0),
W00,,22= cos2β
n0ej2φn0, W2,0
2,0 = cos2βnej2φn,
W11,,00= cosβnejφn, W00,,11= cosβn0ejφn0, W21,,00= sin 2βnejφn,
W20,,00= 2 sin2βn−
2
3, W
0,0 0,2 = 2 sin
2β
n0− 2 3, W00,,21= sin 2βn0ejφn0, W1,−1
1,1 = cosβncosβn0ej(φn−φn0).
IV. RESULTS ANDDISCUSSION
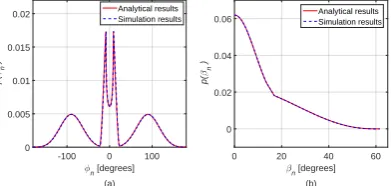
A comprehensive analysis on obtained analytical results of spatial statistics for V2V radio communication channels is presented. Validation of proposed geometric model is achieved by comparing the with computer simulation results. In the pre-defined regions around both communication vehicular nodes the scattering clusters are created. Scatterers are distributed uniformly in these clusters. Adopting the methodology pro-posed in [19], the PDFs of the azimuthal and elevational AoA calculated for simulation results. A very good match between the simulation and analytical results can be observed in Fig. 4; these results are obtained for 100 uniformly distributed scattering objects in each cluster and after 104 Monte Carlo
runs. This good match demonstrates the validity of derived analytical expressions.
The results obtained for the PDF of azimuth and elevation AoA are taken by considering the MSn and MSn0 as the receiver and transmitter, respectively. The impact of horizontal link distance d, MSn inner cylinder volume in terms ofan,i
andbn,i), and ratio between vertical dimensions of scattering
volumes around MSn and MSn0, on marginal PDF of the azimuthal and elevational AoA is plotted in Fig. 5 and 6, respectively. Effect of horizontal link distance between the communication nodes on marginal PDF of the azimuthal and elevational AoA is shown in Fig. 5(a) and 6(a), respec-tively. Other parameters of MSn are taken as an,i = 45m,
bn,i = 25m, an,o = 75m, bn,o = 65m, cn,o = 65m, and
θn,i =θn,o = 0o. The parameter of MSn0 are an0,i = 35m,
bn0,i = 15m, an0,o = 65m, bn0,o = 55m, cn0,o = 55m, and
θn0,i = θn0,o = 0o. In Fig. 5(a) as the nodes come near
each other, value for the peak of PDF seen around LoS path decreases with an increase in overall angular spread; this is because the contribution of far-end MSn0 scattering cluster becomes more influential. This translates that an increase in the link distance causes a decrease in the contribution from far-end, thus the span of peak around LoS direction sharpens. Similar effect on the PDF of elevation AoA can also be observed in Fig. 6(a). An increase in the link distance causes an increase in the relative probability of signals arrival from the scattering volumes around observing-end MSncompared to the volume around far-end MSn0.
? n [degrees]
(a) -100 0 100
p( ?n ) 0 0.005 0.01 0.015
0.02 Analytical results
Simulation results
-n [degrees]
(b)
0 20 40 60
p( -n ) 0 0.02 0.04
0.06 Analytical resultsSimulation results
Fig. 4. Simulation and analytical results comparison for marginal PDF of (a) azimuth AoA and (b) elevation AoA, observing from MSn. (an,o= 65m,
bn,o= 85m,cn,o= 65m,an,i= 55m,bn,i= 35m,θn,o=θn,i=0o.an0,o
= 60m,bn0,o= 40m,cn0,o= 35m,an0,i= 25m,bn0,i= 20m,θn0,o=θn0,i
=0o, andd= 110m).
?n [degrees] (a) -100 0 100
p( ?n ) 0 0.005 0.01 0.015 0.02 0.025 0.03 0.035
d = 150m d = 200m d = 300m
?n [degrees] (b) -100 0 100
p( ?n ) 0 0.005 0.01 0.015 0.02 0.025 0.03
an,i = 80m, bn,i = 60m
an,i = 50m, bn,i = 30m
an,i = 0m, bn,i = 0m
?n [degrees] (c) -100 0 100
p( ?n ) 0 0.005 0.01 0.015 0.02 0.025 0.03 0.035
cn,o / cn',o = 1/2
cn,o / cn',o = 1
cn,o / cn',o = 2
Fig. 5. Effect of (a) distancedbetween MSnand MSn0, (b) size of inner
cylinder (an,iandbn,i) of MSn, and (c) ratio of height of MSnand MSn0,
on marginal PDF of azimuth AoA as seen from MSn
-n [degrees] (a) 0 20 40 60 80
p( -n ) 0 0.01 0.02 0.03 0.04 0.05 0.06
d = 150m d = 200m d = 300m
-n [degrees] (b) 0 20 40 60 80
p( -n ) 0 0.01 0.02 0.03 0.04 0.05 0.06
an,i = 80m, bn,i = 60m
an,i = 50m, bn,i = 30m
an,i = 0m, bn,i = 0m
-n [degrees] (c) 0 20 40 60 80
p( -n ) 0 0.01 0.02 0.03 0.04 0.05 0.06
cn,o / cn',o = 1/2
cn,o / cn',o = 1 cn,o / cn',o = 2
Fig. 6. Effect of (a) distancedbetween MSnand MSn0, (b)inner cylinder’s size (an,i andbn,i) of MSn, and (c) ratio of height of MSnand MSn0, on
marginal PDF of elevation AoA as seen from MSn
hollow region may thus represent the width of highway or street etc. The physical parameters of MSntaken for obtaining these graphs arean,o= 100m,bn,o= 150m,cn,o= 80m, and
θn,i = θn,o = 0o. Parameters of MSn0 are an0,o = 95m,
bn0,o= 75m, cn0,o= 75m, an0,i= 50m,bn0,i= 30m, θn0,i=
θn0,o = 0o and d = 125m. The volume of inner bounding
cylinder is varied, and volume of ellipsoid is unchanged. In Fig. 5(b) it is evident that as the volume of scattering free region (cylindric) in the cluster around far-end increases, a dip in the PDF of AoA along the LoS direction is observed. In Fig. 6(b), it is evident that with the increase in volume of inner cylinder number of scatterers along the elevational plane for higher elevation angles decreases. This upper limit on elevation angle βn,3 approaches to the maximum ofπ/2
with a decrease in hollow (scattering free) region, thus an
d [m]
(a) 100 150 200 250
Angular Spread, (n 0.6 0.65 0.7 0.75 0.8 0.85 0.9 0.95 b
n,o / an,o = 1
b
n,o / an,o = 6 / 7
b
n,o / an,o = 3 / 4
d [m]
(b) 100 150 200 250
Elevational Constriction, 9n -0.422 -0.42 -0.418 -0.416 -0.414 -0.412 -0.41
Vn,i / Vn,o = 1 / 2
Vn,i / Vn,o = 3 / 7
Vn,i / Vn,o = 3 / 8
d [m]
(c) 100 150 200 250
Azimuthal Constriction, 1n 0.05 0.1 0.15 0.2 0.25 0.3 0.35 a
n,o / an',o = 6 / 7
a
n,o / an',o = 1
a
n,o / an',o = 8 / 7
Fig. 7. Observing from MSn, the effect of variation in distancedbetween MSnand MSn0 and, (a) ratio of intermediate and major axis of ellipsoid
at the local end on angular spread is shown, cn0,o = 60m,bn0,o = 60m,
an0,o= 70m,bn0,i= 20m,an0,i = 30m,cn,o= 40m,bn,i = 20m,an,i=
30m,θn0,i=θn0,o=0◦, (b) change in volume on elevational constriction is
shown,cn0,o= 60m,bn0,o= 60m,an0,o= 70m,bn0,i= 20m,an0,i= 30m,
bn,o= 60m,bn,i= 20m,cn,o= 40m,θn0,i=θn0,o=0◦, (c) ratio of major axis of ellipsoid at the local and far end on azimuthal constriction is shown, cn0,o= 60m,bn0,o= 60m,bn0,i = 20m,cn0,i= 20m,cn,o= 40m,bn,o=
40m,bn,i = 20m,an,i= 30m,θn0,i=θn0,o=0◦.
d [m]
(a) 100 150 200 250
Angular Spread, (n' 0.55 0.6 0.65 0.7 0.75 0.8 0.85 0.9 0.95 b n,o / an,o = 1
bn,o / an,o = 6 / 7
bn,o / an',o = 3 / 4
d [m]
(c) 100 150 200 250
Azimuthal Constriction, 1n' 0 0.05 0.1 0.15 0.2 0.25 0.3 0.35 0.4 a
n,o / an',o = 6 / 7
a n,o / an',o = 1
an,o / an',o = 8 / 7
d [m]
(b) 100 150 200 250
Elevational Constriction, 9n' -0.43 -0.42 -0.41 -0.4 -0.39 -0.38 -0.37 -0.36 -0.35
cn',o / cn,o = 1 / 2
c
n',o / cn,o = 3 / 7
c
n',o / cn,o = 3 / 8
Fig. 8. Observing from MSn0, the effect of variation in distancedbetween MSnand MSn0 and, (a) ratio of intermediate and major axis of ellipsoid at
the far end on angular spread is shown,cn,o= 60m,bn,i= 20m,an,i= 30m,
cn0,o= 40m,bn0,o= 60m,an0,o= 60m,bn0,i = 20m,an0,i = 30m,θn0,i
=θn0,o=0◦, (b) ratio of height of ellipsoids on elevational constriction is shown,bn,o= 60m,an,o= 70m,bn,i = 20m,an,i = 30m,bn0,o = 60m,
an0,o = 60m,bn0,i = 20m, an0,i = 30m,θn0i =θn0,o=0◦, (c) ratio of major axis of ellipsoid at the far and local end on azimuthal constriction is shown,cn,o= 60m,bn,o= 60m,bn,i = 20m,an,i = 30m,cn0,o = 40m, bn0,o= 60m,bn0,i = 20m,an0,i= 30m,θn0,i =θn0,o=0◦.
increase in the angular spread is observed. The ratio of heights of far- and local-end scattering clusters is varied and impact on azimuth and elevation AoA PDFs is demonstrated in Fig. 5(c) and 6(c), respectively. The setting of other parameters of MSn for obtaining these graphs isan,i= 45m,bn,i= 25m, an,o= 75m, bn,o= 65m, θn,o=θn,i= 0o. The parameter of MSn0
are an0,o = 75m, bn0,o = 65m, an0,i = 45m, bn0,i = 25m,
θn0,i=θn0,o= 0o, andd= 80m. The change in dimension of
scattering volumes along the vertical axis has a minor impact on PDF of azimuth AoA; however, its impact on the PDF of elevation AoA is significant and important.
distancedand the ratio between intermediate and major axis of outer boundary of the scattering clusters on the local-end angular spread is plotted in It is observed that with increase in direct distance between MSs, the joint angular spread is increasing. Moreover, angular spread decreases with transfor-mation in the shape of scattering region in x-y plane from circular to elliptical. Characterization of angular constriction in elevation and azimuth planes helps in studying the bias of propagation environment towards two physical directions of arrival and departure. In Fig. 7 (b), Observing from MSn, the effect of variation in link distance and volume of scattering clusters on the elevational constriction shape factor is shown. The effect of change in horizontal distancedand ratio between major axis of far-end and local-end scattering clusters on the azimuthal constriction seen at received side is plotted in Fig. 7 (c). It is observed that the azimuthal constriction increases w.r.t distance up to a certain point, while this trend reverses as decreasing after an increase in the horizontal distance when the far-end’s contribution becomes negligible. Similarly, when studying the transmitter side joint angular spread statistics, the effect of change in link distanced and the ratio between intermediate and major axis of the outer boundary is plotted in Fig. 8 (a). The study is further extended to analyze the impact of change in ratio between major axes of local- and far-end scattering clusters in Fig. 8 (c). In Fig. 8 (b), the effect of ratio between the vertical dimension of far- and local-end scattering clusters on the elevational constriction shape factor is demonstrated. The effect is clearly evident with a change in the amount of scatterers along the vertical axis. An increase in the link distance causes an exponential decrease in the elevation constriction of far-end. This is because the prominent two peaks in PDF of AoA transform to conventional PDF of elevational AoA with decreasing value along an the increasing elevation angle.
V. CONCLUSION
This work has proposed an improved description of the effective scattering clusters in V2V communication environ-ments. Based on the proposed channel model, the AoD and AoA spread has been quantified in terms of the joint angular spread, azimuthal constriction, and the elevational constriction. The proposed channel model, through its flexible description of the geometric shape of scattering clusters, can be used to investigate the effect of various physical channel parameters on the AoD and AoA spreads. The presented analysis is of high significance in enabling the deployment of Massive MIMO in V2V communications. The results are useful for the characterization of Doppler spectrum and for designing optimal beams in vehicular communications.
ACKNOWLEDGEMENT
The authors acknowledge the support provided by the EU funded project ATOM-690750 (H2020-MSCA-RISE-2015), Higher Education Commission (HEC) Pakistan funded re-search project 21-1934 (SRGP-R&D-HEC-18), and travel grant support by HEC Pakistan.
REFERENCES
[1] S. Kim, D. Kang, and J. Choi, “Beam reconfigurable antenna using switchable parasitic elements for V2V applications,” in proc. of Int. Symp. on Antennas and Propag, Oct. 2017, pp. 1–2.
[2] Y. Chen, L. Wang, Y. Ai, B. Jiao, and L. Hanzo, “Performance analysis of NOMA-SM in vehicle-to-vehicle massive MIMO channels,”IEEE J. on Selected Areas in Commun., vol. 35, no. 12, pp. 2653–2666, 2017. [3] H. Hartenstein and L. Laberteaux, “A tutorial survey on vehicular ad-hoc
networks,”IEEE Commun. Mag., vol. 46, no. 6, 2008.
[4] M. Riaz, N. M. Khan, and S. J. Nawaz, “A generalized 3-D scattering channel model for spatiotemporal statistics in mobile-to-mobile commu-nication environment,”IEEE Trans. on Veh. Technol., vol. 64, no. 10, pp. 4399–4410, Oct. 2015.
[5] H. Jiang, Z. Zhang, J. Dang, and L. Wu, “A novel 3-D massive MIMO channel model for vehicle-to-vehicle communication environments,” IEEE Trans. on Commun., vol. 66, no. 1, pp. 79–90, Jan. 2018. [6] S. Wu, C. X. Wang, e. H. M. Aggoune, M. M. Alwakeel, and X. H.
You, “A general 3D non-stationary 5G wireless channel model,”IEEE Trans. on Commun., Dec. 2017.
[7] W. I. Waseer, S. J. Nawaz, S. M. Gulfam, and M. J. Mughal, “Second-order fading statistics of massive-MIMO vehicular radio communication channels,” Trans. on Emerging Tel. Technol., DOI:10.1002/ett.3487, 2018.
[8] Y. Liu, X. Fang, M. Xiao, and S. Mumtaz, “Decentralized beam pair selection in multi-beam millimeter-wave networks,” IEEE Trans. on Commun., vol. 66, no. 6, pp. 2722–2737, Jun 2018.
[9] L. Pang, Y. Zhang, G. Ren, F. Gong, A. Wang, and J. Li, “Markov process based array non-stationarity modeling for massive MIMO chan-nels,” inproc. of Veh. Technol. Conf. (VTC-Fall), 2017, pp. 1–6. [10] T. Zwick, C. Fischer, and W. Wiesbeck, “A stochastic multipath channel
model including path directions for indoor environments,”IEEE J. on Selected Areas in Commun., vol. 20, no. 6, pp. 1178–1192, 2002. [11] H. Xiao, A. G. Burr, and L. Song, “A time-variant wideband spatial
channel model based on the 3GPP model,” in proc. of Veh. Technol. Conf., 2006., pp. 1–5.
[12] D. S. Baum, J. Hansen, and J. Salo, “An interim channel model for beyond-3G systems: extending the 3GPP spatial channel model (scm),” inproc. of Veh. Technol. Conf., 2005., vol. 5, pp. 3132–3136. [13] F. Bohagen, P. Orten, and G. E. Oien, “On spherical vs. plane wave
modeling of line-of-sight MIMO channels,”IEEE Trans. on Commun., vol. 57, no. 3, pp. 841–849, 2009.
[14] J. Medbo, P. Kyosti, K. Kusume, L. Raschkowski, K. Haneda, T. Jamsa, V. Nurmela, A. Roivainen, and J. Meinila, “Radio propagation modeling for 5G mobile and wireless communications,”IEEE Commun. Mag., vol. 54, no. 6, pp. 144–151, 2016.
[15] A. Y. Olenko, K. T. Wong, and E. H.-O. Ng, “Analytically derived ToA-DoA statistics of uplink/downlink wireless multipaths arisen from scatterers on an hollow-disc around the mobile,”IEEE Antennas and Wireless Propag. Lett., vol. 2, pp. 345–348, 2003.
[16] B. S. Paul and R. Bhattacharjee, “Time and angle of arrival statistics of mobile-to-mobile communication channel employing dual annular strip model,”IETE J. Research, vol. 56, no. 6, pp. 327–332, 2010. [17] S. J. Nawaz, N. M. Khan, M. N. Patwary, and M. Moniri, “Effect
of directional antenna on the Doppler spectrum in 3-D mobile radio propagation environment,”IEEE Trans. on Veh. Technol., vol. 60, no. 7, pp. 2895–2903, Sep. 2011.
[18] P. Petrus, J. H. Reed, and T. S. Rappaport, “Geometrical-based statistical macrocell channel model for mobile environments,” IEEE Trans. on Commun., vol. 50, no. 3, pp. 495–502, Mar. 2002.
[19] A. Ahmed, S. J. Nawaz, and S. M. Gulfam, “A 3-D propagation model for emerging land mobile radio cellular environments,” PLoS ONE, vol. 10, no. 8, p. e0132555, 2015.
[20] D. G. Valchev, “Spatial modeling of three-dimensional multipath wire-less channels,” Ph.D. dissertation, 2008.
[21] C. Ziolkowski and J. M. Kelner, “Statistical evaluation of the azimuth and elevation angles seen at the output of the receiving antenna,”IEEE Trans. on Antenna and Propag., vol. 66, no. 4, pp. 2165–2169, Apr. 2018.