ORIGINAL ARTICLE DOI 10.1007/s10086-004-0661-z
A. Firmanti
Research Institute For Human Settlements, Jl. Panyaungan-Cileunyi Wetan, Bandung 40008, Indonesia
E.T. Bachtiar · S. Surjokusumo
Faculty of Forestry, Bogor Agriculture University, Kompleks IPB Darmaga Bogor 16680, Indonesia
K. Komatsu · S. Kawai (*)
Research Institute for Sustainable Humanosphere, Kyoto University, Uji 611-0011, Japan
Tel. 81-774-38-3673; Fax 81-774-38-3678 e-mail: skawai@rish.kyoto-u.ac.jp
Anita Firmanti · Efendi Tri Bachtiar
Surjono Surjokusumo · Kohei Komatsu · Shuichi Kawai
Mechanical stress grading of tropical timbers without regard to species
Received: March 12, 2004 / Accepted: June 22, 2004
Introduction
Being a natural material, wood has large variations of strength and stiffness properties among species and even among pieces in one species. The variations of strength and stiffness are caused by defects or imperfections like knots (number, size, and location in each piece of timber), slope of grain, and interlocked grain. To guarantee structural safety, prediction of timber strength is necessary. The strength characteristics of a piece of timber should be evalu-ated by nondestructive methods. It can be done through visual grading or mechanical grading or by combination of such methods. For simplicity and economy, pieces of timber of similar mechanical properties are placed in categories called stress grades.1
Most tropical countries are blessed with a biodiversity of natural resources which means that hundreds or thousands of timber species are available for construction. In such cases, the application of visual grading is complicated due to the difficulties of species identification and checking of the imperfection condition. Predicting the strength of wood on a large scale through density shows a poor coefficient of determination (R2
). A study on Norway spruce (Picea abies) reported that the R2
value of the relationship between den-sity and bending strength was in the range of 0.16–0.40 while the R2 value of the relationship between the density and knots was 0.38. However, the stiffness, which is nor-mally expressed as the modulus of elasticity (MOE), is by far recognized as the best predictor of strength.2
The most common method of sorting machine-graded lumber is to measure MOE.1
The R2
value of the relationship between MOE and bending strength [modulus of rupture (MOR)] of Norway spruce was in the range of 0.51–0.72.2,3
Previous studies have showed the R2 value between MOE in flatwise timber and MOR was 0.61 for Acacia mangium timber and 0.53 for mixed tropical wood.5
Combining MOE with knots and other data gained slight improvement in the relation-ship between MOE and MOR.2
In the application to timber grading and strength classes, the strength of a piece of timber regardless of species could be predicted and classified through measuring the Abstract Some reports have shown that for single species
the correlation between modulus of elasticity (MOE) and modulus of rupture (MOR) in bending is quite high. Tropi-cal timbers consist of hundreds of species that are difficult to identify. This report deals with the mechanical stress grading of tropical timber regardless of species. Nine timber species or groups of species with a total number of 1094 pieces measuring 60 120 3000 mm, were tested in static bending. The MOE was measured flat wise, while MOR was tested edge wise. Statistical analysis of linear regression with a dummy model and analysis of covariance were used to analyze the role of MOE and the effect of species on prediction of MOR. The analysis showed that using MOE as a single predictor caused under/overestimation for one or more species and/or groups of species. The accuracy of prediction would be increased with species identification. An allowable stress and reference resistance for species and/or groups of species were provided to compare with the prediction of strength through timber grading. The timber strength class for species and/or groups of species was also established to support the application of mechanical timber grading.
MOE. Most species are grouped together and the timber performances from such species are treated similarly. With reference to the availability of timber for structural purposes consisting of many species in tropical countries, the application of mechanical stress grading needs to be evaluated.
The objective of this study was to evaluate the applica-tion of mechanical grading to tropical timber, which consists of timber from natural forest, timber from plantation forest, hardwood as well as softwood. It is expected that the results can be utilized in structural timber design.
Materials and methods
The number of the specimens was 1094 pieces of tropical wood consisting of timber from natural forest [60 pieces of kapur (Dryobalanops aromatica Gaertner f.), 192 pieces of a group of meranti or Shorea sp., and 314 pieces of mixed unknown species namely “borneo” timber] hardwood from plantation forest [120 pieces of Acacia mangium, Willd,4
60 pieces of falcata (Paraserianthes falcataria, L. Nielsen), 60 pieces of rubber wood (Hevea brasiliensis, Willd), and 60 pieces of Maesopsis eminii, Engler], and softwood from plantation forest [168 pieces of Pinus merkusii, Junghuhn & de Vriese, and 60 pieces of agathis (Agathis dammara, Lam-bert Rich)]. The specimens were 60 120 3000 (L) mm when air-dried. For any piece of lumber, the imperfection condition was evaluated based on the visual grading system of Indonesian Standard for Construction Timber (SNI 03-3527).6
Based on the diameter of the knots, slope of the grain, length of the wane, and other visual grading param-eters, the timber was classified into the three categories of class A, class B, and that rejected as structural timber. Only timber that was classified as timber suitable for building construction was used as specimens.
The MOE in flatwise configuration with center-point loading was measured using a simple machine with a deflectometer that can magnify the reading about 40 times. In the measurement of MOE flat wise, the span was 2730 mm and the applied load was 25 kg. Before measuring the MOE flat wise, the machine was calibrated based on a certified dial gauge. The specimens were then tested in flexural bending with three-point loading edge wise with a universal testing machine with a capacity of 100 tons, following the procedure of ASTM D 198.7
With consider-ation of the loading system, adjustment factors were applied to the MOE and MOR calculations based on the equilib-rium moisture content in Indonesia of 15% and ASTM 2915.8
Regression analysis was used to analyze the relationship between MOE flat wise and MOR of the timber. Based on the regression analysis, the allowable stress for the tropical wood and the stress classification were established. The effects of timber species on the MOR of timber were ana-lyzed using analysis of covariance (ANCOVA) with MOE as the covariant variable and the model as shown in Eq. 1:
Yij µ τi
(
Xij X)
εij (1)where Yij is the measured MOR of species i and sample number j, µ is the average MOR, τi is the additive effect of species, is the regression coefficient that expresses the dependency of MOR on MOE, Xij is the measured MOE, X is the average MOE, and εij is the error of sample number j of species i.
The hypothetical test was conducted through an F test by considering:
Ho: τi 0, there is no significant effect of species or group of species to MOR.
For
H1: τi π 0, there is at least one species that shows a
significantly different MOR value to the others.
The prediction of strength characteristics of the timber was analyzed through a model as described by Eq. 2:
Yij z aij j f X
(
ij)
εij (2)where zij is the dummy variable of species i, ai is a constant of the dummy variable and, f(Xij) is a function of the rela-tionship between MOR and MOE. Two hypotheses were used as:
1. Ho: 123. . . .k 0, species and MOE provide
no significant effect to MOR.
H1: $kπ 0, at least one species and/or MOE provide
significant effect to MOR.
2. Ho: species provide no significant effect on MOR when MOE is included in the analytical model.
H1: at least one species provides significant effect on
MOR when MOE is included in the analytical model.
Strength characteristics based on the allowable stress design (ASD) and load and resistance factor design (LRFD) were established following ASTM D 29158
and ASTM D 5457,9
respectively.
Results and discussion
Modulus of elasticity and bending strength performance of the timber
MOE and MOR of timber are the two parameters usually used in the evaluation of the bending performance of timber in structural sizes. The MOE and MOR of timber may vary among the species, trees, logs, and even among the sawn timber of one log.10
Variations of strength and stiffness are, in general, caused by density and imperfec-tions, i.e., knots, slope of grain, and interlocked grain.
plantation forest. The wide range of such values of timber from natural forest may be due to the cultivation system. Shorea sp. is a group of species occurring in the mixed unknown tropical wood commonly known as “Borneo” timber. It is reasonable to expect that the range of MOE and MOR of mixed tropical timber is wider than that of timber from plantation forest where the trees are well culti-vated and homogenous.
Parametric distributions, namely, normal, log-normal, and Weibull distributions were applied to evaluate the dis-tribution. Based on the frequency analysis, the apparent distribution was also analyzed to obtain the goodness of fit of the parametric distributions, i.e., normal distribution, log-normal distribution, and the cumulative Weibull distri-bution.11
It is not easy to recognize the fit of the parametric distributions to the actual frequency plots of the timber
generalized for all timber. Some species have a high good-ness of fit to the normal distribution, some to the log-normal distribution, and others to the Weibull distribution as shown in Table 2. The parametric distribution and actual frequency of the MOE and MOR of the tropical timber are shown in Figs. 1 and 2. Selecting the best fit distribution for the actual frequency values is important, especially for the lower tail values in the establishment of allowable MOE and MOR. In ASTM D 5457, the distribution of timber is assumed to be a Weibull distribution while the European standard tends to assume a log-normal distribution.12
With reference to Fig. 1, for the lower tail values, the log-normal and Weibull distributions provide better fits than the normal distribution, but for the other plots the log-normal distribution seems better than the Weibull distribution.
Table 1. Modulus of elasticity (MOE) and modulus of rupture (MOR) performance of tested timber
Specimens MOE (Gpa) MOR (MPa) Moisture content (%)
Min. Max. Mean SD Min. Max. Mean SD Min. Max. Mean SD
Hardwood from 5.3 28.5 15.1 4.1 13.8 134.3 59.8 20.3 13.9 18.4 15.5 1.4
natural forest
Borneo timber 8.3 28.5 15.3 4.1 30.0 108.0 62.8 15.4 14.3 18.4 15.5 1.5
Shorea sp. 5.3 25.9 14.9 3.9 13.8 134.3 55.1 26.1 13.9 16.7 14.9 1.3
Kapur 8.4 28.3 14.2 4.7 23.0 107.6 56.1 22.2 14.1 17.9 16.1 1.3
Planted fast-growing 4.1 22.1 9.8 2.9 11.6 92.0 41.6 13.1 12.9 18.8 15.6 1.1
hardwood
Acacia mangium 4.1 15.8 8.9 2.6 11.6 92.0 42.2 15.8 12.9 16.8 15.2 1.2
Falcata 6.2 13.0 8.7 1.4 15.3 48.0 32.7 8.1 13.2 17.9 14.8 0.9
Rubber wood 6.3 17.6 10.6 3.0 29.4 56.7 43.9 7.9 14.4 18.7 16.3 1.0
Maesopsis eminii 5.5 22.1 12.0 3.4 28.5 70.8 45.8 10.2 13.9 18.8 16.2 1.4
Total hardwood 4.1 28.5 13.6 4.5 11.6 134.3 54.7 20.1 12.9 18.8 15.6 1.2
Planted fast-growing 5.6 21.7 12.6 3.3 10.8 67.2 37.1 11.8 13.8 18.7 15.8 1.2
softwood
Pinus merkusii 5.6 21.7 12.9 3.6 15.4 55.9 34.2 8.6 14.5 17.6 15.9 1.0
Agathis 7.6 16.6 12.0 2.3 10.8 67.2 44.6 12.3 13.8 18.7 15.7 1.3
Tropical timber 4.1 28.5 13.3 4.3 10.8 134.3 50.6 20.0 12.9 18.8 15.7 1.1
(total)
SD, standard deviation
Table 2. Goodness of fit (percent) of parametric distribution to the plots of tropical timber
Specimens MOE MOR
Normal Log-normal Weibull Normal Log-normal Weibull
Timber from natural forest 67 100 47 84 68 100
Borneo timber 69 100 56 100 51 56
Shorea sp. 100 79 92 55 100 73
Kapur 60 100 50 71 100 72
Planted fast-growing hardwood 85 85 100 97 100 98
Acacia mangium 100 100 71 65 100 69
Falcata 85 80 100 100 86 100
Rubber wood 65 100 56 95 100 86
Maesopsis eminii 69 100 55 88 100 82
Hardwood 84 99 100 90 100 100
Planted fast-growing softwood 100 87 75 66 100 60
Pinus merkusii 100 91 87 91 100 73
Agathis 94 83 100 100 82 90
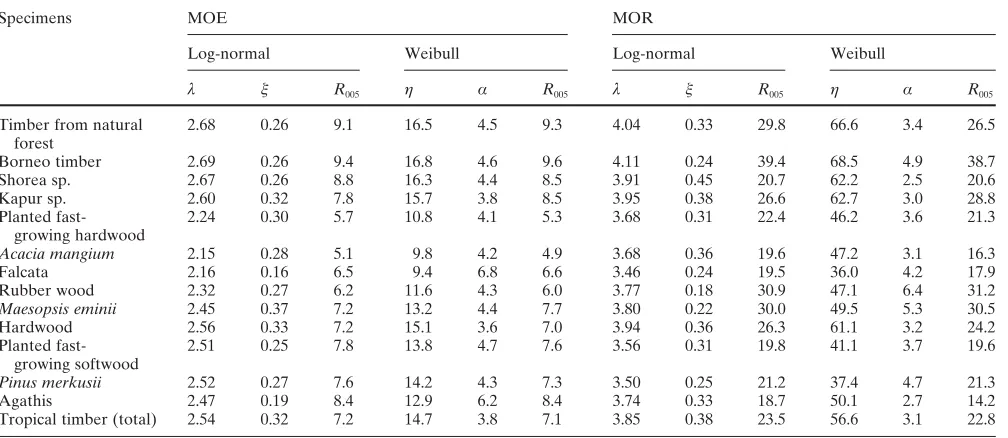
For each species or group of species, the mean and the standard deviation of the log-normal distribution, the shape and scale parameter of the Weibull distribution, as well as the fifth percentile limit were calculated and are presented in Table 3. An observation to the lower tail of the distribu-tion is important in order to reduce error in the establish-ment of allowable stress. Although the goodness of fit of the parametric distributions to the actual frequency of MOE
and MOR of the timber could not be specified as shown in Table 2 and Figs. 1 and 2; the difference of the fifth percen-tile limit of both the log-normal and Weibull distributions were relatively small as shown in Table 3. As described above, the fifth percentile limit of the MOE and MOR of timber from natural forest was also higher than planted timber. The MOE of planted softwood was higher than that of planted hardwood, while the strength of planted
hard-Table 3. The parameters of parametric distribution and their fifth percentile limit
Specimens MOE MOR
Log-normal Weibull Log-normal Weibull
λ R005 η α R005 λ R005 η α R005
Timber from natural 2.68 0.26 9.1 16.5 4.5 9.3 4.04 0.33 29.8 66.6 3.4 26.5
forest
Borneo timber 2.69 0.26 9.4 16.8 4.6 9.6 4.11 0.24 39.4 68.5 4.9 38.7
Shorea sp. 2.67 0.26 8.8 16.3 4.4 8.5 3.91 0.45 20.7 62.2 2.5 20.6
Kapur sp. 2.60 0.32 7.8 15.7 3.8 8.5 3.95 0.38 26.6 62.7 3.0 28.8
Planted fast- 2.24 0.30 5.7 10.8 4.1 5.3 3.68 0.31 22.4 46.2 3.6 21.3
growing hardwood
Acacia mangium 2.15 0.28 5.1 9.8 4.2 4.9 3.68 0.36 19.6 47.2 3.1 16.3
Falcata 2.16 0.16 6.5 9.4 6.8 6.6 3.46 0.24 19.5 36.0 4.2 17.9
Rubber wood 2.32 0.27 6.2 11.6 4.3 6.0 3.77 0.18 30.9 47.1 6.4 31.2
Maesopsis eminii 2.45 0.37 7.2 13.2 4.4 7.7 3.80 0.22 30.0 49.5 5.3 30.5
Hardwood 2.56 0.33 7.2 15.1 3.6 7.0 3.94 0.36 26.3 61.1 3.2 24.2
Planted fast- 2.51 0.25 7.8 13.8 4.7 7.6 3.56 0.31 19.8 41.1 3.7 19.6
growing softwood
Pinus merkusii 2.52 0.27 7.6 14.2 4.3 7.3 3.50 0.25 21.2 37.4 4.7 21.3
Agathis 2.47 0.19 8.4 12.9 6.2 8.4 3.74 0.33 18.7 50.1 2.7 14.2
Tropical timber (total) 2.54 0.32 7.2 14.7 3.8 7.1 3.85 0.38 23.5 56.6 3.1 22.8
λ, Mean of log-normal distribution; , standard deviation of log-normal distribution; η, scale parameter of Weibull distribution; α, shape parameter of Weibull distribution; R005, fifth percentile limit
Fig. 1a–c. Parametric distribu-tions of modulus of elasticity (MOE) for group of species of tropical timbers. a Normal distri-bution, b log-normal distridistri-bution, c Weibull distribution
wood was higher than that of planted softwood. These properties may be affected by the different characteristics of the timbers. Two distinct conditions that might affect MOE and MOR are the presence of tracheid in softwoods and vessels in hardwoods and the different formations of knots in both.12
Establishment of allowable stress and reference resistance in LRFD of species or group of species
The basic concept of ASD is that the working stress in the member of a structure should be lower or the same as the product of allowable stress of the member and correspond-ing duration of loadcorrespond-ing.9
The allowable stress is the strength characteristic with the reduction of the safety factor. For example, in Indonesia, as well as in the USA, the safety factor of bending strength is 1/2.1.8,13
Based on ASTM8
and European Standards,14 the strength characteristic of the timber is the fifth exclusion limit (R005) of the population
distribution. The strength characteristic of timber is analyzed using parametric and/or nonparametric procedures.8
As mentioned above, the distributions of the timber could not be easily distinguished. For parametric proce-dures, the allowable strength of timber species and group of species could be obtained from Table 3 with reference to Table 2 for the goodness of fit. There are two statistical ways for nonparametric procedures, i.e., nonparametric point estimate (NPE) based on interpolated data, and nonparametric lower tolerance limit (NTL) based on order statistics. The width of the confidence interval is a sufficiently small fraction of the mean with the values in the range of 0.016 to 0.067. In such a condition, the allowable value of modulus of elasticity is the mean of MOE as shown in Table 1.8
Through parametric and nonparametric procedures with the condition as mentioned above and considering the safety factor of bending in 10 years loading of 2.1,8,13
the
strength characteristic and allowable strength is presented in Table 4. With the sufficiently small values of the relative difference between NPE and NTL, the value of NPE as shown in Table 4 is the allowable stress for bending.8
The allowable stress of any species or group species could also be established through parametric procedures with the small difference value between parametric point estimate (PPE) and NPE or NTL.
The reference resistance for LRFD of the timber was calculated based on the format conversion and reliability normalization factor as mentioned in ASTM D 5457.9
For-mat conversion used the ASD load duration adjustment factor of 1.15, LRFD time effect factor of 0.80, and specified LRFD factor for bending of 0.85.8
The calculation based on reliability normalization factor was conducted using an assumption that the distribution was a Weibull distribution, although the goodness of fit of the Weibull distribution for some species or group of species were lower than 100% as shown in Table 2. In the reliability normalization factor procedure, sample size and coefficient of variations are the decisive factors.
The reference resistance of a species or group of species established through format conversion seemed higher than the one through reliability normalization as shown in Table 5. When the coefficient of variation of the strength of a species is relatively high, the reference resistance based on the reliability normalization would be much lower than the one from format conversion due the reverse position of the coefficient of variation in the reliability normalization equa-tion. Such phenomena indicate that the application of LRFD based on the reliability normalization factor for tropical timbers needs more study.
With reference to Tables 1, 4, and 5, the application of allowable stress and reference resistance for species and/or group of species will mean very safe but inefficient use of the timber due to the use of the fifth percentile of the distributions and/or statistical nonparametric values as the predicted values.
Table 4. The allowable bending stress (in MPa) for allowable stress design (ASD)
Specimens Parametric (distribution) Nonparametric
5% PE Weibull 5% PE log-normal 5% PE 5% TL δ
Timber from natural forest 12.62 14.19 13.09 12.62 0.036
Borneo timber 18.43 18.76 19.48 18.10 0.071
Shorea sp. 9.81 9.86 9.90 9.48 0.042
Kapur 13.71 12.67 14.75 14.52 0.015
Planted hardwood 10.14 10.67 10.71 10.38 0.032
Acacia mangium 7.76 9.33 8.57 7.86 0.083
Falcata 8.52 9.29 8.43 8.19 0.030
Rubber wood 14.86 14.71 15.26 15.10 0.010
Maesopsis eminii 14.52 14.29 14.86 14.43 0.028
Hardwood 11.52 12.52 11.62 11.48 0.011
Softwood 9.33 9.43 9.29 8.95 0.028
Pinus merkusii 10.14 10.10 10.38 10.14 0.022
Agathis 6.76 8.90 7.04 6.62 0.061
Topical timber (total) 10.86 11.19 10.91 10.76 0.014
Application grading regardless of species conception for the tropical timber
Some difficulties appeared when visual grading the tropical timber due to the variety of timber species and their embedded characteristics. Shorea sp. consists of 194 species of which 163 species are found in Melanesia.15
It was also reported that from 400 pieces of mixed tropical timber, namely “Borneo,” 23 species were found with a wide range of density and strength of the timber.5
Visual grading for predicting the strength through evaluation of imperfections, being expressed as the “strength ratio” of clear straight-grain, small specimens of a species, is difficult to apply to the tropical species in such conditions.
The MOE is by far the best predictor of MOR.2
Some studies of single species reported a relatively strong rela-tionship between MOE and MOR of the timber.2–5
Table 6 shows the relationship between MOE flat wise and strength of the timber of some species and groups of species. The coefficient of determination (R2
) of the relationship be-tween MOE and MOR of the known single species was in the range of 0.60 to 0.71, but it was lower for the mixed species. When all of the specimens were taken into account,
the R2
value was 0.55 as shown in Fig. 3. The R2
value of softwood represented by Pinus merkusii and agathis was 0.36. Although the value was quite small, it was better than combining the data of Pinus merkusii with falcata of which
Table 5. Reference resistance of the bending strength (MPa) of timber for load and resistance factor design (LRFD) based on ASTM D 5457
Specimens Format conversion Reliability normalization
Parametric Nonparametric
5% PE Weibull 5% PE log-normal 5% PE 5% TL
Timber from natural forest 32.05 36.04 33.25 32.05 26.71
Borneo timber 46.81 47.65 49.48 45.97 41.95
Shorea sp. 24.92 25.04 25.15 24.08 16.83
Kapur 34.82 32.18 37.47 36.88 20.70
Planted hardwood 25.76 27.10 27.20 26.37 18.98
Acacia mangium 19.71 23.70 21.77 19.96 16.60
Falcata 21.64 23.60 21.41 20.80 17.19
Rubber wood 37.74 37.36 38.76 38.35 33.51
Maesopsis eminii 36.88 36.30 37.74 36.65 29.99
Hardwood 29.26 31.80 29.51 29.16 23.41
Softwood 23.70 23.95 23.60 22.73 17.36
Pinus merkusii 25.76 25.65 26.37 25.76 22.18
Agathis 17.17 22.61 17.80 16.81 14.27
Tropical timber (total) 27.58 28.42 27.71 27.33 20.93
Table 6. The coefficient of determination of the relationship between MOE and MOR
Specimens Number of samples Coefficient of determination (R2)
Timber from natural forest 566 0.56
Borneo timber 314 0.53
Shorea sp. 192 0.64
Kapur 60 0.71
Planted hardwood 300 0.57
Acacia mangium 120 0.71
Falcata 60 0.63
Rubber wood 60 0.61
Maesopsis eminii 60 0.64
Planted softwood 228 0.36
Pinus merkusii 168 0.60
Agathis 60 0.68
the mean value of the strength was similar to those of Acacia mangium, rubber wood, and Maesopsis eminii from the hardwood. The R2
value of the relationship between MOE and MOR of such a combination was less than 0.30.
Because the R2
value of MOE and MOR of all timber specimens in this experiment was 0.55, MOE is a good predictor of MOR, although the application of using MOE as a single variable would cause the over/underestimation of MOR, at least for one species as expressed by the high value of allowable stress F calculated and a very small significant value. The hypothesis that at least there is a species provid-ing a MOR value significantly different from others could be accepted. The fact that there is at least one species pro-viding significantly different MOR endorsed that the identi-fication of the timber species will improve the prediction of MOR through MOE from 74.2% (R2
0.55) to the range of 77.5% (R2
0.60) to 84.3% (R2
0.71).
The prediction equation of MOR based on MOE was obtained through the regression dummy analysis with ma-trix variables for species and/or group of species. It was found that species and group of species and/or MOE gave a significant effect on MOR with the high calculated value of F and very small significant value. The hypothesis that at least one species and/or MOE provide significant effect on the MOR is accepted. The regression line of the species and group of species is shown in Table 7 and Fig. 4. Using MOE as the strength predictor regardless of species will overesti-mate MOR for softwood, especially Pinus merkusii, as shown in Fig. 4.
Although the timber from natural forest is still dominant in the timber construction industries in some tropical areas, promotion of the utilization of planted timber, especially fast growing species, has been disseminated for some de-cades. Because the selection cutting policy has been applied since the early 1980s, the availability of some selected species for timber construction has decreased. In many cases, rough visual grading and small clear specimen test results have been applied for predicting the strength of the timber. For the unknown species from natural forest, it is classified as a second class timber although it covers a wide range of strength.5
The utilization of timber from fast grow-ing trees is not yet popular due to the opinions on such timber as being of low grade for construction. With such background, the application of mechanical timber stress
grading to tropical planted timber based on MOE with regard to and/or regardless of species is very important.
Establishment of timber strength classes
Although the regression line of agathis is close to hardwood as shown in Fig. 4 and Table 7, there is a tendency for MOE to predict lower values of MOR than those of hardwood. With consideration that Pinus merkusii and agathis would be overestimated, the timber strength classes regardless of species was established only for hardwood with the regres-sion line and the 5% excluregres-sion limit as shown in Fig. 5. Exclusion of the values of softwood from the equation as shown in Fig. 3 improved the relationship of MOE and MOR to 0.64 as shown in Fig. 5. The strength classes of timber were derived based on 5% Exclusion limit (R005) of
ASD and LRFD as shown in Table 8. The reference resis-tance was estimated through format conversion with a load
Table 7. Equations for predicted MOR based on MOE of the timber species
Specimens or group of specimens Regression line
Borneo MOR 10.67 3.11 MOE
Shorea sp. MOR 4.41 3.11 MOE
Kapur MOR 7.64 3.11 MOE
Acacia mangium MOR 11.86 3.11 MOE
Falcata MOR 2.86 3.11 MOE
Rubber wood MOR 7.54 3.11 MOE
Maesopsis eminii MOR 4.76 3.11 MOE Pinus merkusii MOR 9.69 3.11 MOE
Agathis MOR 3.87 3.11 MOE
Fig. 4. Regression line of MOE and MOR for species and group of species of tropical timbers
adjustment factor of 1.15, a LRFD time factor of 0.80, and a ratio of live to dead load effects of 3, and specified a LRFD resistance factor for bending of 0.85. The format conversion reference resistance is computed with the design equation9
as below:
LFRD: λjRn 1 2. D 1 6. L
ASD: K Fd x D L
where λ is the time effect factor, j is the resistance factor, Rn is the reference resistance, D and L are the dead and live load effects, respectively, Kd is the load duration factor (for
ASD), and Fx is the allowable stress (for ASD).
The format conversion reference resistance is computed by multiplying the ASD resistance by the format conversion factor (Kf), where it is calculated as:
Kf
(
R Fn x)
: jswhere js is the specified LRFD resistance factor.
The proposed strength classes of the timber provides wider strength classes than common grades for machine-graded lumber established by the American Forest Product Society1
and the Japanese standard for timber structures.16
The upper parts of the proposed strength classes are occu-pied by the hardwood from natural forest which is usually cut at over 35 years while the planted hardwood is mostly cut at between 10 and 25 years, depending on the species and the purpose of the plantation. With reference to Tables 4 and 5, the allowable stiffness and strength properties of planted hardwood timber are almost the same as those of softwood in subtropical areas.1,16
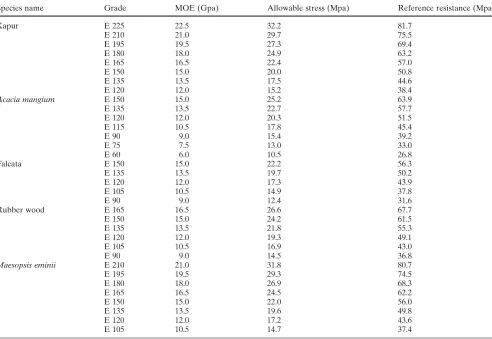
In practical application, timber identification is not easy, especially for mixed tropical wood and shorea sp., which consists of hundreds species. Therefore, timber strength classes that are regardless of species are desirable. When a timber species is not well recognized by designers, the timber strength classes that are regardless of species as shown in Table 8 should be applied because they are more conservative than the strength classes for specific species as shown in Table 9. With various species in a group, the
timber strength classes for a group of species, namely “Borneo” and shorea sp., were not provided. In the design stage, the timber strength classes that are regardless of spe-cies as mentioned above and shown in Table 8 should be applied for such groups.
Conclusion
Timber is a natural material with the embedded properties from the tree and those obtained during the production process. The MOE and MOR of timber were in wide ranges and the distributions of the mechanical performances did not clearly fit one parametric distribution, i.e., normal, log-normal, or Weibull distribution. The allowable stress for timber produced inefficient prediction. To effectively utilize timber as a structural material, timber grading can be applied visually and/or mechanically. With various timber species available and technical difficulties in apply-ing visual gradapply-ing, mechanical gradapply-ing with MOE as the predictor has been studied with regard to and regardless of species.
The ANCOVA statistical analysis showed that using MOE as a single variable for predicting MOR caused under/overestimation for one or more species and/or groups of species. The percentage of the accuracy of predic-tion would be increased with species identificapredic-tion. The analysis model with dummy regression found that at least one or more species showed a significant effect on MOR. It was also found that Pinus merkusii, as a tropical softwood, produced a significantly different MOR for the same MOE when compared with other timber.
The hardwood timber strength classes had been pro-posed to support the application of mechanical timber stress grading. To anticipate the application of the LRFD concept in global development, a reference resistance based on stress-graded timber has also been established through more research studies in strength characteristics of tropical timber.
Table 8. Timber strength classes for ASD and LRFD based on mechanical stress grading for tropical hardwood timber regardless of species
Grade MOE (GPa) Allowable stress (MPa) Reference resistance (MPa)
E 255 25.5 37.3 94.8
E 240 24.0 34.1 86.7
E 225 22.5 32.2 81.8
E 210 21.0 30.0 76.2
E 195 19.5 27.4 69.6
E 180 18.0 25.2 64.1
E 165 16.5 22.8 57.9
E 150 15.0 20.3 51.7
E 135 13.5 17.9 45.5
E 120 12.0 15.5 39.3
E 105 10.5 13.0 33.1
E 90 9.0 10.6 26.9
E 75 7.5 8.2 20.7
Table 9. Timber strength classes for ASD and LFRD based on mechanical stress grading of some tropical timber species
Species name Grade MOE (Gpa) Allowable stress (Mpa) Reference resistance (Mpa)
Kapur E 225 22.5 32.2 81.7
E 210 21.0 29.7 75.5
E 195 19.5 27.3 69.4
E 180 18.0 24.9 63.2
E 165 16.5 22.4 57.0
E 150 15.0 20.0 50.8
E 135 13.5 17.5 44.6
E 120 12.0 15.2 38.4
Acacia mangium E 150 15.0 25.2 63.9
E 135 13.5 22.7 57.7
E 120 12.0 20.3 51.5
E 115 10.5 17.8 45.4
E 90 9.0 15.4 39.2
E 75 7.5 13.0 33.0
E 60 6.0 10.5 26.8
Falcata E 150 15.0 22.2 56.3
E 135 13.5 19.7 50.2
E 120 12.0 17.3 43.9
E 105 10.5 14.9 37.8
E 90 9.0 12.4 31.6
Rubber wood E 165 16.5 26.6 67.7
E 150 15.0 24.2 61.5
E 135 13.5 21.8 55.3
E 120 12.0 19.3 49.1
E 105 10.5 16.9 43.0
E 90 9.0 14.5 36.8
Maesopsis eminii E 210 21.0 31.8 80.7
E 195 19.5 29.3 74.5
E 180 18.0 26.9 68.3
E 165 16.5 24.5 62.2
E 150 15.0 22.0 56.0
E 135 13.5 19.6 49.8
E 120 12.0 17.2 43.6
E 105 10.5 14.7 37.4
Acknowledgments The authors sincerely acknowledge the financial support of the Research Institute for Human Settlement of Indonesia. The invaluable support of A/Prof. M. Sato of Global Agricultural Sciences, Graduate School of Agricultural and Life Sciences, The Uni-versity of Tokyo, Japan, is highly appreciated.
References
1. Kretschmann DE, Green DW (1999) Lumber stress grades and allowable properties. Wood handbook: wood as an engineering material. Forest Product Laboratory U.S. Department of Agriculture, Washington, DC, Chapter 6, pp 6.1–6.14
2. Johanson CJ (2002) Grading of timber with respect to mechanical properties. Timber engineering. Wiley, New York, pp 23–43 3. Steffen A, Johansson CJ, Wormuth EW (1997) Study in the
rela-tionship between flat-wise and edge-wise moduli of elasticity of sawn timber as a means to improve mechanical strength grading technology. Holz Roh Werkst 55:245–253
4. Firmanti A, Surjokusumo S, Komatsu K, Kawai S (2004) The establishment of strength characteristic of fast growing acacia mangium timber for structural materials. (Submitted)
5. Firmanti A (1996) Basic concept of timber grading in Indonesia. Journal Masalah Bangunan. 36:1–4, 7–11
6. Indonesian Standardization Board (1994) Standard quality of tim-ber for building structure (in Indonesian). SNI 03-3527-2, Jakarta
7. ASTM Standard D 198-1999 (2000) Standard test methods of static tests of lumber in structural sizes. Vol 04.10. Wood, Philadelphia
8. ASTM Standard D 2915-1997 (2000) Evaluating allowable properties for grades of structural timber. Vol 04.10. Wood, Philadelphia
9. ASTM Standard D-5457 (1997) Standard specification for comput-ing reference resistance of wood based materials and structural connections for load and resistance factor design. Vol 04.10, Wood, Philadelphia
10. Gloss P (1993) Strength grading. Step Eurofortech Lecture, 6 A6:1–8
11. Horie K (1997) The statistical and probability method of timber strength data (in Japanese). Timber Engineering Institute, Sunagawa-Hokkaido, Japan
12. Brown HP, Panshin AJ, Forsaith CC (1949) Text book of wood technology. Structure, identification, defects, and uses of the com-mercial woods of the United States, vol 1. McGraw-Hill, New York, pp 111–285
13. Indonesian Standard Board (2002) Code of practice for timber construction (in Indonesian). SNI 03-3974, Jakarta
14. European Committee for Standardization (1995) EN 384: Struc-tural timber – determination of characteristic value of mechanical properties and density. Brussels, Belgium, p 13
15. Soerianegara I, Lemmens RHMJ (1993) Timber trees: major com-mercial timbers. Pudoc, Wageningen, pp 391–434