O R I G I N A L P A P E R
Open Access
Study on stress evolution in the cooling process
of micro hot embossing
Juan A Gomez
1, Devanda Lek
2, In-Hyouk Song
1,2and Byoung Hee You
1,2*Abstract
Cooling of an embossed part has been recognized as one of the critical steps in the hot embossing of polymer microdevices. Numerical analysis was performed to study the stress developed in an embossed microstructure during the cooling process of hot embossing. A hemisphere-tipped post was selected as an example structure to demonstrate the stress evolution. The posts are located at 5, 10, 15, and 20 mm from the center of the embossed part. The results of the analysis showed that stresses of the posts increased as the radial locations of the post increased. In addition, the stress rapidly increased until the cooling time reached about 100.0 s. The maximum stresses of 28.9, 30.2, 32.3, and 34.5 MPa were estimated at the post locations of 5, 10, 15, and 20 mm from the center of the part, respectively. Experiments were performed to verify the numerical models. Undercut at the bottom of a post was observed as it was predicted in the numerical analysis.
Keywords:Cooling; Micro hot embossing; Stress evolution; Shrinkage; Stress concentration
Review
Cooling of a molded part is a critical step for the suc-cessful fabrication of polymer microstructures using hot embossing (Matthew and David 2011; Song et al. 2008a; Jeong et al. 2002). Defects not caused by the filling of the mold cavity with polymer are attributed to the cool-ing or demoldcool-ing process (Song et al. 2008a; Jeong et al. 2002; Guo et al. 2007a, b). Typical cooling defects in-clude distorted, deformed, and broken microstructures. The shrinkage of polymer induces thermal stress in the molded part as it cools down. Thermally induced mech-anical stress is a principal contributor to the defects (Song et al. 2008b; Worgull et al. 2008; Schift et al. 2001). Numerical analysis can assist in understanding the stress evolution and the defects since the observation of microstructure is extremely difficult during cooling.
Hot embossing consists of heating a polymer substrate above its glass transition temperature, pressing a mold insert into the polymer substrate to transfer the features, cooling the substrate and mold insert while maintaining the embossing pressure, and separating the mold insert
from the polymer substrate (Matthew and David 2011; Song et al. 2008a). Compared with microinjection mold-ing, hot embossing offers advantages such as low oper-ation cost, process simplicity, and easy mold exchange as well as replicating structures with a lower internal re-sidual stress (Guo et al. 2007a, b; Song et al. 2008b; Worgull et al. 2008).
Numerical analyses and experiments have been per-formed to understand the evolution of stress on a poly-mer substrate during molding. Dirckx et al. showed the effects of thermal stress, friction, and adhesion on the defects of the molded part (Matthew and David 2011). Adhesion and friction between the sidewall of the mold cavity and the molded part played a significant role dur-ing demolddur-ing.
Thermal shrinkage and adhesion forces were analyzed by the finite element method (FEM) to decrease the thermal stress of molded structures (Guo et al. 2007a, b). The deformation of microstructures typically occurred in both the cooling and demolding steps. Numerical simula-tions estimated the friction force generated by adhesion and thermal stress (Guo et al. 2007a; Song et al. 2008b). Thermal stress was correlated with the geometry of a mold cavity, and auxiliary structures on the molded part were suggested as thermal stress barriers (Worgull et al. 2006; Farshchian et al. 2012).
* Correspondence:[email protected]
1Materials Science, Engineering, and Commercialization Program, Texas State University, San Marcos, TX 78666, USA
2Department of Engineering Technology, Texas State University, San Marcos, TX 78666, USA
In this paper, the stress evolution of a molded struc-ture was studied during the cooling process of hot embossing. Numerical analysis was performed using the commercial finite element method software DEFORM-2D (Scientific Forming Technologies Corp., Columbus, OH, USA). A hemisphere-tipped post used in previous microassembly studies was selected as an example struc-ture for the numerical analysis. Hot embossing experi-ments were also performed to verify simulation. The results of simulation and experiments showed the de-fects that resulted from thermal stress of the post.
Numerical analysis
DEFORM-2D has been used in hot embossing simula-tions (Farshchian et al. 2012; You et al. 2009; Jin et al. 2009). The flow of polymer was assumed as a non-Newtonian viscous fluid in demolding. The flow stress-polymer temperature relationship was described by a segmented linearization obtained from experimental data (Juang et al. 2002a, b). Flow stress of the polymer was defined as the function of stress and strain under constant strain rates. Equation 1 defines the flow behav-ior of the polymer at given molding temperatures and embossing forces:
σ¼cTþεk ð1Þ
whereσis the flow stress,T is the molding temperature,
ε is the strain rate, and c and k are the coefficients for the molding temperatures.
Heat transfer between the boundaries of the polymer substrate, the mold insert, and the substrate plate were defined as thermal conductivity in the numerical analysis as represented in Equation 2. Equation 2 defines the heat transfer rate between objects in thermal contact:
qcond¼−Ccond∂∂T
X ð2Þ
where qcond is the heat flux generated by conduction,
Ccond is the thermal conductivity coefficient, and ∂∂TX is the temperature gradient.
The effect of heat transfer between the environment and the polymer substrate was considered by convection as presented in Equation 3. Equation 3 defines convec-tion cooling as the heat transfers relative to the differ-ence in temperatures between the polymer substrate and the environment:
dqconv
dt ¼h A T tð ð Þ−TenvÞ ¼h AΔTð Þt ð3Þ
where qconv is the heat transfer associated with convec-tion, h is the heat transfer coefficient, A is the surface
area, T is the substrate temperature, Tenv is the
tem-perature of the environment, and ΔT(t) is the
time-Figure 1Schematic of hot embossing setup and the finite element model for the cooling process of hot embossing. (a)Schematic of the hot embossing setup and(b)finite element model for the cooling process of hot embossing.
dependent thermal gradient between the environment and the polymer substrate.
A schematic of the hot embossing setup and the finite element model for numerical analysis are shown in Figure 1. Figure 1a represents the typical hot embossing configuration for simulation. The cooling process of the hot embossing was modeled as a non-isothermal and axis-symmetric system as shown in Figure 1b. A mold insert had hemisphere-tipped holes corresponding to a hemisphere-tipped post. The alignment structure, a hemisphere-tipped post, had a depth of 952μm and a ra-dius of 500μm.
The mold insert, the aluminum plates, and the platens were considered as rigid bodies. The polymer substrate was considered an elasto-plastic body. Heat exchange
boundaries were included to the mold insert, aluminum plates, and polymer substrate to allow heat transfer between thermal contacts and the environment. It was assumed that the polymer flows identically in any cross-sectional area on theX- andY-planes. A non-slip condition was applied on the bottom surface of the polymer substrate.
The simulation model included 9,700 four-nodal ele-ments for the polymer substrate. The element size
de-creased from 250 to 25 μm as the polymer substrate
reached the boundary of the hemisphere-tipped hole. During cooling, the mold temperature was decreased from 150°C to 85°C. A cooling time of 900 s was consid-ered in the numerical simulations.
Four radial locations of the post at 5, 10, 15, and 20 mm from the center of the mold insert were considered to evaluate whether the radial location of the post had an effect on the stress evolution as shown in Figure 2. The polymer substrate was assumed to completely fill the hemisphere-tipped hole. Thus, the cooling step will initiate from the as-sumption that the mold cavity is completely filled.
Experiments
A Carver thermal press (AutoFour/15-NE, Carver, Inc., Wabash, IN, USA) was used for hot embossing experi-ments. The mold insert, having hemisphere-tipped holes, Table 1 Material and process parameters in experiments
Material PMMA
Density (103kg/m3) 1.19
Tg (°C) 108
Embossing temperature (°C) 150
Cooling time (s) 900
Demolding temperature (°C) 85
was mounted at the center of the upper aluminum plate. The polymer substrate was placed on the lower alumi-num plate during molding. Poly(methyl methacrylate) (PMMA) sheets (Plexiglass®, Sabic Plastics, Shanghai, China) were selected as the substrate material. The thickness of PMMA was 4.5 ± 0.5 mm. The glass transi-tion temperature of PMMA is about 105°C. Prior to embossing, the polymer substrates were dried in a con-vection oven (31-350ER-1, Quincy Lab, Chicago, IL, USA) for 4 h.
Material and process conditions applied in the experi-ments are shown in Table 1. Molding temperature was 150°C ± 5°C, embossing force was 600 N, cooling time was 900 s, and demolding temperature was 85°C ± 5°C. Scanning electron microscopy (SEM; Helios NanoLab 400, FEI, Hillsboro, OR, USA) was used to take the image of molded structures.
Results and discussion
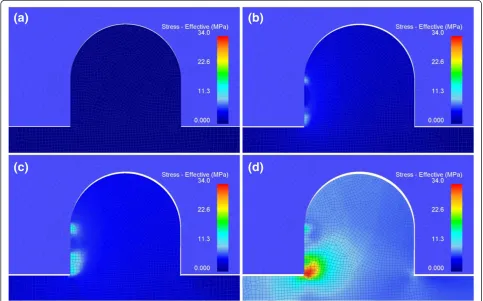
Numerical analyses were performed to investigate the stress evolution of the embossed post during cooling. The results of these analyses were represented by effect-ive stress of the molded posts at cooling times of about 1, 5, 10, and 55 s. Different colors represent the distribu-tion of effective stress of the post.
Figure 3 shows the stress of the post located 5 mm from the center of the part. The shrinkage of the part began from the top surface of the hemisphere-tipped post with the cooling of polymer as shown in Figure 3a. The stress in the post was developed along the left side-wall of the mold cavity at a cooling time of 5.1 s as shown in Figure 3b. The post was separated from the right side-wall of the mold cavity as the shrinkage of polymer in-creased. Figure 3c shows the stress concentration on both the top and bottom of the sidewall of the post with the cooling time of 10.6 s. The maximum stress of 33.3 MPa was observed in the vicinity of the bottom edge of the post following the direction of the thermal center when the cooling time was 56.1 s as shown in Figure 3d.
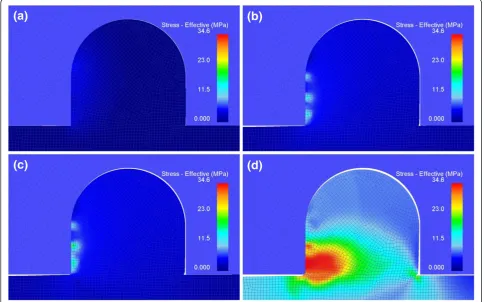
The stress developed in the post, located 20 mm along the radial direction of the part, is shown in Figure 4. The increase in radial distance of the post from the cen-ter induced a higher stress to push the post in the op-posite direction of the shrinkage of polymer. This caused the inclination of the post as shown in Figure 4d. The stress was concentrated on the left bottom edge and it expanded further into the post as the cooling time in-creased. This resulted in the undercut of the post at its bottom edges. The maximum stress of 34.6 MPa was es-timated at a cooling time of 55.5 s.
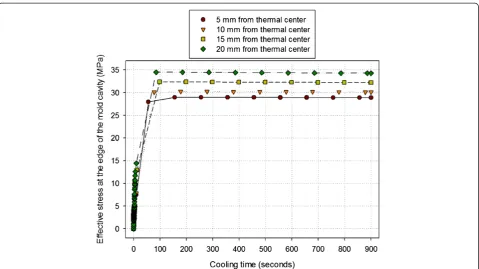
Figure 5 shows that the stress evolution of the post is significantly correlated with the radial locations of the post from the center of the embossed part during cool-ing. The stress of the post was estimated at the edge of the mold cavity. With the increase of the radial distance of the post, the stress increased. During the first 100.0 s into the cooling step, the accelerated heat loss caused el-evated effective stress on the embossed pattern. This could be explained by the thermal shrinkage generated during this period. Thermal shrinkage induced rapid in-crease of stress by pushing the embossed pattern into the left sidewall of the mold cavity due to the difference in thermal expansion between the mold insert and the polymer substrate. The maximum stresses were 28.9, 30.2, 32.3, and 34.5 MPa while the posts were located
at 5, 10, 15, and 20 mm from the center of the part, respectively.
From the numerical analysis, when the embossed part was cooled, it shrank from the edge toward the thermal center of the embossed part but the sidewall of a mold cavity contacting the post prevented its shrinkage. This caused thermal stress and stress concentration in the post. As the distance between the posts and thermal center increased, thermal stresses also increased since they were proportional to the amount of shrinkage of the embossed part.
Experiments were performed to validate the numerical analysis for the stress developed in the posts during cooling of hot embossing. However, the observation of cooling of the post is considered to be difficult since it
Figure 5Stress evolution of the post at the edge of the mold cavity.Located at 5, 10, 15, and 20 mm from the center of the part.
requires monitoring the polymer inside the hemisphere-tipped hole of the mold insert. However, the defect pre-dicted in numerical analysis can be used to validate the numerical models. The defect was observed using SEM. Figure 6 shows a SEM image of the embossed post. The undercut at the bottom of a post is evident as it was pre-dicted in Figure 4d.
Conclusions
The stress evolution in the cooling of hot embossing was investigated for the replication of microstructures. A numerical analysis was performed to study the stress de-veloped in the hemisphere-tipped post during cooling. Finite element models, using DEFORM-2D, predicted stress concentration at the bottom edge of the post. The results of the analysis showed that the maximum stresses were 28.9, 30.2, 32.3, and 34.5 MPa while the posts were located at 5, 10, 15, and 20 mm from the center of the part, respectively. The stress rapidly increased until the cooling time reached about 100.0 s. As the radial dis-tance of the post from the thermal center increased, thermal stresses also increased. Hot embossing experi-ments were conducted to validate the numerical models. The undercut at the bottom of a post is observed as it was predicted in the numerical analysis. The developed models were applicable to the design of the cooling process of micro hot embossing.
Competing interests
The authors declare that they have no competing interests.
Authors’contributions
JAG carried out the numerical analysis, designed micro hot embossing experiments, and participated in the analysis of results for the manuscript. DL assisted experimental testing and manuscript revisions. I-HS participated in the design and coordination of micro hot embossing experiments. BHY conceived the study and drafted the manuscript. All authors read and approved the final manuscript.
Received: 5 May 2014 Accepted: 26 September 2014
References
Matthew, ED, & David, EH. (2011). Analysis and characterization of demolding of hot embossed polymer microstructures.Journal of Micromechanics and Microengineering, 21, 085024.
Song, Z, You, BH, Lee, J, & Park, S. (2008a). Study on demolding temperature in thermal imprint lithography via finite element analysis.Microsystem Technologies, 14, 1593–1597.
Jeong, J, Choi, Y, Shin, Y, Lee, J, Park, K, Lee, E, & Lee, S. (2002). Flow behavior at the embossing stage of nanoimprint lithography.Fibers and Polymers, 3, 113–119.
Guo, Y, Liu, G, Xiong, Y, & Tian, Y. (2007a). Study of the demolding process— implications for thermal stress, adhesion and friction control.Journal of Micromechanics and Microengineering, 17, 9–19.
Guo, Y, Liu, G, Xiong, Y, & Tian, Y. (2007b). Analysis of the demolding forces during hot embossing.Microsystem Technologies, 13, 411–415.
Song, Z, Choi, J, You, BH, Lee, J, & Park, S. (2008b). Simulation study on stress and deformation of polymeric patterns during the demolding process in thermal imprint lithography.Journal of Vacuum Science and Technology, 26, 598–605. Worgull, M, Hétu, JF, Kabanemi, KK, & Heckele, M. (2008). Hot embossing of
microstructures: characterization of friction during demolding.Microsystem Technologies, 14, 767–773.
Schift, H, Heyderman, LJ, Maur, MA, & Gobrecht, J. (2001). Pattern formation in hot embossing of thin polymer films.Nanotechnology, 12, 173–177. Worgull, M, Hétu, JF, Kabanemi, KK, & Heckele, M. (2006). Modelling and
optimization of the hot embossing process for micro- and nanocomponent fabrication.Microsystem Technologies, 12, 947–952.
Farshchian, B, Amirsadeghi, A, Hurst, SM, Kim, J, & Park, S. (2012). Demolding behavior in 3D molding: experimental and simulation studies.Journal of Micromechanics and Microengineering, 22, 115027.
You, BH, Chen, PC, Park, DS, Park, S, Nikitopoulos, DE, Soper, SA, & Murphy, MC. (2009). Passive micro-assembly of modular, hot embossed, polymer microfluidic devices using exact constraint design.Journal of Micromechanics and Microengineering, 19, 125025.
Jin, P, Gao, Y, Liu, T, Wang, Z, & Zhou, H. (2009). Simulation and experimental study on recovery of polymer during hot embossing.Japanese Journal of Applied Physics, 48, 06FH10.
Juang, YJ, Lee, LJ, & Koelling, KW. (2002a). Hot embossing in microfabrication. Part I: experimental.Polymer Engineering and Science, 42, 539–550. Juang, YJ, Lee, LJ, & Koelling, KW. (2002b). Hot embossing in microfabrication.
Part II: rheological characterization and process analysis.Polymer Engineering and Science, 42, 551–566.
doi:10.1186/s40712-014-0020-9
Cite this article as:Gomezet al.:Study on stress evolution in the cooling process of micro hot embossing.International Journal of Mechanical and Materials Engineering20149:20.
Submit your manuscript to a
journal and benefi t from:
7Convenient online submission 7Rigorous peer review
7Immediate publication on acceptance 7Open access: articles freely available online 7High visibility within the fi eld
7Retaining the copyright to your article