THE REMOVAL INVESTIGATION OF NONYLPHENOL ETOXILAT
SURFACTANTS IN ACTIVATED SLUDGE SYSTEMS
Batool Ahansazan1, Baharan Moazenipour2
1 Departmen of Chemical Industries, Valiasr Technical College of Tehran, Sepah Str., Tehran, Iran, e-mail: [email protected]
2 Technical Faculty, University of Tehran, Enghelab Ave., Tehran, Iran, e-mail: [email protected]
INTRODOCTION
APEs have been significant surfactants for more than 50 years. The most joint APE in mer
-cantile use today is the group of nonylphenol ethoxylates (NPEs), comprising about 80 per
-cent of the market, while octylphenol ethoxyl
-ates (OPEs) contain most of the remaining 20 percent of the market. NPEs are used primarily for industrial applications, including pulp and paper production, textile structure, and use in the Volume 15, No. 3, July 2014, pp. 1–5
DOI: 10.12911/22998993.1109111 Research Article
ABSTRACT
The most significant source of environmental pollution derived from perilous wastes is the circumstantial and intentional emancipation of specific industrial wastes in -cluding resistant and/or toxic pollutants to natural environments. Although, biological treatment methods have been commonly found as most effective alternatives in the re -moval of persistent compounds in industrial wastewaters, they require some increase for obtaining acceptable removal efficiencies, due to the presence of refractory or toxic compounds in the wastewaters. In this study, the use of surfactant of nonylphe -nol ethoxylates (NPE) in the removal of persistent organic pollutants by biological treatment processes was investigated as an enhancement technique. The application of surfactants can enhance soil and groundwater remediation by increasing contaminant locomotion and solubility to ameliorate the performance of practical conventional remediation technology and by barricading the departure of contaminants to speed the rate of biodegradation of contaminants in environment. The proven effectiveness of surfactants in soil and groundwater remediation has been considered reasonable to expect that surfactants can also enhance the removal of persistent organic pollutants in wastewaters. Different concentrations of nonylphenol ethoxylates (NPE) (1000, 1500, 2000 ppm) were tested to optimize biosurfactant-enhanced degradation of per -sistent pollutants in wastewaters. The results of this study demonstrate that the bio -degradation of persistent organic pollutants in wastewaters is elevated by the use of biosurfactants. The principal mechanism that raises the biodegradation is the augment solvability of poorly soluble compounds in the wastewater. According to the results of this study, it can be anticipated that biosurfactant-enhanced degradation would result in faster and more complete degradation.
Keywords: nonylphenol ethoxylates, surfactants, treatability, activated sludge sys -tems, COD.
Received: 2014.02.21 Accepted: 2014.06.06 Published: 2014.07.01
formulation of crop protection chemicals. They are also used in industrial, institutional, and homemaker cleaners and detergents. While NP is used primarily as a raw material in the genera
Environmental issues arising from NP
The US Environmental Protection Agency (US EPA) has recently consummated ambient aquatic life water modality criteria for nonylphe
-nol (NP) [US EPA, 2005]. These criteria were expanded under Section 304(a)(1) of the Clean Water Act and indicate the concentration of NP in water at which aquatic life are safe from acute and chronic adverse effects. The US EPA has counsel an acute freshwater touchstone of 28 μg/L and a chronic freshwater criterion of 6.6 μg/L for NP. For saltwater, the proposed sharp and chronic cri
-teria are 7.0 μg/L and 1.7 μg/L.
Environmental Fate of APEs and NPE
Biodegradation is the overcoming removal process for APEs and NPE in water, settlement and soil. The biodegradation of APEs and NPE has been palmate studied for the past 50 years in a diver
-sity of laboratory studies that have searched both primary and final degradation. Accurate screening tests that measure the ready biodegradability of different APEs and NPE, laboratory modeling tests of potential degradation in specific environmental compartments, and field confirmation studies show that NPE and APEs are extensively biodegraded in surface waters, alluvium, and soil. Collectively, the data from these tests indicate that NPE and APEs, and their degradation moderator are not forestalled to be persistent in the environment.Removal yield for laboratory scale semi-continuous or batch acti
-vated sludge and continuous flow acti-vated sludge systems are generally over 90 percent.
Investigations accomplished in this Topic
A collation of the definitive biodegradability (transformation of organic carbon to CO2) of AE
and NPE was manufactured in an improved Sturm test [Sturm, 1973]. Habituate activated sludge cultures from the AE and NPE units were incu
-bated with 50 mg/l surfactant and the rate of CO2 formation measured over 14 days at 25 °C. AE was quickly and extensively oxidized to 70–75% of the theoretical C02 yield. Organic carbon from the NPE ethoxylate, however, was metabolized to 25–30% of the theoretical CO2 yield during the same period headings should not be indented).
Studies by Yoshimura [1986], and Stephanou and Giger [1982] have also shown that waste wa
-ter sewage from act NPE-type surfactants are ex
-tremely toxic (e.g.,LC50 – 48 hours) to fish and
Daphnia in the presence of residual ethoxylate (5– 10 mg/l), nonylphenol ethoxyacetate metabolites (9–10 mg/l) and nonylphenol (0.15–0.3 mg/l).
MATERIALS AND METHODS
Experimental system
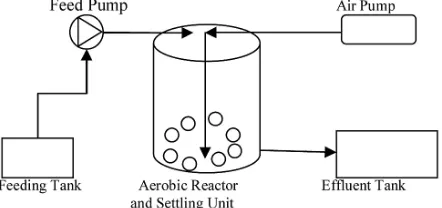
A schematic diagram of the experimental set
-up is showed in Figure 1. A continuously stirred tank reactor (CSTR) was used in the experimental study. Volume of the aerobic reactor was 4 liter. The influent wastewater was continuously fed through the top of the reactor by a feed pump and the reactor was aerated by an air pump. The efflu
-ent from the precipitation tank was collected in an effluent tank.
Figure 1. A schematic diagram of the activated sludge bioreactor used in experimental studies
Preparation of activated sludge
A mixed culture was used in the aerobic re
-actors. The activated sludge culture was received from the wastewater treatment plant of Oil Na
-tional Company in Tehran, Iran. The aerobic reac
-tor was inoculated with this culture. The constitu
-ents of wastewater used throughout the studies are given in Table 2. Whilst the main substrate requirement is for carbon, the growth also de -Table 1. Acronyms of Alkylphenol Ethoxylates and
their derivatives
Compound or Chemistry Acronym
Alkylphenol ethoxylates APE
Alkylphenol AP
Alkylphenol ether carboxylates APEC
Carboxylated alkylphenol ether carboxylates CAPEC
Nonylphenol ethoxylates NPE
Nonylphenol NP
Octylphenol OP
pends on the intake of nitrogen and phosphorus. The optimum ratio of C:N:P in the mixed liquor is generally thought to be 100:5:1. The ratio of these nutrients in settled domestic sewage is vari
-ously reported as 100:17:5 or as 100:19:6. This indicates that nitrogen and phosphorus will not be limiting for growth. Trace ingredients, which in
-clude S, Na, Ca, Mg, K, and Fe are also required, and are available in plenty in domestic sewage. By contrast, wastewater from brewing, pulp and paper, and food-processing industries can be defi
-cient in nitrogen and phosphorus. Nutrients there
-fore need to be added to the mixed liquor to re
-ceive maximum bacterial growth and to optimise carbonaceous treatment. From an operational point of view, lack or insufficiency of a critical nutrient may result in incomplete treatment, be
-cause the bacteria are unable to grow optimally. Phosphor, Nitrogen, Carbon and Oxygen are required that were added every day. In the starting test, first and second day the sludge settling time was two hours then collected the dead cells. On the third day sludge feeding began. The amount of feed was equal to glucose 7.5 g/day, Ammoni
-um phosphate 0.34 g/day and Ammoni-um nitrate 0.93 g/day. The feeding was done for a week. So the culture was ready for testing.
Table 2. Inorganic constituents of microorganismos
Chemical Compounds Percent
MgO 8
K2O 6
Fe2O3 1
P2O5 50
SO2 15
Na2O 11
CaO 9
Experimental procedure
Four reactors with the same structure and vol
-ume, as explained above, were used in parallel tests. Experiments were start up batchwise. Acti
-vated sludge from wastewater treatment plant was added to the reactors as seed. The similar value of sludge was inoculated in four parallel reactors. The test reactors (R1, R2 and R3) contained bio
-surfactant. The NPE biosurfactant concentration were added to R1, R2 and R3 respectively: 1000, 1500, 2000 ppm. In the control reactor (R4), the feed water did not contain any surfactant in or
-der to specify the effect of surfactant. Each of the test series dissolve in distilled water and make up 1 litter. All of the reactor was aerated by an air pump. These conditions were Fixed for the en
-tire duration of the experiment. The temperature and pressure were 25 0C and 625 mmHg and pH
adjusted to 7. A schematic diagram of the experi
-mental setup is showed in Figure 2.
Figure 2. Schematic diagram of the experimental setup
RESULT AND DISCUSSION
A set of experiments were performed in three different surfactant concentration, for two weeks. The method was based on measurements of Amer
-ican Public Health Association (APHA), 1998. The rate of MLSS and MLVSS of activated sludge in the experimental period is shown in Fig
-ure 3. When sludge age was increased for 14 days, MLSS and MLVSS ratio were increased 2605 to 2805 mg/l and 2555 to 2780 mg/l respectively.
COD removal efficiency with the increase of residence time as shown in Table 3. At the 3 days, COD removal efficiencies was from 5.19% to 48.24 in R1, it was from 7.61% to 48.91 in R2 and 8.14 to 34.89% in R3. Reduction was observed in the first week, equal to97.49% in R1,90.58% in R2 and 84.69% in R3. Although,in this period at R1 and R2 greater amount from COD were elimi
-nated, in the last, the overall results show that the highest COD decrease was in R3.
Figure 4 depicts a shift of COD volumetric re
-moval rates with over time. Sharp slope increase in COD volumetric removal rate with the time in R1, R2 and R3 because of high decreases in COD concentrations occurs in the first 7 days. After that, the removal rate is linearly. The results show, decline slope in the R1 and R2 is more than R3. But at the end of the test, the maximum removal occurs at the highest concentration.At the end of two weeks, more than 98% of COD removal was observed in R3 with concentration Equivalent 2000 ppm NPE
Figure 4. The effect of surfactant concentration on COD volumetric removal rates in the test reactors
CONCLUSIONS
In this paper, the authors investigate the im
-pact of NPE at activated sludge system and COD removal in conventional systems of biological treatment. Increasing the concentration of surfac
-tant would lead to treatment plant efficiency en
-hance. Also the results showed that increasing the
concentration of solids MLSS makes the removal efficiency increase.
According to the results of this study, it can be completely proven by further investigations that biosurfactant-enhanced degradation would result in prompter (reduced treatment times) and modified water quality, and overall cheaper treatment costs.
The interaction between biosurfactant and the pollutants in wastewater is a very complex phe
-nomenon and is not the subject of this study. But it is possible to say that biosurfactants are very effective in the COD removal as demonstrated in this study. So, the effectiveness of different biosurfactants in the removal of more pollutants should be investigated in the future studies in or
-der to distinguish the best combination.
REFEENCES
1. American Public Health Association (APHA), 1998. Standard methods for the examination of water and wastewater, 20th ed.
2. Stephanou E. and Giger W. 1982. Persistent organ -ic chem-icals in sewage effluents. 2. Quantitative determinations of nonylphenols and nonylphenol ethoxylates by glass capillary gas chromatographs. Environ. Sci. Technol. 76,
3. Sturm R.N. 1973. Biodegradability of nonionic surfactants: Screening test for predicting rate and ultimate biodegradation. J. Amer. Oil. Chem. SOC. 50, 159-167.
4. Yoshimura K. 1986. Biodegradation and fish tox -icity of nonionic surfactants. J. Amer. Oil Chem. SOC. 63, 1590-1596.
5. Ahel M., Giger W., Koch M. 1994. Behaviour of Al -kylphenol Polyethoxylate Surfactants in the Aquatic Environment – I. Occurrence and Transformation in Sewage Treatment. Water Res., 28, 5, 1131-1142. 6. Alkylphenols & Ethoxylates Research Council 2006.
Alkylphenols and Alkylphenol Ethoxylate Product Uses, Washington, DC.
7. Clara M., Kreuzinger N., Strenn B., Gans O., Kroiss H. 2005. The Solids Retention Time – a Suitable Design Parameter to Evaluate the Capac -ity of Wastewater Treatment Plants to Remove Mi -cropollutants. Water Res., 39, 97-106.
8. DiCorcia A., Samperi R., Marcomini A. 2000. Oc -currence and Abundance of Dicarboxylated Me -tabolites of Nonylphenol Polyethoxylate Surfac -tants in Treated Sewages. Environ. Sci. Technol., 34, 3914-3919.
9. Drewes J.E., Hemming J., Ladenburger S.J., Schauer J., Sonzogni W. 2004. An Assessment of Table 3. Comparison of operational parameters of the
reactors with different surfactant concentration
Reactor Run SRT COD Removal
(day) Efficiency (%)
R1 Run 1 1 5.19
Run 2 3 48.24
Run 3 7 97.49
Run 4 14 97.78
R2 Run 1 1 7.61
Run 2 3 48.91
Run 3 7 90.58
Run 4 14 97.42
R3 Run 1 1 8.14
Run 2 3 34.89
Run 3 7 84.69
Endocrine Disrupting Activity Changes in Water Reclamation Systems Through the Use of Bioas -says and Chemical Measurements. Proceedings of the 77th Annual WEFTEC Conference, New Or -leans, LA, 1, 77-88.
10. Fauser P., Vikelsoe J., Sorenson P.B., Carlsen L. 2003. Phthalates, Nonylphenols and LAS in an Alternately Operated Wastewater Treatment Plant – Fate Modeling Based on Measured Concentra -tions in Wastewater and Sludge. Water Res., 37, 1288-1295.
11. Fujita M., Ike M., Mori K., Kaku H., Sakaguchi Y., Asano M., Maki H., Hishihara T. 2000. Behaviour of Nonylphenol Ethoxylates in Sewage Treatment Plants in Japan Biotransformation and Ecotoxicity. Water Sci. & Technol., 42, 7-8, 23-30.
12. Johnson A.C., Aerni H.-R., Gerritsen A., Gibert M., Giger W., Hylland K., Jurgens M. Nakarni, T., Pickering A., Suter M. J.-F., Svenson A., Wet -tstein F.E. 2005. Comparing Steroid Estrogen and Nonylphenol Content Across a Range of European Sewage Plants with Different Treatment and Man -agement Practices. Water Res., 39, 47-58.
13. Klecka G., Zabik J., Woodburn K., Naylor C., Staples C., Huntsmann B. 2006. Exposur Analy -sis of Alkylphenol, Alkylphenol Ethoxylates, and their Metabolites in Surface Water Systems within the United States: Comparison to US EPA Water Quality Criteria. Final Report for Alkylphenols and Ethoxylates Research Council (APERC); The Dow Chemical Company, Midland, MI.
14. Lee H-B., Peart T.E. 1998. Occurrence and Elimi -nation of Nonylphenol Ethoxylates and Metabo -lites in Municipal Wastewater and Effluents. Water Qual. Res. J. Canada, 33 (3), 389-402.
15. Nasu M., Goto M., Kato H., Oshima Y., Tanaka H. 2001. Study on Endocrine Disrupting Chemicals in Wastewater Treatment Plants. Water Sci. & Tech -nol., 43 (2), 101-108.
16. Naylor C.G. 1992. Environmental Fate of Alkyl
-phenol Ethoxylates. Soap/Cosmetics/Chemical Specialties, 68, 27-32.
17. Shao B., Hu J., Yang M. 2003. Nonylphenol Eth -oxylates and Their Biodegradation Intermediates in Water and Sludge of a Sewage Treatment Plant. Bull. Environ. Contam. Toxicol., 70, 527-532. 18. Staples C., Mihaich E., Carbone J., Woodburn K.,
Klecka G. 2004. A Weight of Evidence Analysis of the Chronic Ecotoxicity of Nonylphenol Ethoxyl -ates, Nonylphenol Ether Carboxyl-ates, and Nonyl -phenol. Human Ecol. Risk Assess., 10, 999-1017. 19. U.S. Environmental Protection Agency 2005.
Aquatic Life Ambient Water Quality Criteria – Nonylphenol. U.S. Environmental Protection Agency Report 822-R-05-005, Washington, DC. 20. Zahn R., Wellens H. OECD Guideline for Testing
of Chemicals. Adopted by the Council on 17th July 1992.
21. Cserhati T., Forgaces E., Oros G. 2002. Biological activity and environmental impact of anionic sur -factants. Environ. Int., 28, 337-348.
22. Fauser P., Vikelsoe J., Sorensen P.B., Carlsen L. 2003. Phathalates, nonylphenols and LAS in an alternately operated wastewater treatment plant – fate model -ing based on measured concentrations in wastewater and sludge. Water Research, 37, 1288-1295. 23. Maguire R.J. 1999. Review of the persistence of
nonylphenol and nonylphenol ethoxylates in aquatic environments. Wat. Qual. Res. J. Can., 34(1), 37-78. 24. Bizukojc E.L., Bizukojc M. 2006. Effect of select
-ed anionic surfactants on activat-ed sludge flocs. Enzyme and Microbial Technology, 39, 660-668. 25. Yang K., Zhu L., Xing B. 2007. Sorption of sodium dodecylbenzene sulfonate by montmorillonite. En -vironmental Pollution, 145, 571-576.