Author for correspondence:
Volume-5 Issue-2
International Journal of Intellectual Advancements
and Research in Engineering Computations
P-wave estimation using DWT
Syeda Adiba Rehaman
1, P. Rajeswari
2ABSTRACT
This paper focuses on estimation of the P-wave, based on 12 lead standards ECG, which will be applied to the detection of patients prone to diseases (atrial flutter, hyperkalaemia, hypokalaemia and atrial fibrillation). The noise is removed using Bandpass filter and P-wave is isolated and a set of parameters, which have the ability to detect patients prone to diseases, is calculated from it. The method has been validated using ECG-recordings of 250 patients with a wide variety of P-wave morphologies from JSS Database. The P-wave method detects the diseases that occur when the P-wave is abnormal.
Keywords:
Electrocardiogram, P wave, Wavelet Transform, Discrete Wavelet TransformINTRODUCTION
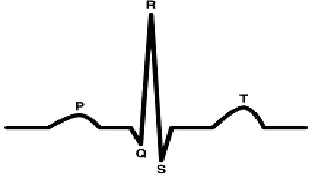
The Electrocardiogram is the contraction and relaxation of heart muscles generated when the atria and ventricles are repolarized and depolarized. It varies from person to person depending on the age, body weight position and various other factors that gives us information about persons heart rate, rhythm etc. ECG is important since heart diseases constitute one of the major causes of mortality in the world. The ECG is characterized by a sequence of P, QRS and T wave associated with each beat. The P wave is always before QRS complex and is separated by PQ interval. It is caused by atrial depolarization. The duration of P-wave is 110ms
and the positive wave always is at the lead I an II whereas negative is always at VR lead. The wavelet transform based technique can be used to identify the characteristic features of the ECG signal to obtain reasonably good accuracy with the presence of high frequency and low frequency noises. A number of techniques have been used by researchers to detect the characteristics in ECG [1]. We use dyadic wavelet transform approach because of its localization properties and fast calculations. Discrete Wavelet Transform (DWT) can be used as a good tool for analyzing non-stationary ECG signal as wavelet transform has been proven to be useful tool for non-stationary signal analysis.
Fig. 1: An ECG waveform
The Wavelet Transform decomposes signal into family of wavelets. Wavelets can be symmetric or asymmetric in shape. Recently, wavelets have been
applied to numerous problems in Electrocardiology, including data compression, analysis of ventricular late potentials, and the
detection of ECG characteristic points. The WT for evaluating higher frequencies and for lower frequencies uses a short and long time interval respectively.
Discrete Wavelet Transform (DWT) can be used as a good tool for analyzing non-stationary ECG signal as wavelet transform has been proven to be useful tool for non-stationary signal analysis.
Fig. 2: Block diagram of DWT filter analysis
METHODOLOGY
In order to extract information from the ECG signal, the raw ECG signal should be processed.
ECG signal processing can be roughly divided as shown in Fig. 3.
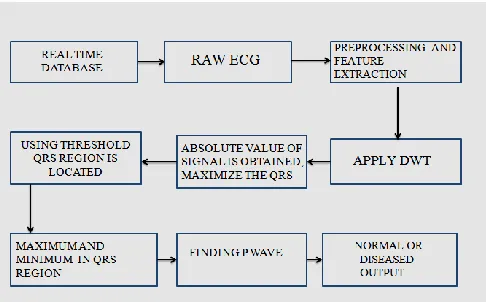
Fig. 3: Structure of ECG Signal Processing
The ECG signal is collected from JSS Hospital, Mysuru. The signal is read using EDFbrower software. The data is preprocessed and features are extracted. A Feature Extraction method using Discrete Wavelet Transform (DWT) was proposed by Emran et al [2]. DWT is applied on the features extracted and we obtain wavelet co-efficients. There are four wavelet co-efficients and we select the co-efficient that gives values related to Pan-Tompkins algorithm. From the co-efficients we get maximum and minimum values which are used to locate P-wave. Once we achieve P-wave, we check for the diseases involved that is if the P-wave is abnormal.
Pre-processing
Feature Extraction and DWT
The Feature Extraction stage extracts diagnostic information from the ECG signal. It provides us the features extracted using DWT such as approximate, horizontal, diagonal and vertical. The DWT of a
signal is calculated by passing it through a series of filters, first the samples are passed through a low pass filter with impulse response g (Eq.1.1) and then it is passed through high pass filter h (Eq.1.2). The output gives wavelet coefficient values such as approximate, diagonal, vertical and horizontal.
y[n]=(x_g)[n]=∑ [ ] [ ] (1.1)
However, since half of the frequencies are removed the other half are discarded using Nyquists rule. The filter output of the low-pass filter h is then subsampled by 2 and further
processed by passing it again through a new low-pass filter h1 and a high-low-pass filter h2 with half the cut-off frequency of the previous one, i.e:-
ylow[n]=∑ [ ] [ ] (1.2)
yhigh[n]=∑ [ ] [ ] (1.3)
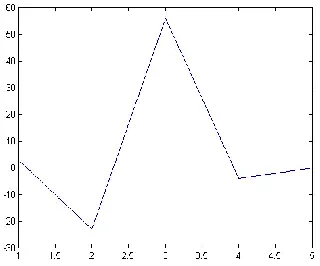
Fig. 4: Coefficient values
Detection of P-Wave
The ECG signal obtained is contaminated generally by different sources of noises that can disrupt the phase and the amplitude characteristics of the useful signal, where there is necessity of a good filtering [5]. We apply a band pass filter [6] to eliminate the noises caused by the breathing, the movements of muscles and the baseline. This filter is the combination of a low pas filter and a high pass filters. The two are based on a sampling rate of 256 Hz [7].
In general, the normal ECG means that there is a regular normal rhythm and waveform. However, the ECG rhythm of the patient with arrhythmia will not be regular in certain QRS complexes. Therefore, we find the characteristics that help us to obtain a perfect ECG waveform. We first need to find the location of every QRS complex. The
Fig. 5: P-wave detection after applying DWT
RESULT AND CONCLUSION
ECG signals required for analysis are collected from JSS Hospital, Mysuru. The database contains 250 records. The methods were developed under Matlab software.
In this paper, we present an algorithm based on WT for the detection of P waves of ECG. ECG characteristic points based on WT shows the potential of the WT especially for processing
time-varying biomedical signals. The power of WT lies in its multiscale information analysis which can characterize a signal very well. It is clear that the WT method will lead to a new way of biomedical signal processing.
The P-wave detected checks the range of the disease and converts into frequency value and gives a normal signal or diseased name as an output.
Fig. 6: Displaying disease
Furthermore, ECG signal is a life indicator, and can also be used as a tool for liveness detection. People have similar but different ECG. The physiological and geometrical differences of the heart in different individuals display certain uniqueness in their ECG signals. Hence ECG will be used as a Biometric tool for Identification and Verification of Individuals.
Acknowledgement
REFERENCES
[1]. J. Pan and W. J. Tompkins, “A real-time QRS detection algorithm”, IEEE Trans. Biomed. Eng., 32, 1985, 230– 236.
http://dx.doi.org/10.1109/TBME.1985.325532
[2]. E. M. Tamil, N. H. Kamarudin, R. Salleh, M. Yamani Idna Idris, M. N. Noorzaily, and A. M. Tamil, “Heartbeat electrocardiogram
(ECG) signal feature extraction using discrete wavelet transforms (DWT)”, in Proceedings of CSPA, 2008,
1112–1117.
[3]. Saritha, V. Sukanya, and Y. Narasimha Murthy, “ECG Signal Analysis Using Wavelet Transforms”, Bulgarian
Journal of Physics, 35, 2008, 68-77.
[4]. S. Z. Mahmoodabadi, A. Ahmadian, and M. D. Abolhasani, “ECG Feature Extraction using Daubechies Wavelets”, Proceedings of the fifth IASTED International conference on Visualization, Imaging and Image
Processing, 2005, 343-348.
[5]. McNames, J. (2005) Optimal Rate Filters for Biomedical Point Processes. 27th Annual International Conference of the Engineering in Medicine and Biology Society, Shanghai, 17-18 January 2006, 145-148. http://dx.doi.org/10.1109/iembs. 2005, 1616363.
[6]. Li, C., Zheng, C. and Tai, C. Detection of ECG Characteristic Points Using Wavelet Transform. IEEE Transactions on Biomedical Engineering, 42, 1995, 21-28. http://dx.doi.org/10.1109/10.362922
[7]. Khelil, B., Kachouri, A. and Ben Messaoud, M. Nouvelle Tendance Technologiques en Génie Electrique et Informatique. Springer, New York. 2006.
[8]. Lee, J., Jeong, K., Yoon, J. and Lee, M., “A Simple Real-Time QRS Detection Algorithm”, 18th Annual International Conference of the IEEE Engineering in Medicine and Biology Society, Amsterdam 1996.
[9]. J.S. Sahambi, S.N. Tandon, R.K.P. Bhatt, “Using wavelet transforms for ECG characterization”, IEEE Eng. Med. Biol., 16(1), 1997, 77–83.