INTRODUCTION
A growing interest in the renewable energy use was observed in the 1990s. It is estimated that since then, the solar and wind power utilisation has increased fourfold and eightfold, respectively. The wind power industry is the most rapidly de-veloping power industry branch in the world. The development of the utilisation of energy gener-ated from renewable sources is an important part of every country’s power industry-, ecology- and climate-related policy. The Treaty of Accession signed by Poland obliged the country to achieve the 7.5% share of energy generated from renew-able sources in the national utilisation of gross energy in 2010. Pursuant to Directive 2008/0016 (COD), further increase in the use of renewable energy sources will have to continue until 2020 (Gąsiorowska et al. 2009). The power industry-related policy assumes that stable mechanisms of supporting the use of renewable energy sources are to be maintained. The document contains the entries concerning the necessity of introducing
the solutions which improve the cooperation between wind power plants and the national electrical power engineering system. It also as-sumes that the analysis of possibilities of wind power generation in the Baltic Sea coastal area will be conducted. The ‘Programme for Electri-cal Power Engineering created on 27th March 2006, confirms the need to increase the renew -able energy generation capacity. The document mentions the necessity to maintain support, in the form of the so-called ‘green certificates’, as well as to increase the financial support for new renewable energy investments (www.ekoefekt.pl/ dokumenty/dokument_13.pdf).
Wind power plants are located onshore and offshore, individually or in groups, forming the so-called wind farms (parks) (Lubośny, 2007). Wind power plants operate at wind speeds of 3.5 to 25 m/s (Wolańczyk, 2013). The nominal output is obtained at the wind speed of 12–16 m/s, which is quite considerable as far as the Polish conditions are concerned. The largest Polish power plants and wind farms are predominantly situated in the Accepted: 2019.01.10 Available online: 2019.01.22 Volume 20, Issue 3, March 2019, pages 167–171
https://doi.org/10.12911/22998993/99780
Wind Power as a Renewable Energy Source
Elżbieta Radzka
1*, Katarzyna Rymuza
1, Anna Michalak
11 Faculty of Natural Sciences, Siedlce University of Natural Sciences and Humanities, ul. Prusa 14, 08-110 Siedlce,
Poland
* Corresponding author’s e- mail: elzbieta.radzka@uph.edu.pl
ABSTRACT
The work presents a description of wind speed and direction in terms of using wind power as a renewable energy
source. The wind power in Poland and at the Zawady EF was characterised. Observations were collected from 2002 to 2006 by an automatic meteorological station installed at the Zawady Experimental Farm (EF). Average monthly and yearly frequencies of winds blowing from individual directions were determined, and the average monthly wind speed was analysed. The most frequently recorded wind speed ranged from 2 to 4 m/s (light wind), and the least frequent winds blew at the speed of more than 10 m/s (strong wind). The cold season of the year saw winds blowing at the greatest speed (December, January and February), it being the lightest in the summer months (June, July and August). Wind rose analysis (2002–2006) revealed that at Zawady Experimental Farm, the west-erly wind was the most frequent. A wind turbine has a limited capacity of wind power use, so only a small portion of energy supplied by wind may be converted into usable energy.
areas with the most favourable wind-related con-ditions, that is in Pomeranian, West Pomeranian, and Warmia- Masuria Voivodeship.
Long-term wind measurements demonstrate that wind speed and direction reveal specific, sometimes quite regular 24-hour and yearly vari-ation patterns. Wind speed is usually the lowest at night; it increases in the early morning, assumes the highest values in the afternoon and decreases afterwards. In Poland, the seasons of the year determine yearly wind speed distribution. In the spring, and in the autumn-winter period, wind speed is the highest, whereas in the summer, it is quite low (Jąderko and Kowalewski 2015, Wiśniewski et al. 2012).
Wind power in Poland
Inexhaustible sources and easy utilisation of wind power resources led to many European coun-tries using this method of electricity production. In addition to individual standalone wind power plants, wind farms − wind power-generating units − are built. In order to predict, plan and design various operational aspects associated with a wind
farm, detailed knowledge on the characteristics of wind conditions is necessary (Soliński, 1999).
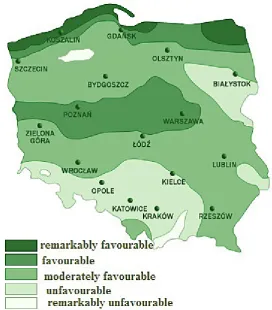
According to the Institute of Meteorology and Water Management (IMGW), around 60% of the area of Poland has the conditions which are con-ducive to wind power technology development.
The largest and the most favourably locat-ed clusters of wind power plants in Poland are found on the coast of the Baltic Sea (Fig. 1). The coastal wind conditions have got a great poten-tial which is best used by modern efficient wind power plants employing the newest technologies applied to generate large amounts of ecological-ly-friendly energy, free of harmful by-products (Jabłoński and Wnuk, 2004). Other areas which are attractive in terms of wind power production include the Kaszuby Coast (from Koszalin to Hel) − 5–6 m/s, the Suwałki region − 4.5–5 m/s, the Isle of Uznam − 5 m/s and the central parts of Greater Poland and Mazovia regions − 4–5 m/s/
According to Jabłoński and Wnuk (2004), regional and local factors need to be taken into consideration when one wants to fully utilise the wind power potential, roughness and the land to-pography, i.e. the local factors, and geographical
location – the regional factor. Land roughness may be determined by means of observations or the data collected from measurement masts. Wind speed is also affected by the land topog -raphy, building pattern and type of surface. The best land for this type of construction is grassy, forestless and without land obstacles. Every ob-stacle may severely hinder wind speed and causes turbulences (Gołębiowska et al. 2013). An en -ergetic wind level in a selected area depends on e.g.: average yearly wind speed, roughness and of the land topography, altitude, wind speed and air parameters (temperature, pressure, humidity) at the level of the axis of turbine rotor.
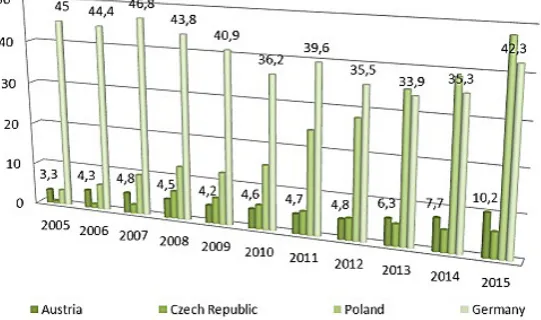
The analysis of percentage share of wind power-derived electricity production demonstrat-ed that out of the countries studidemonstrat-ed, Germany is the leader (Fig. 2). In 2007, as much as 46.8% electricity in this country was produced from wind power. Poland is also developing the wind power sector at a rapid speed.
Evaluation of wind power as a renew-able energy source was also based on five-year (2002–2006) observations of wind direction and speed, measured by an automatic meteo-rological station of Siedlce University of Natu-ral Sciences and Humanities set up at Zawady Experimental Farm.
The following parameters describing wind were analysed:
• wind direction,
• wind speed in a vertical profile,
• wind speed fluctuations in time.
On the basis of the values for the aforemen-tioned parameters, the average monthly and
average yearly frequency of winds blowing form individual directions were determined. Moreover, the average 24-hour and monthly wind frequen-cies and speed (averaged across 1h) were record-ed at the height of 10 m (the height at which the wind speed indicator is placed).
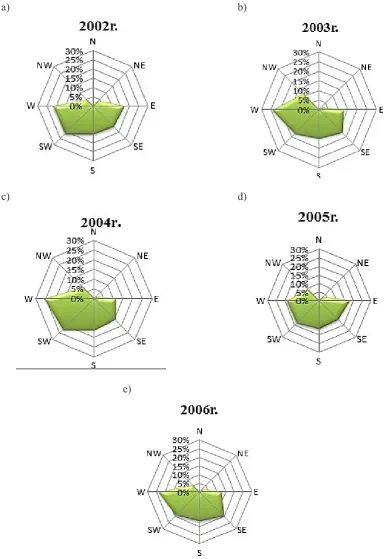
On the basis of an analysis of average yearly wind directions, it was found that at Zawady Ex-perimental Farm in 2002–2006, the predominant wind direction was westerly (from 19% in 2005 to 26% in 2004) and south-westerly (from 17% in 2003 to 23% in 2004) (Fig. 3). The southerly and south-westerly winds occurred with a frequency of around 15%. In all the study years, no northern wind was recorded.
An average frequency of wind directions for individual months is presented in fig. 4. Westerly wind was recorded most frequently. The frequen-cy of this wind direction was 30% in January and December, 29% in June and 28% in February. In the remaining months, it fluctuated around 20%, and in April and August, the respective values of this parameter were 16% and 17%. The south-westerly wind was predominant in March, Au-gust and September (respectively, 23%, 19% and 20%) whereas in April, May and September, the wind predominantly blew from the south-easterly direction (respectively, 22%, 24% and 28%), and from the South in October (24% frequency).
The highest average values of the wind speed were recorded in the cold season, and they ranged from 3.6 m/s in November to 4.2 m/s in Decem -ber. The warm season saw lower wind speeds. In September, the monthly value of this parameter was 2.5 m/s whereas in July and August, the val-ues were 2.6 m/s and 2.7 m/s, respectively.
CONCLUSIONS
1. In economic terms, renewable energy sources are viewed as an investment in the future soci-ety development. Rational management of the energy derived from renewable sources plays a major role in sustainable development. If the share of renewable energy sources in the fuel
and energy balance increases substantially, it will result in an improvement in the natural environment status, conservation of natural re-source use, reduced release of pollutants into the atmosphere and reduction in the amount of waste production. Wind power is the kinetic energy of wind used to produce electric energy by wind power plants. The potential of wind
a) b)
c) d)
e)
power plants is determined based on their ca-pacity to generate electric energy. For Poland, the share of renewable energy in the final use of gross energy has been established to be at the level of 15%.
2. An analysis (2002–2006) demonstrated that the westerly wind was the most often recorded direction at Zawady Experimental Farm. Ob-servations of yearly values of wind speed indi-cate that the predominant wind speeds ranged from 2 to 4 m/s (light wind). The least frequent wind speeds were in the range of over 10 m/s (strong wind). The largest number of days with the usable wind speed (≥ 4 m/s) was noted in 2004, (105 days). In turn, 2006 saw the larg-est number of days with the non-usable wind speed (4 m/s).
3. Winter tends to be the season when the largest number of cases of the highest wind speed is recorded (December, January and February), whereas the summer months (June, July, Au-gust and September) have got the largest num-ber of cases with low wind speed.
4. The analysis of the whole study period (2002–2006) showed that 473 days (26%) had usable wind speed (≥ 4 m/s) and 1314 days (74%) had a non-usable wind speed (< 4 m/s). 5. In planning and designing of wind power
sta-tions, one needs to take into account the loses occurring when mechanic energy is converted into electric energy, as well as the fact that a wind turbine has a limited capability of using wind power. As a result, only a small portion of the energy supplied by wind may be converted
into usable energy. Further development of the wind energy technology in Poland will necessi-tate the support of work on Polish technologies and stronger acceptance of wind energy tech-nology by the society.
REFERENCES
1. Gąsiorowska E., Piekacz J., Surma T. 2009. Euro -pean Union energy policy versus climate change.
Energy Policy Journal, Volume 12, Issue 1, PL
ISSN 1429–6675.
2. Gołębiowska U., Deluga W., Mickiewicz b., Zien
-kiewicz P., Krużewski W., Katewicz E. 2013.
Material supporting realisation of the programme
‘Renewable Energy Sources’. Koszalin.
3. Jabłoński W., Wnuk J., 2004. Renewable energy
sources in the energy policy of the European Union
and Poland. Efficient investment management −
case studies. Sosonowiec.
4. Jąderko A., M. Kowalewski K., 2015. Calcula -tion of wind parameters in renewable power
en-gineering, Przegląd Elektrotechniczny, R. 91, No. 1/2015. ISSN 0033–2097.
5. Lubośny Z., 2007. Wind power plants in the elec
-trical power engineering system, Scientific and
Technical Publishers, Warsaw.
6. Wiśniewski G., Michałowska – Knap K., Koć S.,
2012. Wind power engineering – current status and and development prospects in Poland, Institute for Renewable Energy, Warsaw.
7. Wolańczyk F., 2013. Wind power plants, KaBe Publisher, Krosno.
8. www.ekoefekt.pl/dokumenty/dokument_13.pdf