Process Parameters Optimization of Needle-punched
Nonwovens for Sound Absorption Application
Mlando Mvubu, Asis Patnaik, Rajesh D. Anandjiwala
CSIR Materials Science and Manufacturing and Department of Textile Science, Nelson Mandela Metropolitan University, Port Elizabeth SOUTH AFRICA
Correspondence to:
Rajesh D. Anandjiwala email: [email protected]
ABSTRACT
This paper reports a study on the optimization of process parameters of needle-punched nonwoven fabrics for achieving maximum sound absorption by employing a Box-Behnken factorial design. The influence of fiber type, depth of needle penetration, and stroke frequency on sound absorption properties were studied. These parameters were varied at three levels during experimental trials. From multiple regression analysis, it was observed that the depth of needle penetration alone was the most dominant factor among the selected parameters, which was followed by the interaction between depth of needle penetration and stroke frequency. Fiber type was the least dominant parameter affecting sound absorption. A maximum sound absorption coefficient of 0.47 was obtained from the selected parameters. The results showed that for a process such as needle-punching, which is influenced by multiple variables, it is worthwhile to study the interactive effects of process parameters for achieving optimum sound absorption.
Keywords: Needle-punching, nonwovens, sound absorption, optimization
INTRODUCTION
High levels of noise emission are one of the major health concerns affecting human life. One of the ways to mitigate the propagation of noise and its adverse effects is to use a sound absorption medium. Needle-punched nonwoven fabrics are one of the most commonly used sound absorbing media.
For the needle-punched nonwoven fabrics employed for sound insulation, many parameters influence the ability of the fabric to be a good sound absorber, in most cases the effect of these parameters is studied by varying each parameter individually [1-13]. This, however, does not provide complete information since studying these parameters individually overlooks the interactive effects of these parameters and in some cases even leads to contradictory conclusions as reported in published literature [1-13].
Thilavagathi et al. [4] reported development of natural fiber nonwoven fabrics for acoustic absorption applications in car interiors. They studied sound insulation and other properties of needle-punched nonwoven fabrics made from natural fibers (banana, bamboo and jute) blended with
polypropylene. They found that a
bamboo/polypropylene nonwoven provided the highest sound absorption coefficient for all levels of sound frequencies.
Kucuk and Korkmaz [7] studied the effect of bonding, thickness, fiber composition and air permeability on sound absorption properties of various nonwoven fabrics. They found that thermal bonded nonwoven fabrics made from a blend of natural and synthetic fibers provided better sound absorption properties than a commercial needle-punched nonwoven fabric made from meta-aramid fibers. Composite nonwoven fabrics produced by thermal bonding of cotton and polyester fibers provided exceptional sound absorption properties, as compared to composite nonwoven fabrics produced from wool and bi-component polyester fibers. In this work, the interaction effects of all the parameters were not adequately studied; instead, they varied only two parameters at a time.
Yilmaz et al. [10] studied effects of porosity, fiber fineness, and layering sequence on sound absorption performance of needle-punched nonwoven fabrics. Their results indicated that air flow resistivity increased with decrease in fiber diameter and porosity. A strong relationship between the layering sequence and air flow resistivity was also observed. They also did not study the interaction effect explicitly.
plain, velour, and cordand the punch densities were 30, 60, 90, and 105 (per cm2). They found that plain surface fabrics generally have a higher sound absorption as compared to the velour and cord. Sound absorption increased with the increase in punch density up to 90/cm2, then it decreased (from 90 to 105 cm2), however, no attempt was made to study the interaction effect in this work.
Sengupta [13] studied the effect of area density, fabric type, source intensity, number of layers, distance of fabric from the receiver, and fiber type on sound absorption of various needle-punched nonwoven fabrics. In this work too, a number of factors were studied but reported individually.
To overcome this problem of misleading
interpretations, it is necessary to study the individual and interactive effects of different parameters simultaneously. Response surface methodology, which incorporates design of experiments, is very useful in studying the effects of multiple variables simultaneously [14]. The advantage of such a method is that the effect of various parameters can be known quantitatively and qualitatively together with their interaction effects. This method also allows for the prediction of the optimized region involving simultaneous effects of various parameters. Box-Behnken factorial design is one such tool that can be used to study the simultaneous influence of multiple parameters [14]. There are few published studies available today about the interaction effects of needle-punching parameters on sound insulation properties by using such a factorial design method.
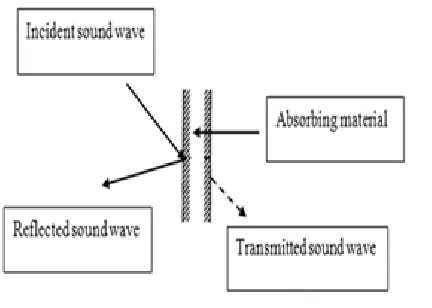
Therefore, the aim of this work is to study the effect of needle-punching process parameters and their interactive effects to achieve maximum sound absorption. The parameters studied are fiber types, depth of needle penetration, and stroke frequency. A Box-Behnken factorial design with three variables, each varied at three levels (-1, 0, +1), was selected for the experimental work. The sound absorption co-efficient of the samples was measured according to the ASTM E 1050-2010 standard on an LMS acoustic testing instrument [16] consisting of a horizontal impedance tube, two microphones and a digital frequency analyzer. When a sound wave is incident on a material, it can be absorbed, reflected, and transmitted by the material. All three phenomena are possible depending upon the type of material, as shown in Figure 1. Absorbing the incident sound wave is an effective way to control noise propagation.
FIGURE 1. Principle of measuring sound absorption.
A sound source was mounted at one end of the impedance tube and the material was placed at the other end, as shown in Figure 2. The loud speaker generates a broadband of stationary random sound waves. These incident sound waves propagate as plane waves in the tube and hit the sample surface. The reflected wave signals are picked up and compared to the incident sound waves. A transfer function method was used for calculating the noise absorption of a material, which is expressed as the sound absorption coefficient (α) as given by:
100 ] 1
[ − ×
=
soundwave incident
of Frequency
soundwave reflected
of Frequency
a
EXPERIMENTAL DETAILS
All samples were produced using a needle-punching process which involves formation of a web by a carding machine followed by smooth layering on a cross lapper before consolidation through needle punching. Flax, hemp and agave fibers were blended with polyester (PET) fibers in equal proportions (50%-50%) by weight. The reason for blending with PET was to enhance the structural integrity of the final fabrics.
All the natural fibers were cottonized by a two-pass process on a pre-opener (unbundling) and cottonizer of Temafa machine. The fiber dimensions together with their corresponding coefficient of variation (CV) are shown in Table I.
TABLE I. Fiber dimensions with CV in parentheses.
Fiber Length (mm) Fineness
(dtex)
Agave 95 (22%) 16.8 (16%)
Flax 62 (49%) 10.2 (87%)
Hemp 60 (49%) 12.5 (92%)
PET 60 6.6
Fiber type, depth of needle penetration and stroke frequency were varied at three coded levels (-1, 0, +1). Table II shows coded levels and actual values of these three variables. Each fiber type (blended with PET) resulted in four samples, plus three control samples (produced on three different days) made from a hemp/PET blend. A total of 15 samples, at the same area weight of 1000 g/m2, were produced.
All samples were conditioned for 24 hours prior to testing in a standard testing atmosphere maintained at 65±2% relative humidity and 20±2ºC temperature.
TABLE II. Levels of parameters for design of experiment.
-1 0 1
Fibers Hemp Flax Agave
Needle depth (mm) 4 7 10
Stroke frequency (/min) 250 300 350
Levels Parameters
The samples were tested for acoustic properties. The normal incidence sound absorption coefficient (α) was measured according to the ASTM E 1050-2010 standard test method for impedance and absorption of acoustical materials using a tube, two microphones, and a digital frequency analyzer [15]. The LMS acoustic testing instrument operated at a frequency
range of 50-5700Hz was used for the measurement of acoustic properties. Five readings were taken randomly from each sample for the acoustic measurement. The area weights of the samples were measured according to ASTM D 3776 on an electronic balance [17]. Area weight is defined as the mass per unit area and usually measured in g/m2 (or gsm). Five random measurements were carried out for each sample.
RESULTS AND DISCUSSION
Sound Absorption and Response Surface Function
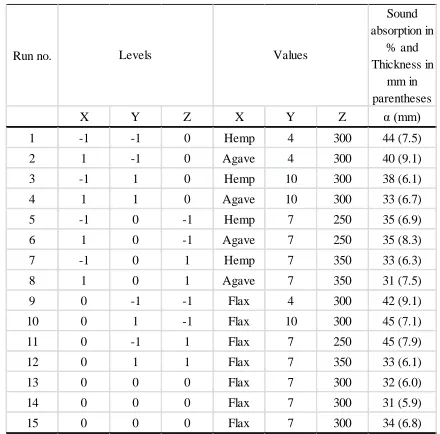
The average sound absorption co-efficient measured (50-5700 Hz) for each sample along with the coded and actual values of parameters is shown in Table III. These values were compared to a commercial needle-punched fabric with comparable properties.
All experimental samples showed higher sound absorption values than that of the commercial sample (α = 0.28). The commercial reference sample consists of a blend of polyester (PET) and recycled shoddy fibers, which are currently used in automotive carpets for acoustic insulation by most local automotive manufacturers. The nonwoven fabrics made from blends of flax/PET fibers provided better results than the other two blends which may be attributed to the lower fineness of flax fibers compared to agave and hemp fibers.
TABLE III. Levels and actual values of parameters for different experimental combinations along with average sound absorption coefficient.
Run no.
Sound absorption in
% and Thickness in
mm in parentheses
X Y Z X Y Z α (mm)
1 -1 -1 0 Hemp 4 300 44 (7.5)
2 1 -1 0 Agave 4 300 40 (9.1)
3 -1 1 0 Hemp 10 300 38 (6.1)
4 1 1 0 Agave 10 300 33 (6.7)
5 -1 0 -1 Hemp 7 250 35 (6.9)
6 1 0 -1 Agave 7 250 35 (8.3)
7 -1 0 1 Hemp 7 350 33 (6.3)
8 1 0 1 Agave 7 350 31 (7.5)
9 0 -1 -1 Flax 4 300 42 (9.1)
10 0 1 -1 Flax 10 300 45 (7.1)
11 0 -1 1 Flax 7 250 45 (7.9)
12 0 1 1 Flax 7 350 33 (6.1)
13 0 0 0 Flax 7 300 32 (6.0)
14 0 0 0 Flax 7 300 31 (5.9)
15 0 0 0 Flax 7 300 34 (6.8)
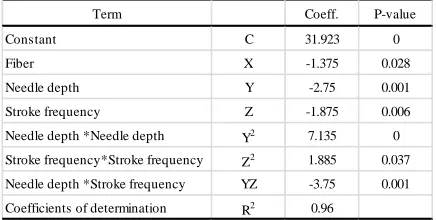
By multiple regression analysis, coefficients of parameters (fiber type, depth of needle penetration, and stroke frequency) and significance probability (P-value) were calculated, as shown in Table IV. The statistical significance of probability, P-value, at a 95% confidence interval was tested. If less than 0.05 then the parameter has a significant effect on sound absorption and vice versa. From Table IV, it is observed that all the selected parameters showed a significant effect on measured sound absorption. As evident from the co-efficient value, the depth of needle penetration played a dominant role among all the selected parameters. The interaction between depth of needle penetration and stroke frequency showed the second largest impact (absolute value). The fiber type played the least impactful role in determining sound absorption properties. For evaluating a complete picture on the role of different parameters and their interaction effects on sound absorption, a response surface methodology was employed.
TABLE IV. Analysis of variance for three parameters (fiber type, needle depth, and stroke frequency), probability (P-value), and correlation coefficient.
Term Coeff. P-value
Constant C 31.923 0
Fiber X -1.375 0.028
Needle depth Y -2.75 0.001
Stroke frequency Z -1.875 0.006
Needle depth *Needle depth Y2 7.135 0
Stroke frequency*Stroke frequency Z2 1.885 0.037
Needle depth *Stroke frequency YZ -3.75 0.001
Coefficients of determination R2 0.96
The response surface equation for sound absorption is given by:
YZ C Z C Y C
Z C Y C X C C
23 2 33 2 22
3 2 1 0
+ +
+ + + + = a
(1)
Where α is the coefficient of sound absorption and C is the coefficient of the particular variable. After substituting relevant values, we obtain the following equation with coefficient of determination, R2 value, of 0.96.
YZ Z
Y
Z Y
X
75 . 3 2 885 . 1 2 135 . 7
875 . 1 75 . 2 375 . 1 923 . 31
− +
+ −
− −
= a
(2)
Response Surfaces of Sound Absorption as a Function of Selected Parameters and Process Optimization
The response surfaces of sound absorption as a function of different levels of selected parameters and optimized regions are discussed in this section. The different cases have been considered as per the statistical significance and dominance of the selected parameters in achieving maximum possible sound absorption.
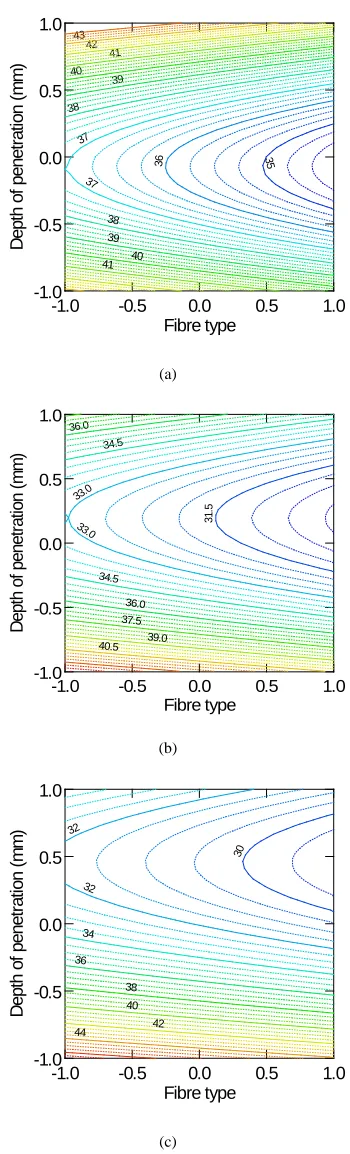
Response Surfaces of Sound Absorption as a Function of Depth of Needle Penetration and Stroke Frequency for Different Fiber Types
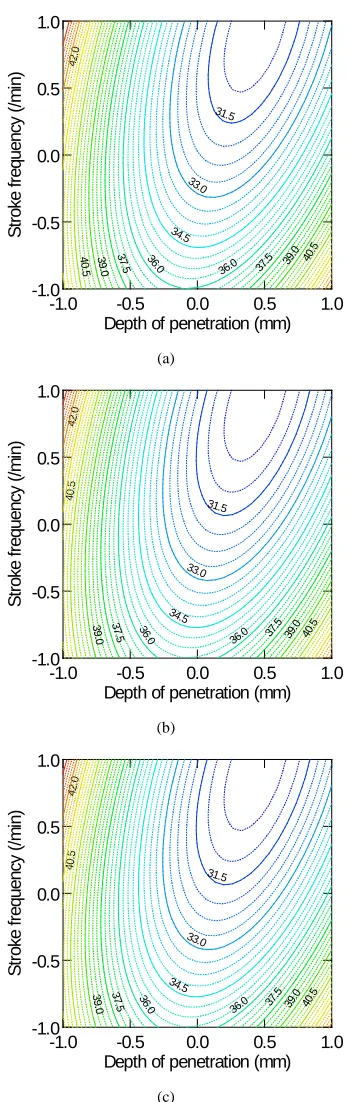
From Table IV, it is observed that depth of needle penetration shows the most dominant effect followed by the interaction between depth of needle penetration and stroke frequency. Figure 3 shows the response surface plots of the interaction effect between different levels of depth of needle penetration and stroke frequency for different fiber types (hemp, flax and agave) on sound absorption coefficients.
For hemp fibers, an interaction effect between depth of needle penetration and stroke frequency on sound absorption at different levels is shown in Figure 3(a).
The values of the sound absorption coefficient at -1 level (4mm), 0 level (7mm), and +1 level (10mm) of depth of needle penetration were 41%, 36%, and 42%, respectively. It can be observed that with the increase in depth of needle penetration from -1 (4mm) to 0 (7mm) levels, the sound absorption coefficient decreased by 12%, however, it increased by 17% when depth of needle penetration is increased from 0 level (7mm) to +1 level (10mm).
frictional resistance, thereby increasing the sound absorption coefficient.
The values of the sound absorption coefficient at -1 (250/min), 0 (300/min) and +1 levels (350/min) of stroke frequency were 41%, 41% and 43.5%, respectively, as shown in Figure 3(a). With the increase in stroke frequency from -1 level (250/min) to 0 levels (300/min), no change in sound absorption coefficient was observed, and when stroke frequency increased from 0 level (300/min) to +1 level (350/min) only a modest increase of 6% was observed. The trend is similar for the other two fibers, where between -1 level (250/min) and 0 level (300/min) of stroke frequency, little change (a slight decrease of 3.5% and 5% for flax and agave fibers, respectively) in the sound absorption coefficient and then a modest increase between 0 level (300/min) and +1 level (350/min) of stroke frequency. This general trend is similar to that observed above in the case of depth of needle penetration. This also confirms that the effects of depth of needle penetration and stroke frequency are interlinked in determining the resultant fabric structure (Table IV). Furthermore, the levels of stroke frequency selected in the present set of experiments may not be high enough to cause significant variations in the sound absorption coefficient.
Maximum sound absorption of 0.45 is achieved for flax fibers at -1 level (4min) of depth of needle penetration and +1 level (350/min) of stroke frequency which corresponds to experimental trial run 11 (Table III).
-1.0 -0.5 0.0 0.5 1.0
Depth of penetration (mm) -1.0
-0.5 0.0 0.5 1.0
S
tr
o
ke f
requ
en
cy
(
/m
in
)
31.5
33.0
34.5
36.0
36.0
37.
5 37.5
39.
0 39.
0 4
0.
5 40.
5 42.
0
(a)
-1.0 -0.5 0.0 0.5 1.0
Depth of penetration (mm) -1.0
-0.5 0.0 0.5 1.0
S
tr
o
ke f
requ
en
cy
(
/m
in
)
31.5
33.0
34.5 36.
0 36.0
37.
5 37.5
39.
0 39.
0 40.
5
40.5
42. 0
(b)
-1.0 -0.5 0.0 0.5 1.0
Depth of penetration (mm) -1.0
-0.5 0.0 0.5 1.0
S
tr
o
ke f
requ
en
cy
(
/m
in
)
31.5
33.0
34.5 36.
0 36.0
37.
5 37.5
39.
0 39.
0 40.
5
40.5
42. 0
(c)
Response Surfaces of Sound Absorption as a Function of Fiber Type and Depth of Needle Penetration for Different Values of Stroke Frequency
The second case of the interaction effect is that of different fiber types and different levels of depth of needle penetration on sound absorption at different levels of stroke frequency, namely 250/min, 300/min, and 350/min.
The response surface of fiber type and depth of needle penetration at 250/min stroke frequency is shown in Figure 4(a). The values of percentage sound absorption coefficient at -1, 0, +1 levels of fiber types (hemp, flax, and agave) were 43%, 42% and 40.5%, respectively. For hemp and flax fibers, a smaller difference (2.3%) in the sound absorption coefficient was observed as compared to agave fibers where the difference with respect to hemp fibers was 6% and the difference between flax and agave fibers was 3.6%. This can be due to the fact that flax and hemp fibers have similar fineness as compared to agave fibers which are considerably coarser than the other two. Yilmaz et al. [10] and Tascan and Vaughn [11] showed that nonwoven fabrics made from finer fiber absorbs sound better than those made from coarser fibers.
With the increase in depth of needle penetration from -1 level (4mm) to 0 level (7mm), the sound absorption coefficient decreased from 43% to 37%, which accounts for a 14% decrease, but as the depth of needle penetration increased from 0 level (7mm) to +1 level (10mm), sound absorption coefficient increased again from 37% to 45%, which accounts for a 22% increase. This trend is similar to that observed in the previous section. When considering the other stroke frequencies (300 and 350/min), the contour plots of the interaction effect of fiber types and levels of depth of needle penetration on the sound absorption coefficient, a similar trend was observed, (see Figure 4(b) and Figure 4(c))
The combined influence of fiber type, depth of needle penetration and stroke frequency on sound absorption showed that -1 level fiber type (hemp), -1 level depth of needle penetration (4mm) and +1 level of stroke frequency (350/min) provided a maximum sound absorption of 47%. Therefore, the optimized region, most likely, lies below this region.
-1.0 -0.5 0.0 0.5 1.0
Fibre type -1.0
-0.5 0.0 0.5 1.0
D
ep
th
of
p
ene
tr
at
ion
(
m
m
)
35
36 37
37
38 38
39 39
40 40
41 41 42 43
(a)
-1.0 -0.5 0.0 0.5 1.0
Fibre type -1.0
-0.5 0.0 0.5 1.0
D
ep
th
of
p
ene
tr
at
ion
(
m
m
)
3
1.
5
33.0
33.0
34.5 34.5
36.0 36.0
37.5 39.0 40.5
(b)
-1.0 -0.5 0.0 0.5 1.0
Fibre type -1.0
-0.5 0.0 0.5 1.0
D
ep
th
of
p
ene
tr
at
ion
(
m
m
)
30
32 32
34
36
38 40
42 44
(c)
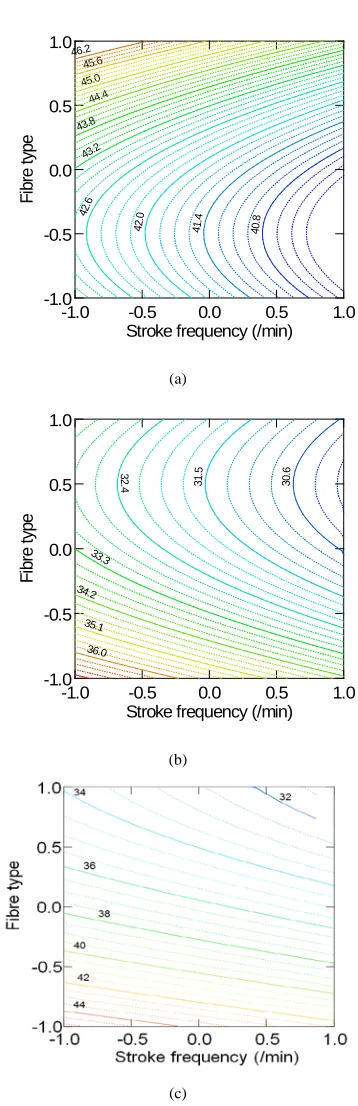
Response Surfaces of Sound Absorption as a Function of Stroke Frequency and Fiber Type at Different Depths of Needle Penetrations
The last case of the interaction effect is that of stroke frequency and different fiber types on the sound absorption coefficient at different levels of depth of needle penetration (see Figure 5). Stroke frequency was the second most important individual parameter after depth of needle penetration, however, fiber type was the least important and no significant interaction between stroke frequency and fiber type was observed as shown in Table III. In order to assess a complete response surface design, this effect needs to be evaluated.
The interaction effect between levels of stroke frequency and fiber types at 4mm depth of needle penetration is shown in Figure 5(a). At -1 (250/min), 0 (300/min) and +1 levels (350/min) of stroke frequency, the sound absorption coefficient was 43%, 42%, and 40%, respectively. When the stroke frequency is increased from -1 (250/min) to 0 levels (300/min) a 2% decrease in the sound absorption coefficient was observed and a further 5% decrease as stroke frequency increased from 0 to +1 levels (300/min to 350/min). This accounts for an overall decrease of 7% in the sound absorption coefficient as the stroke frequency increased from -1 level to +1 level (250/min to 350/min). The inverse relationship between stroke frequency and sound absorption may be described by the fact that higher stroke frequency results in a decrease in fabric thickness, however, not enough to allow for an increase in fabric density to affect sound absorption as discussed in the previous section. Also, the pore sizes may not have significantly changed so as to cause a drastic change in the sound absorption coefficient.
With the change in fiber type, from hemp to flax, then agave, the observed sound absorption coefficient was 43%, 43%, and 47%, respectively. Again, the same trend was observed where hemp and flax fibers showed similar sound absorption coefficients, but a 9% higher sound absorption coefficient in the case of agave fibers. However, at 7mm depth of needle penetration, the sound absorption coefficient was 33% for agave fibers which is similar to flax, but lower than that of hemp (37%), which is higher by 12%. At 10mm depth of needle penetration, for hemp, flax, and agave fibers, the sound absorption coefficients were 45%, 37.5%, and 34% respectively. Agave fibers perform better at lower depths of needle penetration than the other two fibers because of its longer fiber length, which results in a bulky nonwoven mat. Hemp performs better than the other two fibers at higher depth of needle penetration
because of the relatively compact fabric structure produced. This interaction between stroke frequency and fiber type did not prove to have any significant effect on sound absorption properties.
-1.0 -0.5 0.0 0.5 1.0
Stroke frequency (/min) -1.0
-0.5 0.0 0.5 1.0
F
ibr
e
t
ype
40. 8 41.
4
42. 0 42.
6 43.2
43.8 44.4 45.0
45.6 46.2
(a)
-1.0 -0.5 0.0 0.5 1.0
Stroke frequency (/min) -1.0
-0.5 0.0 0.5 1.0
F
ibr
e
t
ype
3
0.
6
3
1.
5
3
2.
4
33.3
34.2
35.1
36.0
(b)
(c)
CONCLUSION
Optimization of needle-punched process parameters using a Box-Behnken factorial design to achieve maximum sound absorption was investigated. Depth of needle penetration followed by the interaction effect between depth of needle penetration and stroke frequency played the most significant role among the selected parameters. However, fiber type was the parameter of least significance (among selected parameters). The combined influence of stroke frequency, fiber type, and depth of needle penetration showed that +1 level (350/min) of stroke frequency, -1 level of fiber type (hemp), and --1 level (4mm) of depth of needle penetration provided the highest sound absorption coefficient of 0.47 (47%).
REFERENCES
[1] Teli M.D., Pal A., Roy D. “Efficacy of nonwoven materials as sound insulators”, Indian Journal of Fiber Textile Research, Vol. 32, 2007, 202-206.
[2] Fouladi M.H., Ayub M.D., Nor M.J.M.
“Analysis of coir fiber acoustical
characteristics”, Applied Acoustics, Vol. 72, 2011, 35-42.
[3] Li J. “A Study on the relationship between the thickness of nonwoven and its sound absorption capability”, Modern Applied Science, Vol. 1, No 4, 2007, 74-76.
[4] Thilagavathi G., Pradeep E., Kannaian T., Sasikala L. “Development of natural fiber nonwovens for application as car interiors for noise control”, Journal of Industrial Textiles, Vol. 39, No 3, 2010; 267-278. [5] Koizumi T., Tsujiuchi N., Adachi A. “The
development of sound absorbing Materials using natural bamboo fibers, high performance structure and composites book”, WIT Press, 2002.
[6] Yang S., Yu W. “Air permeability and acoustic absorbing behavior of nonwovens”, Journal of Fiber Bioengineering and Informatics, Vol. 3, No 4, 2011, 204-208. [7] Kucuk M., Korkmaz Y.”The effect of physical
parameters on sound absorption properties of natural fiber mixed nonwoven composites” Textile Research Journal, Vol. 82, No 20, 2012, 2043-2053.
[8] Tascan M., Vaughn E. “Effects of fiber denier, fiber cross-sectional shape and fabric density on acoustical behavior of vertically lapped nonwoven fabrics”, Journal of Engineered Fibers and Fabrics, Vol. 3, No 2, 2008, 32 -38.
[9] Yilmaz N., Michielsen S., Banks-Lee P., Powell N. “Effects of material and treatment parameters on noise-control performance of compressed three-layered multi-fiber needle-punched nonwovens”, Journal of Applied Polymer Science, Vol. 123, 2011, 2095-2106.
[10] Yilmaz N., Banks-Lee P., Powell N., Michielsen S. “Effects of porosity, fiber size, and layering sequence on sound absorption performance of needle-punched nonwovens”, Journal of Applied Polymer Science, Vol. 121, 2011,3056–3069.
[11] Tascan M., Vaughn E. “Effects of total surface area and fabric density on the acoustical behavior of needle-punched nonwoven fabrics”, Textile Research Journal, Vol. 78, No 4, 2008, 289–296.
[12] Shahani F., Soltani P., Zarrebini M. “Sound absorption characteristics of needled nonwoven fabrics” in The International Istanbul Textile Congress, 2013.
[13] Sengupta S. “Sound reduction by needle-punched nonwoven fabrics”, Indian Journal of Fiber and Textile Research, Vol. 35, 2010, 237-242.
[14] Box G.E.P., Behnken D.W. “Some new three level designs for the study of Quantitative Variable”, Technometrics, Vol. 2, No 4, 1960, 455-475.
[15] ASTM 1050-2010, Standard test method for impedance and absorption of acoustical materials using a tube, two microphones and a digital frequency analyzer.
[16] LMS acoustic testing instrument, Instruction Manual, Leuven, 2011.
[17] ASTM 3776-1996, Standard test method for mass per unit area of fabric.
AUTHORS’ ADDRESES Mlando Mvubu
Asis Patnaik
Rajesh D. Anandjiwala
CSIR Materials Science and Manufacturing and Department of Science
Nelson Mandela Metropolitan University Port Elizabeth