R E S E A R C H
Open Access
Heterogeneity in general practitioners
’
preferences for quality improvement
programs: a choice experiment and policy
simulation in France
Mehdi Ammi
1*and Christine Peyron
2Abstract
Despite increasing popularity, quality improvement programs (QIP) have had modest and variable impacts on enhancing the quality of physician practice. We investigate the heterogeneity of physicians’ preferences as a potential explanation of these mixed results in France, where the national voluntary QIP – the CAPI – has been cancelled due to its unpopularity. We rely on a discrete choice experiment to elicit heterogeneity in physicians’ preferences for the financial and non-financial components of QIP. Using mixed and latent class logit models, results show that the two models should be used in concert to shed light on different aspects of the heterogeneity in preferences. In particular, the mixed logit demonstrates that heterogeneity in preferences is concentrated on the pay-for-performance component of the QIP, while the latent class model shows that physicians can be grouped in four homogeneous groups with specific preference patterns. Using policy simulation, we compare the French CAPI with other possible QIPs, and show that the majority of the physician subgroups modelled dislike the CAPI, while favouring a QIP using only non-financial interventions. We underline the importance of modelling preference heterogeneity in designing and implementing QIPs.
Keywords:General practitioners, Discrete choice experiment, Mixed logit, Latent class logit, Quality improvement programs, Policy simulation
JEL classification:I11, I18, C25
Highlights
We combine latent class and mixed logit models to study heterogeneity in general practitioners’
preferences elicited from a discrete choice experiment We demonstrate that general practitioners exhibit
substantive heterogeneity in preferences for quality improvement programs, notably for pay-for-performance
We show that the majority of physicians dislike the implemented pay-for-performance program, and would favour non-financial interventions
Background
Quality improvement programs (QIP) are an increasingly popular approach for enhancing the quality of physician practice in ambulatory care [1–3]. However, available evidence suggests that QIPs, whether they focus on or combine financial, non-financial or organizational com-ponents, have modest and variable impacts on quality of care [4–6]. Beyond methodological differences in the studies, this observed heterogeneity results from the target and design of the QIPs, as well as from variability in physicians’ responsiveness to the programs [7–10]. Within a single program, differences in physicians’ re-actions may be explained by differences in contextual constraints, as well as knowledge or attitudes regarding the QIP [9, 10].
* Correspondence:[email protected]
1School of Public Policy and Administration, Carleton University, River Building, 1125 Colonel By Drive, Ottawa, ON K1S 5B6, Canada Full list of author information is available at the end of the article
Physicians’preferences for QIP are particularly import-ant given that, in many cases, physicians’ participation is voluntary and, thus, necessary to ensure the success of the program. From 2009 to 2011, the French Statutory Na-tional Health Insurance implemented a voluntary QIP program (Contract for Improved Individual Practice – CAPI) aimed at general practitioners (GP), which com-bined pay-for-performance (P4P) and quarterly perform-ance feedback. While the program could only increase their income, only one-third of all French GPs had regis-tered a year and a half after the program’s implementation, and the program was subsequently cancelled due to its unpopularity1. While GPs’ethical concerns with the pro-gram design was one key explanation of the low take-up of the CAPI [11], a QIP better designed to meet physi-cians’work-related needs may have been more successful.
Health economists have thoroughly studied physicians’ preferences regarding their job characteristics [12, 13], sometimes accounting for preference heterogeneity [14–16]. Yet, no studies, to the best of our knowledge, have spe-cifically examined physicians’preferences for QIPs and their components. While recent studies have focused on designs of QIPs that would be effective irrespective of the targeted physicians [6, 17, 18], understanding these physicians’ preferences may allow for fine-tuning of the programs and improve acceptance. Moreover, understanding the heterogeneity of physicians’ prefer-ences about QIPs may help policymakers tailor and diversify their programs to better match the needs of their targeted population.
The objectives of this study are precisely to elicit het-erogeneity in physicians’preferences for the components
of QIPs; and by policy simulation, to compare the po-tential and differential impact on physician welfare of various QIPs, including the French CAPI. To do so, we conduct a discrete choice experiment (DCE) on a sam-ple of French GPs.
Methods
Data and the discrete choice experiment DCE design
Discrete choice experiments are widely used in the health economics literature to assess preferences [19]. Our study followed the recommended steps [20] as described below.
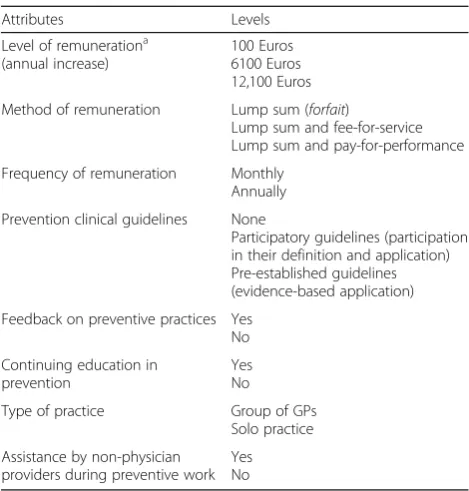
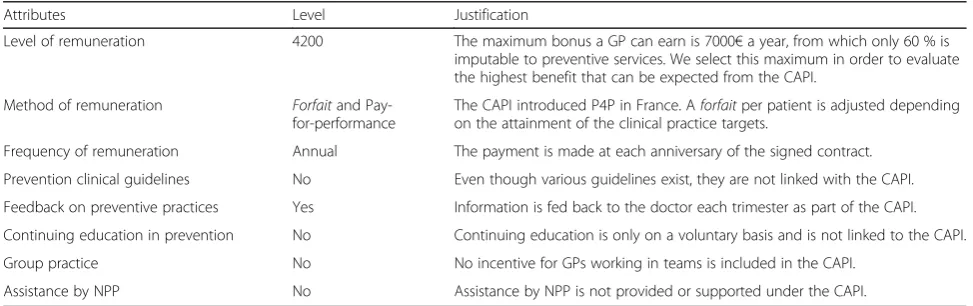
The first step of a DCE is to select the attributes of interest and their levels. We selected attributes based on a literature review on QIPs and on two criteria: sup-posed efficacy suggested by the literature and credibility of application in the French health care context (see Table 1). For concreteness, we focused on preventive care, a key quality indicator. Following the same two above criteria, a level for each attribute was defined to reflect the CAPI. The relevance of the list of attributes, of their number and of their levels was confirmed in a focus group of ten representative GPs [21]2. This led to a final list of eight attributes presented in Table 2.
The second step is to combine attributes into choice sets. Most of time, the combination relies on experi-mental plan theory since a full factorial design implies proposing too many choices to respondents [22]– 864 scenarios in our case. Using JMP software, we generated an orthogonal design [23] that resulted in 24 scenarios and achieved the properties of orthogonality and level balance. All other analyses are done with STATA. In order
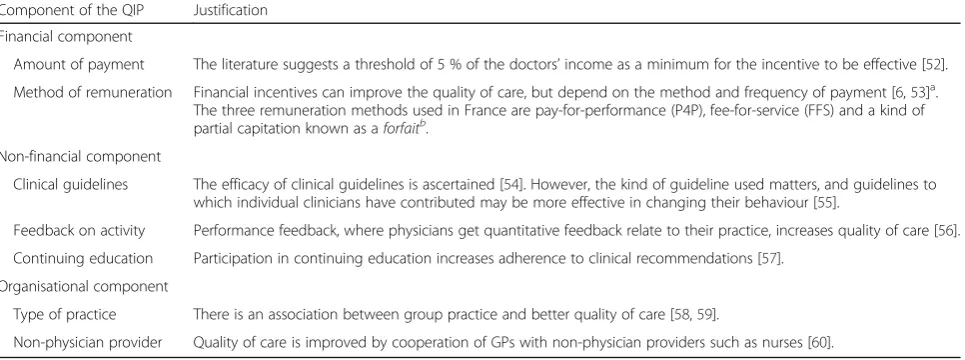
Table 1Interventions used in quality improvement programs for GPs
Component of the QIP Justification
Financial component
Amount of payment The literature suggests a threshold of 5 % of the doctors’income as a minimum for the incentive to be effective [52]. Method of remuneration Financial incentives can improve the quality of care, but depend on the method and frequency of payment [6,53]a.
The three remuneration methods used in France are pay-for-performance (P4P), fee-for-service (FFS) and a kind of partial capitation known as aforfaitb.
Non-financial component
Clinical guidelines The efficacy of clinical guidelines is ascertained [54]. However, the kind of guideline used matters, and guidelines to which individual clinicians have contributed may be more effective in changing their behaviour [55].
Feedback on activity Performance feedback, where physicians get quantitative feedback relate to their practice, increases quality of care [56]. Continuing education Participation in continuing education increases adherence to clinical recommendations [57].
Organisational component
Type of practice There is an association between group practice and better quality of care [58,59].
Non-physician provider Quality of care is improved by cooperation of GPs with non-physician providers such as nurses [60]. a
This point is subject to debate. Another study finds no effect of the frequency of P4P [61]. However, representative GPs in the focus group cited the importance of this attribute
b
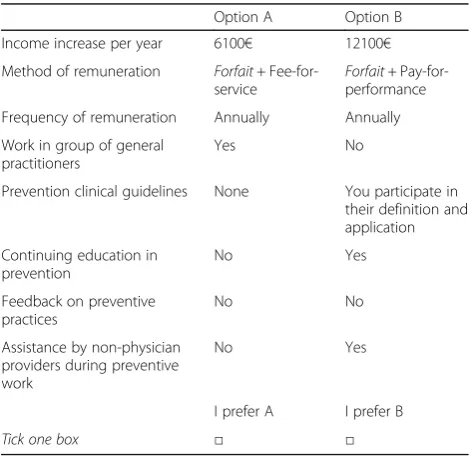
to facilitate respondents’choices, we relied on a common comparator selected from these 24 scenarios, ensuring that this reference scenario is not strictly dominant a priori [24]. Choice sets were constructed by pairs which resulted in 23 choices between pairs of combinations of quality interventions. The 23 choice sets were randomly divided into four blocks so that each respondent made 5 or 6 choices [25]3. To limit non-response and the
subsequent loss of statistical efficiency, we did not include an opt-out possibility. An example of choice set is pro-vided in Appendix 1.
Finally, the DCE was pilot tested with a focus group of self-employed GPs to validate the attributes phrasing and then pre-tested (n= 100 GPs) to verify that the reference scenario was not strictly dominant.
Data
The DCE questionnaire is composed of three parts. In the first part, questions regarding the GP’s opinion about health care reforms in general practice and the public health role of GPs are used as a warm-up. The second part is the choice experiment. The third part collects sociodemographic and professional information about each GP. The questionnaire is self-administered during the summer of 2009 in a postal survey with one repeated attempt for non-response.
The population under study consists of all the GPs in active practice in one French geographic region4 (N= 1368). After the pre-test, the questionnaires were sent to the 1268 remaining physicians. 303 questionnaires were returned completed, resulting in a response rate of 22 %. This response rate is consistent with other DCE studies [26–28] and with self-administered postal surveys to French general practitioners [29].
GPs working in a rural setting are slightly overrepre-sented in our sample (see Table 3). The responding GPs are also more active, with the weekly number of acts being significantly higher than the national mean5. With these exceptions, our sample compares well with the ref-erence population. Of course, our methodology does not allow for national representativeness.
With the exception of the level of remuneration, all attributes of the DCE are coded using “effects coding”
Table 2List of attributes and levels
Attributes Levels
Level of remunerationa (annual increase)
100 Euros 6100 Euros 12,100 Euros
Method of remuneration Lump sum (forfait)
Lump sum and fee-for-service Lump sum and pay-for-performance
Frequency of remuneration Monthly Annually
Prevention clinical guidelines None
Participatory guidelines (participation in their definition and application) Pre-established guidelines (evidence-based application)
Feedback on preventive practices Yes No
Continuing education in prevention
Yes No
Type of practice Group of GPs Solo practice
Assistance by non-physician providers during preventive work
Yes No
a
We retain three levels: 0, 5 and 10 %. It was not possible to propose a truly null amount, so an amount very close to zero was proposed. French physicians are not accustomed to thinking about their income in percentage terms, thus the payment attribute was proposed in raw of the average income (in euros) rather in relative terms (in percentage)
Table 3Descriptive statistics
Variables Sample
(N= 303)
Mean value in Bourgogne
Difference sample and regional (p-value)
Mean value in France Difference sample and national (p-value)
Age (mean) 51.5 51.2(a) 0.451 (n.s) 51.3(a) 0.588 (n.s.)
Gender (% of women) 27 % 30 %(c) 0.479 (n.s.) 31.2 %(b) 0.277 (n.s.)
Sector of activity (% in sector 1) 93.1 % 87.3 %(a) 0.485 (n.s.) 89.3 %(a) 0.623 (n.s.)
Rural practice (%) 44.5 % 33 %(d) 0.000 15.7 %(b) 0.000
Group practice (%) 47.5 % 39.6 %(d) 0.118 (n.s.) 44.5 %(b) 0.567 (n.s.)
Health network membership (%) 41.9 % 39 %(e) 0.496 (n.s.) Between 27 and 44 %
(5 French region)(e) Not determined
Weekly acts (mean) 119 102.8(a) 0.000 102.4(a) 0.000
In the absence of exhaustive and homogeneous data source on private practice self-employed GPs, the regional and national values are derived from different sources
a
All private practice GPs–2008 data–SNIIR–source: Eco-Santé France, Régions & Départements 2015–IRDES [63] (for the weekly activity, the number of annual acts has been divided by 46 weeks)
b
All private practice GPs–2009 data–ADELI–[64]
c
All private practice GPs–2009 data–SNIIR–[65]
d
Survey panel of five regions (panel de médecins généralistes libéraux DREES, URML, FNORS)–2007 data–[66]
e
[30]. We constructed the questionnaire in order to test the symmetry [31], the completeness and the continuity axioms [32]6 and found that the axioms are largely respected: totally for the first, and respectively by 82 % and 65 % of the respondents for the two other axioms. Following current practice, we kept all the responses for the analysis [32–34].
Econometric framework Modelling heterogeneity
The analysis of DCE data relies on classical choice models and random utility theory (RUT) [35]. When applying the DCE approach, the utility of an individual n choosing alternativeiat thetchoice situation can be written as
Unit¼Vnitþεnit
WhereVnit¼ X
k¼1 K
βkx0nitk is the deterministic part of
the utility (withkattributes), observable to the researcher and sometimes referred to as the indirect utility, and
εnitis the unobservable, stochastic part and is treated as random7. The individual will choose the alternative yielding the highest utility.
The conditional logit is the most commonly used method to analyse DCE data, but relies on restrictive assumptions on the stochastic terms [23], fails to incorporate the panel structure of most DCE data and does not account for preference heterogeneity. The two principal models that circumvent these limitations are the mixed logit (MXL) [36, 37] and the latent class model (LCM) [38].
The choice between these two models critically depends on expectations about the variation of preferences [39]: if researchers expect preferences to vary greatly between individuals, the MXL is preferred; the LCM is preferred if individuals are thought to be grouped in homoge-neous latent groups. However, the information the models provide is complementary: MXL provides infor-mation about how heterogeneity is distributed relative to each attribute while LCM informs on the heterogeneity among latent subgroups of physicians. Thus, we elect to run both MXL and LCM.
The unconditional probability of a mixed model that allows for individual-specific variation in tastes and accounts for the panel dimension of choices is as follows [40]:
PnIð Þ ¼θ
Z
SnIfðβjθÞdβ
Where SnIð Þ ¼β Y
t¼1
T expðβ0xnitÞ X
j¼1 J
expðβ0xnjtÞ
2 4
3
5 is the
condi-tional probability that the individualnrealises a choice sequenceI= {i1,…,it},f(β|θ) is a density function of the
individual-specificβwith distribution parametersθ(see [40] for more on the family of mixed models).
Preference heterogeneity is reflected in the density func-tion, f(β|θ), and the distribution of β can be either con-tinuous or discrete, implying MXL or LCM, respectively.
The other major difference between the models is the estimation method. Each model relies on log-likelihood maximization, with the log-log-likelihood given by LLð Þ ¼θ X
n¼1
N
lnPnð Þθ . Unlike the LCM, this
expres-sion cannot be solved analytically in MXL and simulation methods are used for approximation [38, 40].
Simulating policy
The goal of the policy simulation is to evaluate the ef-fects of changes in the three main components of a QIP (financial, non-financial and organizational), and we use the compensating variation (CV) method to measure the relative impact on GPs’welfare of such change [41, 42].
The CV is calculated using the utility estimates com-puted after the regressions in the following expression [41]
CV ¼− 1
βw
lnX
j¼1 J
exp V0j −lnX
j¼1 J
exp V1j
h i
Where βw is the marginal utility of income, V0j is the indirect utility for each optionjbefore the policy change and V1
j the same after the policy change. In our case,
we consider only two policy options at a time, the CAPI versus something else. The formula is then simplified to [20]
CV ¼− 1
βw
V0j−V1j
h i
The question of heterogeneity is evaluated by estimat-ing CV for each latent group of physicians with LCM. For MXL, we compute and compare CV for the specific attributes where GPs exhibit significantly heterogeneous preferences (e.g.those GPs obtaining positive versus nega-tive marginal utility from the attribute).
Model specification
We include an intercept in all models. This alternative-specific constant (ASC) is necessary since choices are made relative to a fixed comparator (the constant sce-nario) [30, 42]. In our case, this ASC has no natural interpretation and is expected to be statistically insig-nificant [12].
criticised for its long right tail [37, 44], we choose the normal distribution8.
The possibility to specify the coefficients as random is one of the great strengths of the MXL. The ASC is fixed since it has no reason to vary between the respondents. Fixing the monetary attribute (the remuneration) has several advantages [45]. In our case, the main one is the capacity to calculate CV. The possibility of significant preference heterogeneity in terms of remuneration can-not be ruled out and should be considered in order to fully understand physicians’preferences. GPs valuing less payment can indeed be explained in an intrinsic motiv-ation framework, among others. We therefore run two MXL: one with all coefficients normally distributed ex-cept the constant and the amount of remuneration co-efficient (MN1) and the other with only the constant term fixed (MN2).
Without an intuitive way to choose the number of latent classes in LCM, the decision is often made on the basis of goodness-of-fit measures [27, 39]. We use the Akaike (AIC), Bayesian (BIC) and consistent Akaike (CAIC) information criteria.
The results for the selection of the number of classes are presented in Table 4. The BIC and CAIC show that the best fit is obtained with four classes, a number we retain for the following analyses9.
Results
Heterogeneity in GPs’preferences
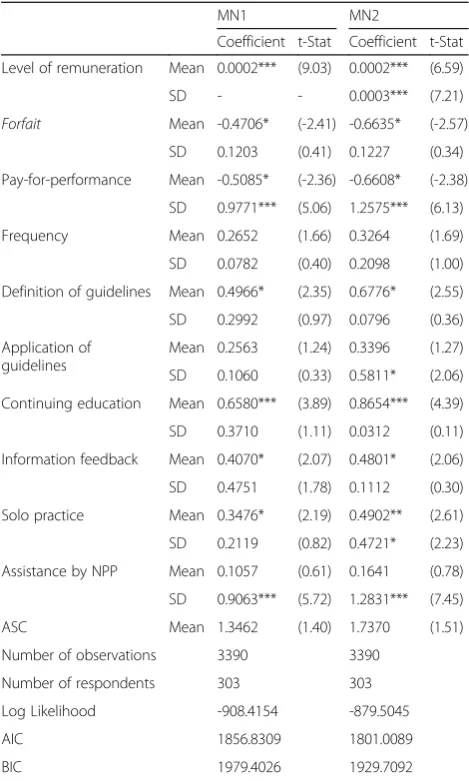
The estimation results for the mixed logit are presented in Table 5. The sign, significance and magnitude of the mean coefficients are very stable between the two models (MN1 and MN2), underlining the robustness of the results. The ASC is not significant, indicating that respondents have made their choice only on the basis of the attributes in the list (so the model is correctly specified). The estimates reveal the existence of preference heterogeneity among GPs that is quite concentrated around some attributes.
The standard deviations are significant for the pay-for-performance and the assistance by NPP in model MN1. In MN2, this is also the case for the application of guidelines, the type of practice, and the level of remu-neration. The heterogeneity in preferences for
pay-for-performance is particularly relevant. This remuneration scheme is a source of marginal disutility at the mean but is positively valued by 22 % and 24 % of physicians (in MN1 and MN2, respectively). These figures are consist-ent with the proportion of French GPs having chosen to adhere to the CAPI (around 30 %, [11]). It is also worth noting that the indifference to the assistance by NPP at the mean masked a strong heterogeneity. Indeed, 60 to 62 % would like to benefit from this kind of assistance. Finally, even the amount of remuneration is marked by heterogeneity, with 14 % of physicians not valuing an increase in income for the targeted activities (MN2).
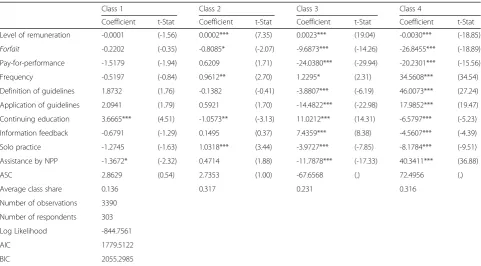
The latent class model estimates are presented in Table 6. Over all the classes, the ASCs are insignificant. For the first class, the only significant attributes are con-tinuing education and assistance by NPP. Concon-tinuing education has a positive effect on indirect utility while assistance by NPP has a negative one. In the second
Table 4Selection of the number of classes for the LCM
AIC BIC CAIC Log likelihood
2 classes 1885.706 1971.1219 1994.1219 -919.8531
3 classes 1859.6501 1989.6307 2024.6307 -894.8251
4 classes 1783.5122 1958.0576 2005.0576 -844.7562
5 classes 1780.0136 1999.1239 2058.1239 -831.0069
6 classes 1787.6742 2051.3492 2122.3492 -822.83712
Table 5Estimation of the mixed logit models
MN1 MN2
Coefficient t-Stat Coefficient t-Stat
Level of remuneration Mean 0.0002*** (9.03) 0.0002*** (6.59)
SD - - 0.0003*** (7.21)
Forfait Mean -0.4706* (-2.41) -0.6635* (-2.57)
SD 0.1203 (0.41) 0.1227 (0.34)
Pay-for-performance Mean -0.5085* (-2.36) -0.6608* (-2.38)
SD 0.9771*** (5.06) 1.2575*** (6.13)
Frequency Mean 0.2652 (1.66) 0.3264 (1.69)
SD 0.0782 (0.40) 0.2098 (1.00)
Definition of guidelines Mean 0.4966* (2.35) 0.6776* (2.55)
SD 0.2992 (0.97) 0.0796 (0.36)
Application of guidelines
Mean 0.2563 (1.24) 0.3396 (1.27)
SD 0.1060 (0.33) 0.5811* (2.06)
Continuing education Mean 0.6580*** (3.89) 0.8654*** (4.39)
SD 0.3710 (1.11) 0.0312 (0.11)
Information feedback Mean 0.4070* (2.07) 0.4801* (2.06)
SD 0.4751 (1.78) 0.1112 (0.30)
Solo practice Mean 0.3476* (2.19) 0.4902** (2.61)
SD 0.2119 (0.82) 0.4721* (2.23)
Assistance by NPP Mean 0.1057 (0.61) 0.1641 (0.78)
SD 0.9063*** (5.72) 1.2831*** (7.45)
ASC Mean 1.3462 (1.40) 1.7370 (1.51)
Number of observations 3390 3390
Number of respondents 303 303
Log Likelihood -908.4154 -879.5045
AIC 1856.8309 1801.0089
BIC 1979.4026 1929.7092
class, the significance of the attributes is slightly differ-ent. While continuing education remains significant, this time it has a negative effect. GPs in this class prefer higher payment and to be paid more often, as the sign and significance of the frequency attribute attests. They dislike the forfait but they are indifferent to pay-for-performance. They also prefer solo practice. All attri-butes are significant for classes 3 and 4, however distinct behaviour is observed. The doctors in these two latent classes place negative value on alternative payment rela-tive to FFS while preferring more frequent payment. They also prefer to work in groups. They differ in respect to all the other attributes. In contrast to the third class, an in-crease in remuneration has a negative effect on indirect utility in the fourth class. Class 3 physicians disvalue all types of clinical guidelines but positively value continuing education and information feedback, contrary to class 4. Physicians in the fourth class value assistance by NPP while those in the third class do not. With the preference for group practice in both classes, this result suggests a preference for physician groups only in class 3 while multidisciplinary teams are preferred in class 4.
At this point it is worth comparing the results of the two kinds of models. One of the major conclusions, holding in both MXL and LCM, is the negative impact on indirect utility of an increase in remuneration ob-served for some GPs. It shows that this result is not only a matter of statistical artefact resulting from the use of
a normal distribution in the MXL [39]. The MXL underlined heterogeneity of preferences for P4P. This heterogeneity is also found in the LCM, with the third and fourth classes disliking this payment while the co-efficient is positive in the second class (but significant only at 10 %). The strong difference in preferences for assistance by NPP found in MXL is also seen in LCM. The negative coefficients in classes 1 and 3 are con-trasted by a strong positive preference in class 4. All in all, this suggests a stability of the main conclusions made from the different models, with preference het-erogeneity remaining among classes.
Regarding the goodness of fit of the models, results in Table 7 indicate very little advantage to LCM while MXL (MN2) has better BIC. The minimal difference between the best fitting models suggests that each pro-vides relevant information on the heterogeneity of GPs’ preferences.
Table 6Estimation of the latent class logit model–4 classes
Class 1 Class 2 Class 3 Class 4
Coefficient t-Stat Coefficient t-Stat Coefficient t-Stat Coefficient t-Stat
Level of remuneration -0.0001 (-1.56) 0.0002*** (7.35) 0.0023*** (19.04) -0.0030*** (-18.85)
Forfait -0.2202 (-0.35) -0.8085* (-2.07) -9.6873*** (-14.26) -26.8455*** (-18.89)
Pay-for-performance -1.5179 (-1.94) 0.6209 (1.71) -24.0380*** (-29.94) -20.2301*** (-15.56)
Frequency -0.5197 (-0.84) 0.9612** (2.70) 1.2295* (2.31) 34.5608*** (34.54)
Definition of guidelines 1.8732 (1.76) -0.1382 (-0.41) -3.8807*** (-6.19) 46.0073*** (27.24)
Application of guidelines 2.0941 (1.79) 0.5921 (1.70) -14.4822*** (-22.98) 17.9852*** (19.47)
Continuing education 3.6665*** (4.51) -1.0573** (-3.13) 11.0212*** (14.31) -6.5797*** (-5.23)
Information feedback -0.6791 (-1.29) 0.1495 (0.37) 7.4359*** (8.38) -4.5607*** (-4.39)
Solo practice -1.2745 (-1.63) 1.0318*** (3.44) -3.9727*** (-7.85) -8.1784*** (-9.51)
Assistance by NPP -1.3672* (-2.32) 0.4714 (1.88) -11.7878*** (-17.33) 40.3411*** (36.88)
ASC 2.8629 (0.54) 2.7353 (1.00) -67.6568 (.) 72.4956 (.)
Average class share 0.136 0.317 0.231 0.316
Number of observations 3390
Number of respondents 303
Log Likelihood -844.7561
AIC 1779.5122
BIC 2055.2985
*Significant at 5 %; **significant at 1 %; ***significant at 0.1 %
Table 7Goodness-of-fit measures of the different specifications
AIC BIC Log likelihood
MN1 1854.961 1977.532 -907.4804
MN2 1794.699 1923.4 -876.3496
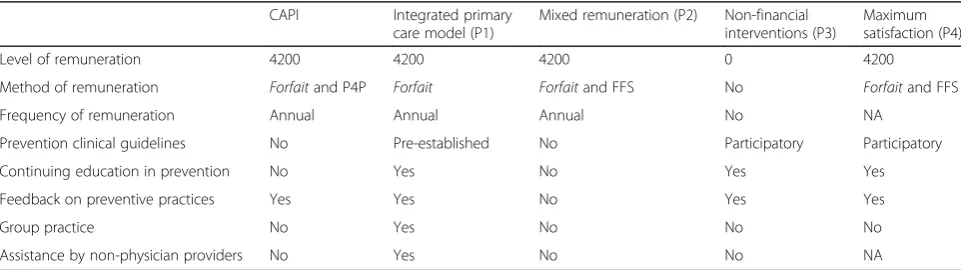
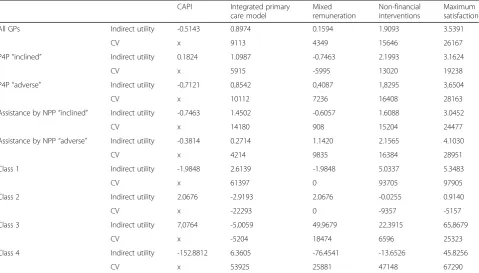
Simulating alternative quality improvement programs The policy simulation study relies on the calculation of compensating variation. The goal is here to evaluate the relative impact on physicians’welfare of alternative QIPs to the CAPI. These alternatives were chosen to be consistent with, and believable in, the context of French general practice.
The DCE attributes are used to depict five QIPs–the CAPI and four alternative policies (refer to Appendix 2 for more details). The first is close to the emerging organizational model in French primary care (maisons pluridisciplinaires et pôles de santé) implemented to foster quality of care, and also known in the literature as
“integrated” primary care model [46]. The second intro-duces a mixed remuneration scheme that can better balance quantity and quality in physicians’activity [47]. In order to measure only the effect of the payment scheme, we assume an increase in income similar to the CAPI. The third QIP is composed of only non-financial mechanisms that do not require a sharp trans-formation in physicians’ organization (i.e. no multidis-ciplinary team). The fourth is designed as a maximal satisfaction policy and is used as a benchmark10. Even if the maximum satisfaction of GPs is not necessarily an objectiveper se, comparing it to the CAPI gives a sense of the distance separating this QIP from the most desir-able one. The details of each policy are presented in Table 8.
The indirect utilities and the corresponding CV are first computed for all GPs on the basis of MN1 esti-mates. With mixed logit models, we concentrate on the attributes which are consistently heterogeneous in the two models (MN1 and MN2): P4P and assistance by NPP. For each, we identify“inclined”who obtain positive marginal utility from these attributes and“adverse” who obtain negative marginal utility. The LCM provides nat-ural subgroups for the estimation of CV, which are
computed in the four latent classes. It should be noted that only the significant coefficients enter in the compu-tation of CV for each subgroup of interest. As GPs are indifferent to insignificant attributes, using their esti-mate values would distort the welfare estiesti-mates. Results are presented in Table 9.
The first striking result is that CAPI is a source of indirect disutility in the majority of the subgroups con-sidered (5 out of 8).
The compensating variation indicates the annual bene-fits for GPs of choosing an alternative QIP rather than the CAPI. P4P “inclined” have a positive indirect utility from the CAPI of course. However, with the exception of the mixed remuneration program, all other alternative policies still give a greater benefit than the CAPI11. P4P
“adverse”would prefer each of the alternative policies to the CAPI, if they were proposed. The non-financial pol-icy has the greatest CV, but the gap with integrated primary care is reduced. Whether they are“inclined” or
“adverse” to assistance by NPP, GPs disvalue the CAPI and prefer all alternatives. We expected the NPP “ in-clined”to have a greater benefit from P1 because of the multidisciplinary team but P3 is a little more valued,. The NPP“adverse” have their lowest (though still posi-tive) CV for P1 and their preferred alternative is the non-financial program P3.
The patterns are very different between latent classes. Classes 1 and 4 obtain negative and extremely negative indirect utility from the CAPI, respectively, while the sign is positive in classes 2 and 3. Compared to the other subgroups, CV is very high in class 112. The benefit of having the non-financial policy rather than the CAPI is equivalent to 93,705€, almost the same amount as for the maximum satisfaction program. There is no benefit from shifting from the CAPI to the mixed remuneration scheme. This last result holds for class 2. This class is very specific since it is the only subgroup where other
Table 8CAPI and alternative QIPs
CAPI Integrated primary care model (P1)
Mixed remuneration (P2) Non-financial interventions (P3)
Maximum satisfaction (P4)
Level of remuneration 4200 4200 4200 0 4200
Method of remuneration Forfaitand P4P Forfait Forfaitand FFS No Forfaitand FFS
Frequency of remuneration Annual Annual Annual No NA
Prevention clinical guidelines No Pre-established No Participatory Participatory
Continuing education in prevention No Yes No Yes Yes
Feedback on preventive practices Yes Yes No Yes Yes
Group practice No Yes No No No
Assistance by non-physician providers No Yes No No NA
policies result in losses. It is even the case for P4, designed to be the most desirable for GPs in the whole, underlining again the particularity of this latent group. For class 3, mixed remuneration has the highest CV, with a relative benefit of 18,474€. With the exception of P1, alternative policies still dominate the CAPI. For class 4, integrated primary care offers the highest relative benefit (53,925€) while the CV for the non-financial policy remains im-portant (47,148€).
Discussion and conclusion
Using a discrete choice experiment, we elicited French GPs’ preferences for the different components of QIPs. We showed the strength of heterogeneity in their prefer-ences and demonstrated how this heterogeneity leads physicians to evaluate very differently the same interven-tions aimed at improving the quality of care. The hetero-geneity in preferences is concentrated on some components, especially P4P and assistance by a NPP. There is also variation in preferences by latent groups of GPs, with some physicians valuing some components of QIP only (continuing education and assistance by NPP in group 1), while other physicians value the same com-ponents differently (group 3 versus 4). Given this hetero-geneity, the crucial policy lesson is that QIPs could be adapted to meet physicians’ preferences by offering a menu of programs and allowing GPs to self-select. If policymakers were to choose only one QIP, CV indicates
that they should implement a program using only non-financial interventions. Yet, policymakers continue to rely heavily on the financial dimension to change physician be-haviour with QIP, as it is the case in France with the ROSP
– the QIP that has replaced the CAPI. Strong beliefs in the power of the financial lever or perceptions of potential implementation difficulties for non-financial interventions could explain this policy choice. Another interpretation is that financial QIP could be seen as a mechanism to both address unavoidable compensation claims from medical union and concerns for the quality of care.
Some limitations should be noted. First, the limited response rate, though consistent with the DCE literature, may have led to sample selection bias. While we do not have information on the non-responders, the opinions expressed in the first part of the questionnaire are reassuring in the sense that they are quite close to those expressed in other French studies [48–50]. Second, the use of a forced choice design might have biased the estimates if physicians wished to choose neither of the two proposed QIP. However, physi-cians who were not willing to choose one of the two options in a given choice set actually did not respond at the specific choice occasion, the forced choice is still used in health pro-fessional DCE studies [15], and this“forced choice”strategy is consistent with the new orientation of the French national QIP program (the ROSP is mandatory). Finally, we choose to use a common comparator when we constructed the choice set, which does not necessarily maximize the
Table 9Policy simulation: compensating variation (Euro per year)
CAPI Integrated primary care model
Mixed remuneration
Non-financial interventions
Maximum satisfaction
All GPs Indirect utility -0.5143 0.8974 0.1594 1.9093 3.5391
CV x 9113 4349 15646 26167
P4P“inclined” Indirect utility 0.1824 1.0987 -0.7463 2.1993 3.1624
CV x 5915 -5995 13020 19238
P4P“adverse” Indirect utility -0,7121 0,8542 0,4087 1,8295 3,6504
CV x 10112 7236 16408 28163
Assistance by NPP“inclined” Indirect utility -0.7463 1.4502 -0.6057 1.6088 3.0452
CV x 14180 908 15204 24477
Assistance by NPP“adverse” Indirect utility -0.3814 0.2714 1.1420 2.1565 4.1030
CV x 4214 9835 16384 28951
Class 1 Indirect utility -1.9848 2.6139 -1.9848 5.0337 5.3483
CV x 61397 0 93705 97905
Class 2 Indirect utility 2.0676 -2.9193 2.0676 -0.0255 0.9140
CV x -22293 0 -9357 -5157
Class 3 Indirect utility 7,0764 -5,0059 49,9679 22,3915 65,8679
CV x -5204 18474 6596 25323
Class 4 Indirect utility -152.8812 6.3605 -76.4541 -13.6526 45.8256
statistical efficiency of the experimental design [22]. Yet, fixed comparator increases the “respondent efficiency”, which can be defined as the capacity of a respondent to express his“real”preferences in the context of the DCE [51]. Given that private practice physicians are heavily time-constrained, particularly in the French fee-for-service context, we believe this trade-off between statis-tical and respondent efficiency has allowed us to obtain a satisfactory response rate and better quality and com-pleteness of responses relative to other designs.
Despite these limitations, this study adds to the broader literature on the heterogeneity of health professionals’ preferences [13–15, 28] and for the first time, combines LCM and MXL approaches. Each model contributes a better understanding of physicians’preferences and using such an approach can help policymakers to better design their QIP.
Endnotes
1
The CAPI was replaced in 2012 by a P4P program (the ROSP) where physicians are enrolled automatically, but can request to opt out.
2
The number of considered attributes should not be so high as to allow respondent to make trade-offs. If there are no clear recommendations on the maximum num-ber, the DCE health economics literature generally uses at most eight attributes [21].
3
Caussade et al. [25] showed that setting between 6 and 13 choice situations minimizes the error variance of the estimates.
4
We restricted ourselves to the region of Bourgogne because of prior relationships with the regional health professional’s union who facilitated the constitution of the focus-group and offered logistic support for the sur-vey. The restriction to one region is also due to monet-ary and time constraints. The fund obtained from the Conseil Regional de Bourgognedid not allow for a survey of more than one region.
5
This point is, however, not particularly concerning as the regional and national values are derived from an administrative database (système national d’information inter-régimes – SNIIR) known to underestimate physi-cians’activity. The SNIIR includes the very low activity physicians, pulling down the average number of acts.
6
Beyond the choice exercise, supplementary choices and follow-up questions were introduced in the DCE in order to test the internal validity of the data collected. More informa-tion on the test procedures used is available upon request.
7
This random part is precisely why RUT can deal with axiomatic violations. The “errors” may come from this stochastic part, which is unexplained by the researcher.
8
Because of the qualitative nature of the majority of our attributes, there is no reason to think that one level should be preferred to another a priori. It is therefore
difficult to select the sign of the distribution. MXL with log-normal distribution are run for sensitivity analyses and do not exhibit large differences in the fit. Results are available from the authors.
9
The simplest way to account for heterogeneity of preferences is to incorporate the personal characteristics of the respondents in the models. It can be done with interaction terms in the MXL and to explain class mem-bership probability in the LCM. We argue these individ-ual characteristics have to considerably improve the fit of the models in order to be worth keeping for final ana-lysis, which is not the case with our data (results available upon request). Most of the personal characteristics are found to be insignificant in the MXL, the integration of these characteristics does not drastically improve the fit to the data in MXL, and even worsens the fit of the LCM. As a result and following Hole [39], we focus only on the more parsimonious models in our analyses.
10
The maximal satisfaction policy is designed for all GPs. Our goal is to compare different nationally uniform policies such as the CAPI.
11
In this paragraph, when talking about greater CV, we do not take the maximum satisfaction into account and only concentrate on the reliably implantable policies.
12
This is partly because only two attributes are found significant for this latent class and enter the calculation of the CV. Their presence or absence therefore has a disproportionate impact on the CV for each policy.
Appendix 1
Table 10Example of choice set
Option A Option B
Income increase per year 6100€ 12100€
Method of remuneration Forfait+ Fee-for-service
Forfait+ Pay-for-performance
Frequency of remuneration Annually Annually
Work in group of general practitioners
Yes No
Prevention clinical guidelines None You participate in their definition and application
Continuing education in prevention
No Yes
Feedback on preventive practices
No No
Assistance by non-physician providers during preventive work
No Yes
I prefer A I prefer B
Tick one box □ □
Appendix 2
Acknowledgments
We thank the two anonymous reviewers for their helpful comments that helped improve this manuscript. We are grateful for comments from Sophie Béjean and Erin Strumpf on an earlier version of this paper. We thank Arne Risa Hole for his advices on hismixlogitStata command and we thank theUnion régionale des professionnels de santéfor their help with the focus-group meetings and their logistic support for the survey. We are of course in great debt to the GPs who took time to answer the survey. Financial support is acknowledged from the Regional Council of Bourgogne (CPER 2009 and PARI 2010). Usual disclaimers apply.
Authors’contributions
MA conceived and designed the choice experiment, analyzed the data and wrote the manuscript. MA and CP substantially contributed to the acquisition and interpretation of the data, and revising critically the manuscript. Both authors gave final approval to the manuscript.
Competing interests
The authors declare that they have no competing interests.
Author details
1School of Public Policy and Administration, Carleton University, River Building, 1125 Colonel By Drive, Ottawa, ON K1S 5B6, Canada.2Laboratoire d’Économie de Dijon, Université de Bourgogne, CNRS UMR 6307, Inserm U 1200, Dijon, France.
Received: 13 May 2016 Accepted: 8 September 2016
References
1. Holmboe E, Weng W, Arnold G, Kaplan S, Normand S, Greenfield S, Hood S, Lipner R. The comprehensive care project: measuring physician performance in ambulatory practice. Health Serv Res. 2010;45(6 Part II):1912–33. 2. Cromwell J, Trisolini MG, Pope GC, Mitchell JB, Greenwald LM (eds.).
Pay for Performance in Health Care: Methods and Approaches. North Carolina: RTI Press publication; 2011.
3. Gillam S, Niroshan Siriwardena A, Steel N. Pay-for-Performance in the United Kingdom: Impact of the Quality and Outcomes Framework—A Systematic Review. Ann Fam Med. 2012;10(5):461–8.
4. Harris SB, Green ME, Brown JB, Roberts S, Russell G, Fournie M, Webster-Bogaert S, Paquette-Warren J, Kotecha J, Han H. Impact of a quality improvement program on primary healthcare in Canada: A mixed-method evaluation. Health Policy. 2015;119(4):405–16.
5. Mullen K, Franck R, Rosenthal M. Can you get what you pay for? Pay-for-performance and the quality of healthcare providers. Rand J Econ. 2010;41(1):64–91.
6. Eijkenaar E. Pay for performance in Health Care: an international overview of initiatives. Med Care Res Rev. 2012;69(3):251–76.
7. Emmert M, Eijkenaar E, Kemter H, Esslinger AS, Schöffski O. Economic evaluation of pay for performance in health care: a systematic review. Eur J Health Econ. 2012;13(6):755–67.
8. James J. Health policy brief: Pay-for-performance. Health Affairs. 2012. 9. Li J, Hurley J, Decicca P, Buckley G. Physician response to
pay-for-performance: Evidence from a natural experiment. Health Econ. 2014; 23(8):962–78.
10. Khoong E, Gibbert W, Garbutt J, Sumner W, Brownson R. Rural, Suburban, and Urban Differences in Factors That Impact Physician Adherence to Clinical Preventive Service Guidelines. J Rural Health. 2014;30(1):7–16. 11. Saint-Lary O, Bernard E, Sicsic J, Plu I, François-Purcell I, Franc C. Why Did
Most French GPs Choose Not to Join the Voluntary National Pay-for-Performance Program? PLoS ONE. 2013;8(9):e72684.
12. Scott A. Eliciting GPs’preferences for pecuniary and non-pecuniary job characteristics. J Health Econ. 2001;20(3):329–47.
13. Rockers PC, Jaskiewicz W, Wurts L, Kruk ME, Mgomella GS, Ntalazi F, Tulenko K. Preferences for working in rural clinics among trainee health professionals in Uganda: a discrete choice experiment. BMC Health Serv Res. 2012;12:212. 14. Vujicic M, Shengelia B, Alfano M, Thu HB. Physician shortages in rural
Vietnam: using a labor market approach to inform policy. Soc Sci Med. 2011;73(7):970–7.
15. Lagarde M, Pagaiya N, Tangcharoensathian V, Blaauw D. One size does not fit all: investigating doctors’stated preference heterogeneity for job incentives to inform policy in Thailand. Health Econ. 2013;22(12): 1452–69.
16. Rischatsch M, Zweifel P. What do physicians dislike about managed care? Evidence from a choice experiment. Eur J Health Econ. 2013;14(4):601–13. 17. Gandjour A. Investment in quality improvement: how to maximise the
return. Health Econ. 2010;19(1):31–42.
18. Kantarevic J, Kralj B. Link between pay for performance incentives and physician payment mechanisms: evidence from the diabetes management incentive in Ontario. Health Econ. 2013;22(12):1417–39.
19. De Bekker-Grob EW, Ryan M, Gerard K. Discrete Choice Experiments in Health Economics: A Review of the Literature. Health Econ. 2012;21(2):145–72. 20. Amaya-Amaya M, Gerard K, Ryan M. Discrete Choice Experiments in a
Nutshell. In: Ryan M, Gerard K, Amaya-Amaya M (eds.). Using Discrete Choice Experiments to Value Health and Health Care. Netherlands: Springer; 2008. p. 13–46
21. Kjær T. A review of the discrete choice experiment–with emphasis on its application in health care. Health Economics Papers. University of Southern Denmark. 2005/1, 139.
22. Rose J, Bliemer M. Stated preference experimental design strategies. In: Hensher DA, Button KJ, editors. Handbook of Transport Modelling. Oxford: Elsevier; 2008. p. 151–80.
23. Hensher DA, Rose JM, Greene WH. Applied choice analysis: a primers. Cambridge: Cambridge University Press; 2005.
Table 11Construction of the CAPI scenario
Attributes Level Justification
Level of remuneration 4200 The maximum bonus a GP can earn is 7000€a year, from which only 60 % is imputable to preventive services. We select this maximum in order to evaluate the highest benefit that can be expected from the CAPI.
Method of remuneration Forfaitand Pay-for-performance
The CAPI introduced P4P in France. Aforfaitper patient is adjusted depending on the attainment of the clinical practice targets.
Frequency of remuneration Annual The payment is made at each anniversary of the signed contract.
Prevention clinical guidelines No Even though various guidelines exist, they are not linked with the CAPI.
Feedback on preventive practices Yes Information is fed back to the doctor each trimester as part of the CAPI.
Continuing education in prevention No Continuing education is only on a voluntary basis and is not linked to the CAPI.
Group practice No No incentive for GPs working in teams is included in the CAPI.
24. Scott A. Identifying and analysing dominant preferences in discrete choice experiments: An application in health care. J Econ Psychol. 2002;23(3):383–98.
25. Caussade S, Ortúzar J de D, Rizzi LI, Hensher D A. Assessing the influence of design dimensions on stated choice experiment estimates. Transport Res B-Meth. 2005;39(7):621–40.
26. Gerard K, Shanahan M, Louviere J. Using stated preference discrete choice modelling to inform health care decision-making: a pilot study of breast screening participation. Appl Econ. 2003;35(9):1073–85.
27. Mentzakis E, Ryan M, McNamee P. Using discrete choice experiments to value informal care tasks: exploring preference heterogeneity. Health Econ. 2011;20(8):930–44.
28. Scott A, Witt J, Humphreys J, Joyce C, Kalb G, Jeon S, McGrail M. Getting doctors into the bush: General Practitioners’preferences for rural location. Soc Sci Med. 2013;96:33–44.
29. Le Fur P, Bourgueil Y, Cases C. Le temps de travail des médecins généralistes. Une synthèse des données disponibles. Questions d’économie de la santé. 2009;144.
30. Bech M, Gyrd-Hansen D. Effects coding in discrete choice experiments. Health Econ. 2005;14(10):1079–83.
31. Kjær T, Bech M, Gyrd-Hansen D, Hart-Hansen K. Ordering effect and price sensitivity in discrete choice experiments: need we worry? Health Econ. 2006;15(11):1217–28.
32. Ryan M, Watson V, Entwistle V. Rationalising the‘irrational’: a think aloud study of discrete choice experiment responses. Health Econ. 2009;18(3):321–36.
33. San Miguel F, Ryan M, Amaya-Amaya M.‘Irrational’stated preferences: a quantitative and qualitative investigation. Health Econ. 2005;14(3):307–22. 34. Lancsar E, Louviere J. Deleting‘irrational’responses from discrete choice
experiments: a case of investigating or imposing preferences? Health Econ. 2006;15(8):797–811.
35. McFadden D. Conditional logit analysis of qualitative choice behavior. In: Zarembka P, editor. Frontiers in Econometrics. Academic Press: New York; 1974. p. 105–42.
36. McFadden D, Train K. Mixed MNL models for discrete response. J Appl Econom. 2000;15(5):447–70.
37. Hensher DA, Greene WH. The Mixed Logit model: The state of practice. Transportation. 2003;30:133–76.
38. Greene WH, Hensher DA. A latent class model for discrete choice analysis: contrasts with mixed logit. Transport Res B-Meth. 2003;37(8):681–98. 39. Hole AR. Modelling heterogeneity in patients’preferences for the attributes
of a general practitioner appointment. J Health Econ. 2008;27(4):1078–94. 40. Train K. Discrete choice methods with simulations. Cambridge: Cambridge
University Press; 2009.
41. Lancsar E, Louviere J, Flynn T. Several methods to investigate relative attribute impact in stated preference experiments. Soc Sci Med. 2007;64(8):1738–53.
42. Ryan M, Gerard K, Amaya-Amaya M. Using Discrete Choice Experiments to Value Health and Health Care. Netherlands: Springer; 2008.
43. Kjær T, Gyrd-Hansen D. Preference heterogeneity and choice of cardiac rehabilitation program: Results from a discrete choice experiment. Health Policy. 2008;85(1):124–32.
44. Sillano M, Ortuzar J. Willingness-to-pay estimation with mixed logit models: some new evidence. Environ Plann A. 2005;37(3):525–50.
45. Revelt D, Train K. Mixed logit with repeated choices: households’choices of appliance efficiency level. Rev Econ Stat. 1998;80(4):647–57.
46. Romanow RJ. Building on Values: The Future of Health Care in Canada. Commission of the Future of Health Care in Canada; 2002.
47. Dumont E, Fortin B, Jacquemet N, Shearer B. Physicians’Multitasking and Incentives: Empirical Evidence from a Natural Experiment. J Health Econ. 2008;27(6):1436–50.
48. Buttet P, Fournier C. Prévention et éducation pour la santé. Quels rôles pour les médecins et les pharmaciens? In: Gautier A (ed). Baromètre santé médecins/pharmaciens 2003. INPES, Saint-Denis; 2003.
49. Levasseur G, Bataillon R, Samzun J. Le schéma régional d’organisation sanitaire. Baromètre des pratiques en médecine générale. Panel Breton. Rapport d’enquête de l’URML Bretagne; 2004.
50. Aulagnier M, Videau Y, Combes J-B, Sebbah R, Paraponaris A, Verger P, Ventelou B. Pratiques des médecins généralistes en matière de prévention : les enseignements d’un panel de médecins généralistes en Provence-Alpes-Côte d’Azur. Pratiques et Organisation des Soins. 2007;38:259–68.
51. Louviere J. Choice experiments: an overview of concepts and issues. In: Bennett J, Blamey R, editors. The Choice Modelling Approach to Environmental Valuation. Northampton: Edward Elgar; 2001. p. 13–36. 52. Bras PL, Duhamel G. Rémunérer les médecins selon leurs performances :
les enseignements des expériences étrangères. Paris: Inspection Générale des Affaires Sociales; 2008.
53. Town RJ, Kane RL, Johnson PE, Butler M. Economic Incentives and Physician’s Delivery of Preventive Care. A Systematic Review. Am J Prev Med. 2005;28(2):234–40.
54. Farmer A, Légaré F, Turcot L, Grimshaw J, Harvey E, McGowan J, Wolf F. Printed educational materials: effects on professional practice and health care outcomes. Cochrane Db Syst Rev. 2008;(3):CD004398.
55. Grol R. Successes and Failures in the Implementation of Evidence-Based Guidelines for Clinical Practice. Med Care. 2001;39(8 Suppl 2):46–54. 56. Dexheimer JW, Talbot TR, Sanders DL, Rosenbloom ST, Aronsky D.
Prompting Clinicians about Preventive Care Measures: A Systematic Review of Randomized Controlled Trials. J Am Med Inform Assn. 2008;15(3):311–20. 57. Forsetlund L, Bjørndal A, Rashidian A, Jamtvedt G, O’Brien MA, Wolf F, Davis
D, Odgaard-Jensen J, Oxman AD. Continuing education meetings and workshops: effects on professional practice and health care outcomes. Cochrane Db Syst Rev. 2009;(2):CD003030.
58. López-de-Munain J, Torcal J, López V, Garay J. Prevention in Routine General Practice: Activity Patterns and Potential Promoting Factors. Prev Med. 2001;32(1):13–22.
59. Pham H, Schrag D, Hargraves J, Bach P. Delivery of preventive services to older adults by primary care physicians. J Amer Med Assoc. 2005;94(4):473–81. 60. Mousquès J, Bourgueil Y, Le Fur P, Yilmaz E. Effect of a French experiment
of team work between general practitioners and nurses on efficacy and cost of type 2 Diabetes Patients Care. Health policy. 2010;98(2–3):131–43. 61. Chung S, Palaniappan L, Wong E, Rubin H, Luft H. Does the Frequency of
Pay-for-Performance Payment Matter?—Experience from a Randomized Trial. Health Serv Res. 2010;45(2):553–64.
62. Fréchou H, Guillaumat-Tailliet F. Les revenus libéraux des médecins en 2005 et 2006. Etudes et résultats. 2008;643.
63. Eco-Santé France, Régions & Départements. 2015. http://www.ecosante.fr/. Accessed 28 Apr 2015.
64. Sicart D. Les médecins. Estimations au 1er janvier 2009. Drees Série Statistiques Document de travail. 2009;138.
65. ORS Bourgogne: Soins et prévention–Généralistes. Faits marquants Fiche 5.7. 2010.
66. Aulagnier M, Obadia Y, Paraponaris A, Saliba-Serre B, Ventelou B, Verger P, Guillaumat-Tailliet F. L’exercice de la médecine générale libérale. Premiers résultats d’un panel dans cinq régions françaises. Etudes et résultats. 2007;610.
67. Bournot MC, Goupil MC, Truffeau F. Les médecins généralistes : un réseau professionnel étendu et varié. Etudes et résultats. 2008;649.
Submit your manuscript to a
journal and benefi t from:
7Convenient online submission
7Rigorous peer review
7Immediate publication on acceptance
7Open access: articles freely available online
7High visibility within the fi eld
7Retaining the copyright to your article