R E S E A R C H
Open Access
The implementation of academic detailing
and its effectiveness on appropriate
prescribing of pain relief medication: a
real-world cluster randomized trial in Belgian
general practices
Robin Bruyndonckx
1,2*†, Veronique Verhoeven
3†, Sibyl Anthierens
3, Koen Cornelis
4, Katelijne Ackaert
4,
Birgit Gielen
4and Samuel Coenen
1,3,5Abstract
Background:In Belgium, the debate about the effect of the national academic detailing service (ADS) on prescribing quality in general practice is ongoing. In order to evaluate both the implementation strategies of the ADS and its effectiveness on appropriate prescribing of pain relief medication, we conducted a real-world cluster randomized controlled trial (cRCT).
Methods:In a pragmatic cRCT, all Belgian general practices previously visited by Farmaka were assessed for eligibility and randomized. Only practices randomized to the intervention group were invited for an academic detailing visit on appropriate prescribing of pain relief medication. GPs were unaware of the study, ensuring the production of real-world evidence but were given the option to opt out from the analysis. An objective outcome assessment was obtained using routinely collected reimbursement data. Primary outcomes were the proportion of patients reimbursed for an analgesic or NSAID, the defined daily dose of paracetamol per patient per month, the proportion of patients reimbursed for a recommended NSAID among those reimbursed for any NSAID and the proportion of patients reimbursed for both an NSAID and a proton pump inhibitor among those reimbursed for an NSAID. The impact of practice, GP and academic detailer characteristics were also assessed.
Results:Three thousand five hundred twenty-nine general practices (4530 GPs) were eligible and randomized. One thousand six hundred ninety-eight practices (2171 GPs) in the intervention group and one thousand seven hundred three (2163 GPs) in the control group were included in the analysis. The intervention had a significant impact on the proportion of patients reimbursed for a recommended NSAID among those reimbursed for any NSAID (increase in odds (95% CI): 19% (10–29%)). A clear impact on other outcomes could not be detected. Additionally, we showed that the characteristics of the academic detailers might impact the effectiveness of the visit.
(Continued on next page)
* Correspondence:[email protected] †Equal contributors
1Laboratory of Medical Microbiology, Vaccine & Infectious Disease Institute (VAXINFECTIO), University of Antwerp, Antwerp, Belgium
2Interuniversity Institute for Biostatistics and statistical Bioinformatics (I-BIOSTAT), University of Hasselt, Agoralaan building D, 3590 Diepenbeek, Hasselt, Belgium
Full list of author information is available at the end of the article
(Continued from previous page)
Conclusions:National implementation of academic detailing in Belgian general practices provided by Farmaka significantly improved the proportion of recommended NSAIDs prescribed by GPs, but not other outcomes related to appropriate prescribing of pain relief medication.
Trial registration:NCT01761864. Registered 2 January 2013.
Keywords:Continuing medical education, Educational outreach visits, Nonsteroidal anti-inflammatory drugs, Primary care, Prescribing behaviour, Interrupted time series analysis
Background
Several continuing medical education (CME) initiatives aim to support general practitioners (GPs) to cope with the ever increasing amount of novel professional infor-mation. In Western countries, CME activities rely heav-ily on support from the pharmaceutical industry, introducing bias in both topic selection and information provided [1]. Most CME strategies (e.g. conferences) have mixed effects, but academic detailing (AD) is espe-cially effective for improving the quality of prescribing in general practice [2]. A recent synthesis of systematic reviews showed that CME had a small but significant impact on physician performance (6%) and patient health outcomes (3%). [3]. A Cochrane review of ran-domized controlled trials (RCTs) showed that AD im-proved quality of care, with the effect on prescribing quality being small (3–6.5%) but larger than that of other strategies [4]. Additionally, AD has been shown to be feasible with a majority of GPs who wished to receive future visits [5].
Farmaka (www.farmaka.be) is an independent Belgian drug information centre operating nationwide to im-prove rational prescribing and is funded by the Federal Agency for Medicines and Health Products (FAMHP; www.famhp.be/en/famhp). The effect of its academic de-tailing service (ADS) on improved prescribing has been shown in two small RCTs [6, 7]. Another study however could not demonstrate its effectiveness [8]. The latter study was ordered by FAMHP because it nearly doubled its yearly investment in its ADS in 2009. This limited evaluation was conducted by the Belgian health care knowledge centre (KCE) on AD visits covering dementia
and diabetes and did not allow to draw valid
conclusions.
Therefore, the FAMHP ordered a new evaluation of its ADS. Instead of conducting another traditional trial, we chose to produce real-world evidence on both the effect-iveness and implementation strategies of the ADS by also assessing the impact of practice, GP and academic detailer characteristics on ADS’ effectiveness and to complement this trial with a process evaluation [9, 10].
The academic detailers’ visits are structured around prescribing for common medical conditions in general
practice (ranging from acute cough to anxiety disorders) and are offered to GPs on a voluntarily basis. In line with the planning of the ADS and the recommendations by Borgermans et al., we focused on the visits in 2013 on appropriate use of pain relief medication (analgesics and NSAIDs) for chronic pain in osteoarthritis which is a common condition in which the GP plays an import-ant role (rather than a specialist) and for which a great impact could be expected given the room for improve-ment in osteoarthritis care. This topic was handled by Farmaka because osteoarthritis is a condition that occurs more and more frequently, due to the ageing population, and for which high doses of non-steroidal anti-inflammatory drugs (NSAIDs) are prescribed. Chronic use of NSAIDs however is associated with gastrointes-tinal (GI) adverse effects, such as upper GI bleeding and perforation [11–17].
In this pragmatic cluster RCT (cRCT), we will evaluate real-world evidence on the implementation of academic detailing by Farmaka in Belgian general practices by assessing its effectiveness on appropriate prescribing of pain relief medication for chronic pain relief in osteo-arthritis and factors that modify its effectiveness.
Methods
Study population and trial design
within their strata by descending GP identification code (GP ID) of the GP with the highest GP ID reflecting an earlier registration of that GP by the Belgian Government, before randomization. Within the randomized blocks, i.e. pairs of intervention and control practices, the date of visit for the practice in the intervention group could be used for the control group as well, ensuring a comparable spread of dates of visit in the control group. Whenever a practice in the intervention group was not visited or the date of visit was not noted, the latest date of visit was used. To evaluate the influence of this choice on the results, a sensitivity analysis, excluding the practices for which no visitation date was noted, was conducted. Group allocation was concealed for all randomized GPs until the end of the outcome assessment. The outcomes were assessed objectively, by analysing routinely collected reim-bursement data. Before data became available for analysis, all randomized GPs were informed of the study through written communication (in November 2014) and were
given the option to be excluded from the analysis (opt out) by written notice before 23 December 2014. Blinding of academic detailers was not possible due to the nature of the intervention. The trial was approved by the ethics committee of the University of Antwerp/Antwerp University Hospital (B300201317018) and registered with clinicaltrials.-gov (NCT01761864).
Intervention
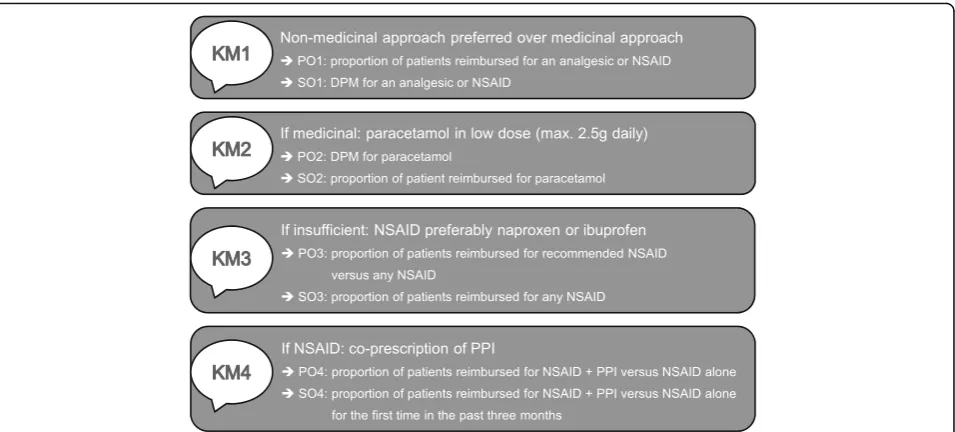
Practices in the intervention group were offered a (free) 15- to 20-min visit by an academic detailer, who pro-vided four comprehensible key messages (KM) on pre-scription of pain relief medication in patients with osteoarthritis (Fig. 2). First, a non-medicinal approach should be preferred [KM1]. Second, if a medicinal approach is needed, paracetamol is the first choice and should not be dosed too high (max. 2.5 g daily) [KM2]. Third, NSAIDs could be used when response to para-cetamol is insufficient. In that case, ibuprofen or
naproxen is recommended due to their safety profile and cost-benefit ratio [12–14] [KM3]. Fourth, when prescrib-ing NSAIDs, gastroprotective agents, such as proton pump inhibitors (PPIs), should be co-prescribed to pa-tients with gastrointestinal risk factors (e.g. aged 65 or above, presence of comorbidity or history of ulcer for-mation) to reduce the risk of complications [15–17] [KM4]. The information package used by the academic detailers can be found in Additional file 1.
Practices in the control group were not offered a visit.
Data characteristics
Data on the characteristics of the eligible general prac-tices used for the randomization (unique identification codes for the visiting academic detailer (AD ID) and the practice (practice ID), GP ID, the number of previous visits by a Farmaka academic detailer and the practice type) and on the characteristics of the academic detailers (education and experience) was provided by Farmaka that collects and checks these routine data as part of its ADS. Additional data on the characteristics of the eligible general practices (GP ID, number of included GPs in the practice the GP belongs to, yearly number of assigned patients to the practice the GP belongs to, region and province) and on the reimbursement of selected pain relief medication they prescribed to patients aged 60 and over between 6 months before and 6 months after the intervention date (Anatomic Thera-peutic Chemical (ATC) code N02BE01 (paracetamol), N02 (general analgesics), M01AE01 (ibuprofen), M01AE02 (na-proxen), M01A (NSAIDs) and A02BC (PPIs)) was provided by the Intermutualistic Agency (IMA; www.aim-ima.be),
collecting these data from the seven health insurance companies in Belgium for health care research. All data were linked through the GP ID and aggregated at the level of the general practice. Whenever there was uncertainty about which academic detailer provided the visit, the code (AD ID) of the academic detailer to which the practice was randomized was used in the analysis.
Outcomes definition
Four primary outcomes (POs) and four secondary out-comes (SOs) (all at the level of the general practice) were extracted from the key messages included in the osteoarthritis information package (Fig. 2).
Primary outcomes
The first PO, assessing the effectiveness of KM1, was defined as the proportion of patients reimbursed for an analgesic of NSAID (PO1). It was calculated as the monthly number of patients reimbursed for a drug with ATC code N02 or M01A, divided by the number of patients assigned yearly (at practice level). If KM1 was conveyed successfully, we expect PO1 to decrease by prescribing proportionally less patients with an anal-gesic. The second PO, assessing the effectiveness of KM2, was defined as the defined daily dose (DDD) per patient per month (DPM) for paracetamol (PO2). It was calculated as the monthly DDD for drugs with ATC code N02BE01 divided by the monthly number of pa-tients reimbursed for a drug with ATC code N02BE01 (at practice level). If KM2 was conveyed successfully, we expect the DPM of paracetamol, and hence PO2, to decrease. The third PO, assessing the effectiveness of
KM3, was defined as the proportion of patients bursed for a recommended NSAID among those reim-bursed for any NSAID (PO3). It was calculated as the monthly number of patients reimbursed for a drug with ATC code M01AE01 or M01AE02, divided by the monthly number of patients reimbursed for a drug with ATC code M01A (at practice level). If KM3 was conveyed successfully, we expect PO3 to increase by prescribing proportionally more recommended NSAIDs. The fourth PO, assessing KM4, was defined as the proportion of patients reimbursed for both an NSAID and a PPI among those reimbursed for an NSAID (PO4). It was calculated as the monthly number of patients reimbursed for a drug with ATC code M01A and a drug with ATC code A02BC, divided by the monthly number of patients reimbursed for a drug with ATC code M01A (at practice level). If KM4 was conveyed successfully, we expect PO4 to increase by prescribing proportionally more patients with both an NSAID and a PPI.
Secondary outcomes
In order to obtain a complete picture of the effectiveness of the implementation of KM1, the consumption of analgesics and NSAID was also assessed using the DPM for analgesics (SO1). The DPM was calculated as the monthly DDD for drugs with ATC code N02 or M01A, divided by the monthly number of patients reimbursed for a drug with ATC code N02 or M01A (at practice level). If KM1 was conveyed successfully, we expect the DPM of analgesics, and hence SO1, to decrease. Because KM2 also implied that paracetamol should be used as the first choice, the proportion of patients reimbursed for paracetamol was studied (S02). This outcome was calculated as the number of patients reimbursed for a drug with ATC code N02BE01, divided by the yearly number of assigned patients (at practice level). If KM2 was conveyed successfully, we expect SO2 to increase by prescribing proportionally more patients with paraceta-mol. Because KM3 also implied that NSAIDs should be used as a second medicinal approach, the proportion of patients reimbursed for any NSAID was studied (SO3). This outcome was calculated as the number of patients reimbursed for a drug with ATC code M01A, divided by the yearly number of assigned patients (at practice level). If KM3 was conveyed successfully, we expect SO3 to decrease by prescribing proportionally less patients with paracetamol. Because we believe that introducing an additional product (being PPI) to patients already using NSAID would be harder than introducing two new products together (being NSAID + PPI), the proportion of patients reimbursed for both an NSAID and a PPI among those reimbursed for an NSAID for the first time in 3 months was studied (SO4). This outcome was cal-culated as the monthly number of patients reimbursed
for a drug with ATC code M01A and a drug with ATC code A02BC for the first time in the past 3 months, divided by the monthly number of patients reimbursed for a drug with ATC code M01A for the first time in the past 3 months (at practice level). If KM4 was conveyed successfully, we expect SO4 to increase by prescribing proportionally more patients with an NSAID and a PPI when receiving an NSAID for the first time in 3 months.
Power calculations
At the 5% significance level, this cRCT with a maximum sample size of 3500 at the level of the practice has more than 80% power to detect absolute differences between the intervention groups ≥5% around the most conservative proportion of 50% (e.g. 47.5 vs 52.5%) and standardized differences in means of 0.1 (e.g. standardized difference in mean DPM of 1 for a standard deviation of 10).
Analysis settings
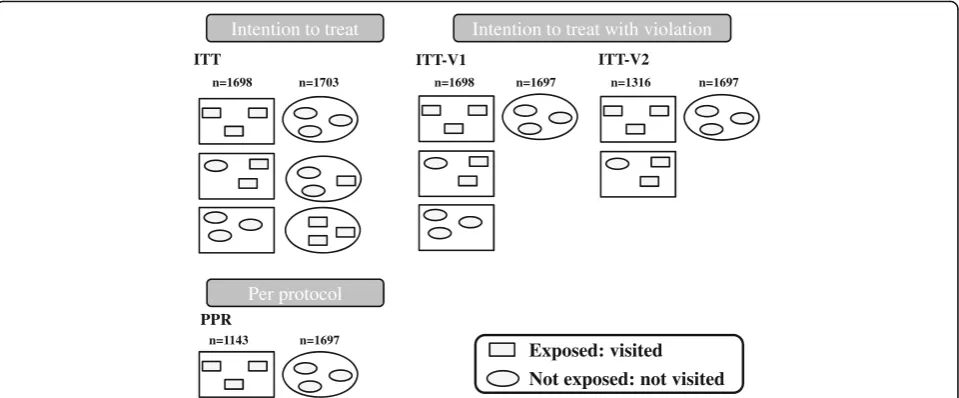
The primary analysis was an unadjusted intention to treat (ITT) analysis (Fig. 3, top left panel) in which all practices were analysed in the groups to which they were randomized. As randomization was performed at the level of the practice, in theory, all GPs within one prac-tice should either have or have not been visited. In real-ity, however, among the control practices that should not have been visited, there were practices with no visits, practices in which some GPs were visited (partially non-adherent control, e.g. GP transferred from intervention to control practice after randomization) and practices in which all GPs were visited (fully non-adherent control, e.g. GP from a solo practice transferred to an interven-tion practice after randomizainterven-tion). In addiinterven-tion, among the intervention practices that should have been visited, there were practices in which all GPs were visited, prac-tices in which only some GPs were visited (partially non-adherent intervention, e.g. one GP absent on the day of the visit) and practices in which no GP was visited (fully non-adherent intervention, e.g. no appointment could be made). In order to assess the robustness of the findings from the ITT analysis, three additional analysis settings were created (Fig. 3). The ITT analysis setting with viola-tion (ITT-V1) was obtained by leaving out all non-adherent control practices. The ITT-V2 analysis setting was obtained by also leaving out the fully non-adherent intervention practices. The per protocol (PPR) analysis setting was obtained by also leaving out the partially non-adherent intervention practices.
Statistical analysis
series approach [18, 19]. Because monthly observations were clustered by practice, and practices were clustered within provinces, we corrected the interrupted time series model for clustering by province [20–22]. Because some of the explanatory variables were varying with time (e.g. the number of GPs which might differ over a period of 12 months), we used an independent working correl-ation in order to obtain unbiased results [23]. Note that, even if this correlation structure does not match the true structure, obtained estimates and robust standard errors will be statistically consistent [20].
The model we used can be presented as follows:
g Yð Þ ¼i β0þβ1Trþβ2Tiþβ3Xiþβ4Taiþβ5Tr:Ti þβ6Tr:Xiþβ7Tr:Tai
where Yi represents the outcome at time point i, with i
ranging from 1 (at 6 calendar months before the inter-vention) to 12 (at 6 calendar months after the interven-tion), g() represents the link function (an identity link is used for PO2 and SO1, a logit link is used for the other
outcomes),Tris a dummy variable to indicate the
inter-vention group (interinter-vention: 1, control: 0), Ti is a
con-tinuous variable (1–12) indicating the time in months
(from 6 months before to 6 months after the
interven-tion), Xi is a dummy variable indicating pre- or
post-intervention period (0: pre, 1: post),Tai is a continuous variable (1–6) indicating the time after intervention in
months.β0represents the outcome in the control group
at baseline (i.e. 6 months before intervention), β1 repre-sents the difference in outcome between the interven-tion and the control group at baseline,β2represents the trend of the outcome in the control group before the
intervention, β3 represents the step change in the
outcome for the control group immediately after the
intervention, β4 represents the change in the trend of
the outcome after the intervention in the control group, β5represents the difference in trend of the outcome be-tween the intervention and the control group before intervention, β6represents the difference in step change between the intervention and the control group im-mediately after the intervention (the step change) and
β7represents the difference in the change in trend of
the outcome between the intervention and the control group after intervention (the change in trend).
Predicted proportions (or DPMs) for analyses in which the intervention had a consistent and significant impact were obtained using the model’s parameter estimates. Confidence bounds around the estimates were obtained using the delta method [24].
Exploratory subgroup analyses
We pre-specified the assessment of effect modification by the number of previously received visits and the char-acteristics of the academic detailer (a physician or not). In addition, we looked at the outcomes in subgroups defined by experience of the academic detailer (at least 40 years of age or not), region of the practice (Flanders versus Wallonia, with Brussels included in Wallonia) and number of GPs in the practice. For the last two vari-ables, we examined the homogeneity of the step change and the change in trend after the intervention across dif-ferent subgroups by including interaction terms between time components, intervention and subgroup (while correcting for baseline differences). For the first three variables, which could by design only impact the inter-vention group, we examined the homogeneity of the step change and the change in trend after the intervention Intention to treat
ITT ITT-V1 ITT-V2
Per protocol
PPR
Not exposed: not visited Exposed: visited
n=1143 n=1697
n=1698 n=1703 n=1698 n=1697 n=1316 n=1697 Intention to treat with violation
across the subgroups by changing the model described above to adjust for subgroup effects rather than inter-vention effects and excluding all control practices from the analysis.
Sensitivity analyses
Because the date on which the academic detailer visited the practice was not reported in approximately 20% of included practices, we conducted a sensitivity analyses in which these practices were excluded (i.e. 22.29% of prac-tices covering 14.10% of observations divided equally between the intervention and the control groups).
Results
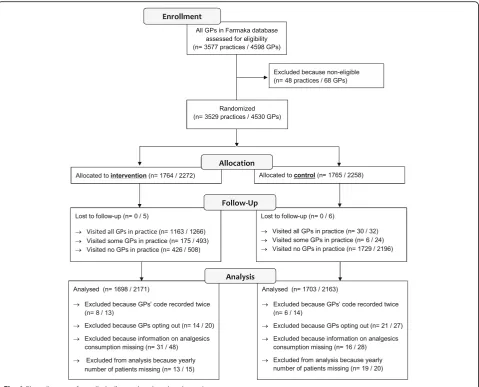
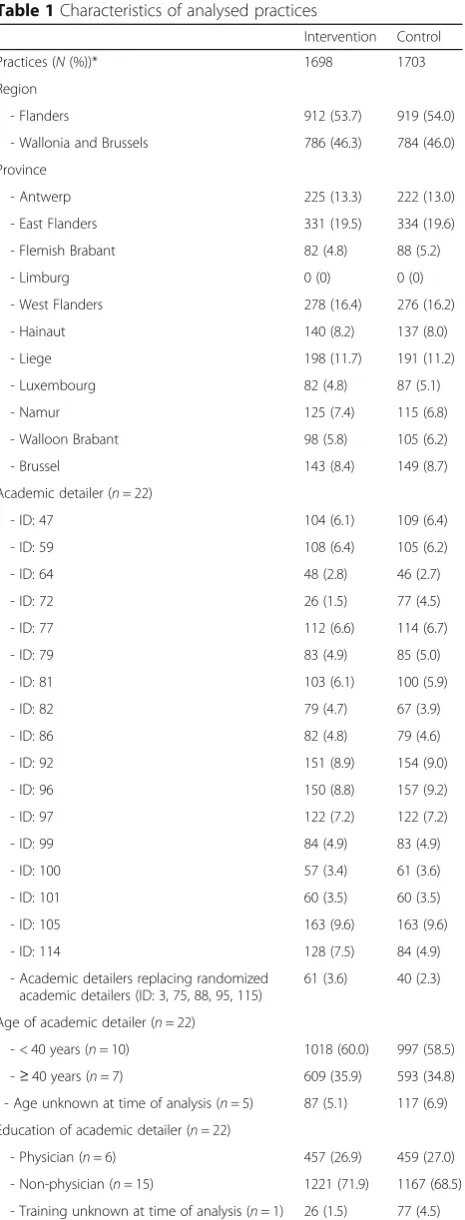
Figure 1 shows the number of practices (and GPs) who were enrolled, allocated, followed up and analysed. Of the 3577 practices (4598 GPs) that were assessed for eligibility, 48 practices (68 GPs) were excluded because they were not professionally active anymore (e.g. retired or deceased). The remaining 3529 practices (4530 GPs) were randomized: 1764 practices (2272 GPs) were assigned to the intervention group and were scheduled to receive a visit by an academic detailer between 10 February and 22 November 2013, and 1765 practices (2258 GPs) were assigned to the control group. There were no practices but 11 GPs for which we could not as-sess whether they had been visited or not (5 GPs in intervention group, 6 GPs in control group). Before analysing the results, we excluded 14 practices (8 (13 GPs) in intervention group, 6 (14 GPs) in control group) because their GP code occurred twice, 35 practices (14 (20 GPs) in intervention group, 21 (27 GPs) in control group) because GPs chose to opt out, 47 practices (31 (48 GPs) in intervention group, 16 (28 GPs) in control group) because we could not obtain any information on consumption of pain relief medication (most likely these GPs stopped practicing) and 32 practices (13 (15 GPs) in intervention group, 19 (20 GPs) in control group) because we could not obtain the number of patients visiting yearly. We analysed 3401 practices (1698 in intervention group, 1703 in control group) including 4334 GPs (2171 in inter-vention group, 2163 in control group). Baseline character-istics were similar in the intervention and the control groups (Table 1).
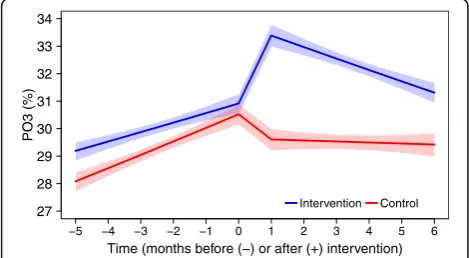
Assessment of effectiveness using primary outcomes The primary analyses (ITT) show that, in general, the odds of being reimbursed for an analgesic or NSAID was decreasing significantly over time. In the tion group, this decrease was stronger after the interven-tion (Table 2). The DPM for paracetamol was increasing significantly over time, without a clear impact of the intervention. The odds of being reimbursed for a recom-mended NSAID when reimbursed for any NSAID was
increasing significantly over time. At the time of the intervention, there was a significant upward shift for the
practices that encountered an academic detailer
compared to practices in the control group. After this shift, the odds slowly, but significantly, decreased again (both in the intervention and the control groups) (Fig. 4). The odds of being reimbursed for an NSAID and a PPI when reimbursed for an NSAID did not change signifi-cantly. Because, for some outcomes, different conclusions were drawn from the other three settings (ITT-V1, ITT-V2 and PPR; results in Appendix), we focus on significant re-sults that are consistent over the four settings (underlined).
Assessment of effectiveness using secondary outcomes The analyses show that the DPM for pain relief medica-tion did not change significantly. The propormedica-tion of patients reimbursed for paracetamol decreased signifi-cantly after the intervention, without a clear shift at the time of intervention (Table 3). The overall proportion of patients reimbursed for any NSAID was decreasing signifi-cantly over time, without a clear impact of the interven-tion. The proportion of patients reimbursed for both an NSAID and a PPI among those reimbursed for an NSAID for the first time in 3 months did not change significantly.
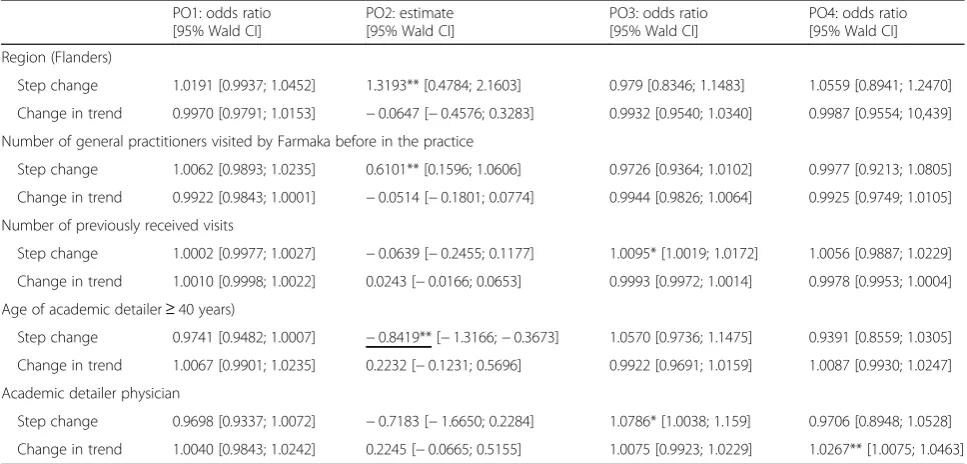
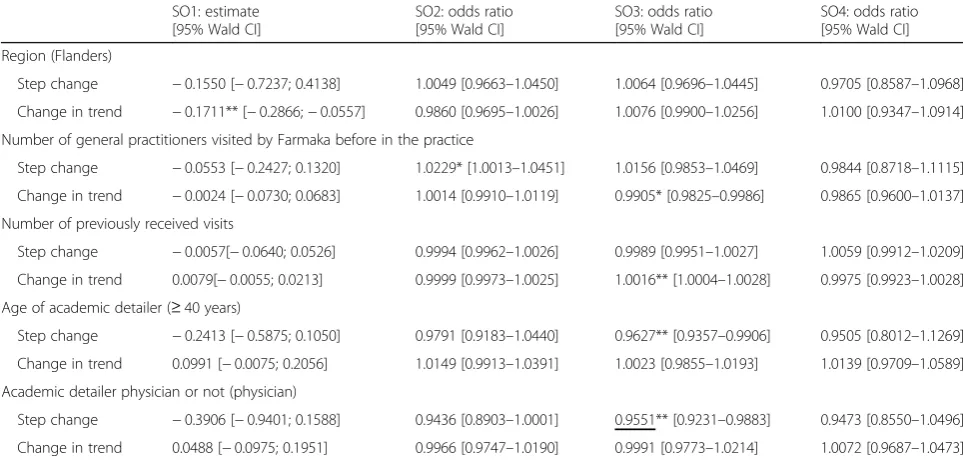
Exploratory subgroup analyses
All characteristics under study had a significant impact on the intervention (Tables 4 and 5). Because different conclusions were reached in the four settings in this exploratory analysis (ITT, ITT-V1, ITT-V2 and PPR), we will focus on significant results that are consistent over the four settings (underlined).
The average DPM of paracetamol shifted downward at the time of the intervention when the academic detailer was aged 40 or above (Fig. 5). The odds of being reim-bursed for an NSAID shifted downward at the time of the intervention when the academic detailer was a phys-ician (Fig. 6). Note that, although a significant shift was observed at the time of the intervention for both out-comes, the predicted outcomes did not differ between visited practices.
Sensitivity analyses
When removing the practices for which no date of visit was recorded from the analysis, similar results were obtained for both the primary and secondary outcome analyses and the exploratory analyses (results not shown).
Discussion
with a recommended NSAID among those prescribed with any NSAID, confirming the usefulness of the ADS in improving appropriate prescribing of pain relief medi-cation. This result supports the effectiveness of the ADS in general, as demonstrated earlier both in Belgium [6, 7] and abroad [25, 26]. However, an impact of the ADS could not be found for the other outcomes under study, indicating that improvements might be very condition and outcome-specific, which might explain why Borgermans et al. and Goldberg et al. could not demonstrate the
Table 1Characteristics of analysed practices
Intervention Control
Practices (N(%))* 1698 1703
Region
- Flanders 912 (53.7) 919 (54.0)
- Wallonia and Brussels 786 (46.3) 784 (46.0)
Province
- Antwerp 225 (13.3) 222 (13.0)
- East Flanders 331 (19.5) 334 (19.6)
- Flemish Brabant 82 (4.8) 88 (5.2)
- Limburg 0 (0) 0 (0)
- West Flanders 278 (16.4) 276 (16.2)
- Hainaut 140 (8.2) 137 (8.0)
- Liege 198 (11.7) 191 (11.2)
- Luxembourg 82 (4.8) 87 (5.1)
- Namur 125 (7.4) 115 (6.8)
- Walloon Brabant 98 (5.8) 105 (6.2)
- Brussel 143 (8.4) 149 (8.7)
Academic detailer (n= 22)
- ID: 47 104 (6.1) 109 (6.4)
- ID: 59 108 (6.4) 105 (6.2)
- ID: 64 48 (2.8) 46 (2.7)
- ID: 72 26 (1.5) 77 (4.5)
- ID: 77 112 (6.6) 114 (6.7)
- ID: 79 83 (4.9) 85 (5.0)
- ID: 81 103 (6.1) 100 (5.9)
- ID: 82 79 (4.7) 67 (3.9)
- ID: 86 82 (4.8) 79 (4.6)
- ID: 92 151 (8.9) 154 (9.0)
- ID: 96 150 (8.8) 157 (9.2)
- ID: 97 122 (7.2) 122 (7.2)
- ID: 99 84 (4.9) 83 (4.9)
- ID: 100 57 (3.4) 61 (3.6)
- ID: 101 60 (3.5) 60 (3.5)
- ID: 105 163 (9.6) 163 (9.6)
- ID: 114 128 (7.5) 84 (4.9)
- Academic detailers replacing randomized academic detailers (ID: 3, 75, 88, 95, 115)
61 (3.6) 40 (2.3)
Age of academic detailer (n= 22)
- < 40 years (n= 10) 1018 (60.0) 997 (58.5)
-≥40 years (n= 7) 609 (35.9) 593 (34.8)
- Age unknown at time of analysis (n= 5) 87 (5.1) 117 (6.9)
Education of academic detailer (n= 22)
- Physician (n= 6) 457 (26.9) 459 (27.0)
- Non-physician (n= 15) 1221 (71.9) 1167 (68.5)
- Training unknown at time of analysis (n= 1) 26 (1.5) 77 (4.5)
Number of previous visits (to at least one general practitioner in the practice)
Table 1Characteristics of analysed practices(Continued)
Intervention Control
- 1 268 (15.8) 276 (16.2)
- 2 229 (13.5) 225 (13.2)
- 3 222 (13.1) 210 (12.3)
- 4 203 (12.0) 197 (11.6)
- 5 214 (12.6) 221 (13.0)
- 6 202 (11.9) 200 (11.7)
- 7 183 (10.8) 190 (11.2)
- 8 150 (8.8) 151 (8.9)
- 9 124 (7.3) 118 (6.9)
- 10 89 (5.2) 87 (5.1)
- > 10 148 (8.7) 136 (8.0)
Number of general practitioners in the practice that were visited by Farmaka before
- 1 1397 (82.3) 1399 (82.1)
- 2 203 (12.0) 200 (11.7)
- 3 or more 98 (5.8) 104 (6.2)
Number of general practitioners 2171 2163
Mean (SD) number of general practitioners per practice
1 (1) 1 (1)
Mean (SD) number of patients (≥60 years) per practice
377 (240) 373 (242)
Proportion of reimbursed prescriptions under study
Analgesics (N02) 37.9 37.9
Paracetamol (N02BE01) 7.5 7.7
Proton pump inhibitor (A02BC) 33.1 33.2
Nonsteroidal anti-inflammatory drug (NSAID; M01A) combined with proton pump inhibitor (A02BC)
5.4 5.3
Nonsteroidal anti-inflammatory drugs (NSAIDS; M01A)
29.0 28.8
Ibuprofen (M01AE01) 6.8 6.7
Naproxen (M01AE02) 1.7 1.6
Recommended NSAIDS (M01AE01 or M01AE02) among all NSAIDS
29.3 28.8
Tilidine (N02AX01) 2.6 2.6
Tramadol (N02AX02) 9.9 9.6
effectiveness of the ADS in their countries [8, 27]. Another explanation might be that the advice to change the pre-scribed drug to a similar safer drug is more easily accepted than the advice to stop prescribing this drug altogether.
Additionally, we found that the profile and age of the AD visitor might impact the effectiveness of the visit. A small, but significant, decrease in the DPM of paracetamol directly after the intervention was observed when the visit was conducted by a visitor aged 40 or above (compared to a visitor aged below 40). Another small, but significant, decrease in the odds of receiving an NSAID directly after the intervention was observed when the visit was con-ducted by a GP (compared to a visitor who is not a GP). A possible explanation for these traits to positively influence the effectiveness of the AD visit might be that GPs are more inclined to believe a more experienced person, ei-ther by training (GP) or by age. Although this was not for-mally tested, visiting at least one GP in a practice seems to have a comparable impact as visiting all GPs in a practice.
Strengths and weaknesses of the study
This study used a cluster-randomized controlled trial to evaluate the effectiveness of visits by academic detailers.
The cRCT is a well-known and trustworthy design, with its objectiveness increased due to blinding of participat-ing practices. Because all practices (and GPs) had received a visit by an academic detailer in the past, they will not have identified the academic detailer’s visit as an intervention, which ensures that the evidence obtained through this trial is real-world evidence, adding to the trustworthiness of the study results. Another major strength of this study is the size of the group of participat-ing practices, which is quite large and hence adds to the validity and precision of the results found in this study.
A major weakness of the study is that this study focuses on reimbursement data while paracetamol is also available over the counter in Belgium. For this reason, we miss information on paracetamol use. We do how-ever assume that patients with chronic arthritis would need chronic pain relief and hence would buy their para-cetamol on prescription, because this is the only way to get a reimbursement for paracetamol. Also note that reimbursement data do not include an indication for the use of pain relief medication. Therefore, we are not ab-solutely sure that the pain relief medication is used for chronic pain relief in osteoarthritis. To increase the probability that the majority of our patients are osteo-arthritis patients, we only considered reimbursement data for patients aged 60 or above. As a result, we assessed the effect of AD visits on use of pain relief medication in general, i.e. in all 60+ patients and not only in those with osteoarthritis.
At the moment of the AD visits, there was also no consensus on the recommended use and safety of paracetamol. In most guidelines, especially at the time of our intervention, paracetamol is suggested as the first-line treatment for chronic osteoarthritis pain (e.g. NICE 2014). However, its effectiveness in pain management of osteoarthritis is currently under debate. A recent systematic review identified (only) seven studies on the use of paraceta-mol on chronic osteoarthritis pain and found negligible clin-ical efficacy of continuous dosing regimens of more than
Table 2Impact of academic detailing visits on primary outcomes in an intention to treat analysis
Step change (β6) [99% Wald CI] Change in trend (β7) [99% Wald CI]
Odds of being reimbursed for an analgesic or NSAID, in intervention compared to control group (PO1)
0.9980 [0.9834; 1.0128] 0.9889 [0.9767; 1.0013]
Average defined daily dose of paracetamol per patient reimbursed for paracetamol per month, in intervention compared to control group (PO2)
−0.3287 [−1.0491; 0.3917] 0.0386 [−0.1973; 0.2745]
Odds of being reimbursed for a recommended NSAID when reimbursed for any NSAID, in intervention compared to control group (PO3)
1.1903*[1.0757; 1.3171] 0.9901 [0.9719; 1.0086]
Odds of being reimbursed for an NSAID and a PPI when reimbursed for an NSAID, in intervention compared to control group (PO4)
1.0217 [0.9243; 1.1294] 0.9926 [0.9685; 1.0173]
Step changedifference in step change between the intervention and control group immediately after the intervention;change in trenddifference between the
change in trend between the intervention and control group after the intervention;CIconfidence interval,NSAIDnonsteroidal anti-inflammatory drug,PPIproton
pump inhibitor; *pvalue < 0.01;underlined< 0.01 in all four analyses (ITT, ITT-V1, ITT-V2 and PPR)
27 28 29 30 31 32 33 34
Time (months before (−) or after (+) intervention)
PO3 (%)
−5 −4 −3 −2 −1 0 1 2 3 4 5 6 Intervention Control
2 weeks, compared with placebo [28]. Similarly, a large meta-analysis showed no or only a very small effect on pain at doses up to 4000 mg/day [29]. Also, the academic detailers themselves referred to the topic as being not up to date [10]. In this respect, it is conceivable that practitioners decide not to follow or not to keep following the recommendation to prescribe paracetamol as a first choice treatment, if their clinical experience and the feedback of their real-world pa-tients are not positive. For this reason, all findings related to KM2 (PO2 and SO2) should be interpreted with great cau-tion. We would expect to find an increased impact of the ADS on topics for which there is more consensus, and future research should focus on verifying the real-world evidence discussed here assessing an AD visit on another topic.
Additionally, this study was not able to cover all Bel-gian practices. About 24% of practices randomized to the intervention group were not reached because no GP could be visited with this topic. Because we focus our main findings on effects that were significant in all four scenarios, and these 24% of practices that were not vis-ited in the intervention group were only (partly) left out of the analysis in (the ITT-V2 and) the PPR scenario, this has no implications on the findings discussed here. Note that these practices differed from the practices that did receive a visit only in the number of previously ceived visits, with a higher number of previously re-ceived visits rendering higher odds of being visited with this topic. This finding suggests that there might be a
Table 3Impact of academic detailing visits on secondary outcomes in an intention to treat analysis
Step change (β6) [99% Wald CI] Change in trend (β7) [99% Wald CI]
Average defined daily dose of analgesic and NSAIDs per patient reimbursed for an analgesic or NSAID per month, in intervention compared to control group (SO1)
0.0630 [−0.2600; 0.3861] 0.0470 [−0.0384; 0.1323]
Odds of being reimbursed for paracetamol, in intervention compared to control group (SO2)
1.0072 [0.9863; 1.0286] 0.9874 [0.9742; 1.0009]
Odds of being reimbursed for an NSAID, in intervention compared to control group (SO3)
1.0087 [0.9913; 1.0263] 0.9913 [0.9773; 1.0056]
Odds of being reimbursed for both an NSAID and a PPI when reimbursed for an NSAID for the first time in 3 months, in intervention compared to control group (SO4)
1.0450 [0.9520; 1.1472] 0.9907 [0.9434; 1.0404]
Step changedifference in step change between the intervention and control group immediately after the intervention;change in trenddifference between the
change in trend between the intervention and control group after the intervention;CIconfidence interval;CIconfidence interval;NSAIDnonsteroidal anti-inflammatory
drug;PPIproton pump inhibitor; *pvalue < 0.05; underlined, < 0.05 in all four analyses (ITT, ITT-V1, ITT-V2 and PPR)
Table 4Covariates’effect on the impact of the intervention on primary outcomes in an intention to treat analysis PO1: odds ratio
[95% Wald CI]
PO2: estimate [95% Wald CI]
PO3: odds ratio [95% Wald CI]
PO4: odds ratio [95% Wald CI]
Region (Flanders)
Step change 1.0191 [0.9937; 1.0452] 1.3193** [0.4784; 2.1603] 0.979 [0.8346; 1.1483] 1.0559 [0.8941; 1.2470]
Change in trend 0.9970 [0.9791; 1.0153] −0.0647 [−0.4576; 0.3283] 0.9932 [0.9540; 1.0340] 0.9987 [0.9554; 10,439]
Number of general practitioners visited by Farmaka before in the practice
Step change 1.0062 [0.9893; 1.0235] 0.6101** [0.1596; 1.0606] 0.9726 [0.9364; 1.0102] 0.9977 [0.9213; 1.0805]
Change in trend 0.9922 [0.9843; 1.0001] −0.0514 [−0.1801; 0.0774] 0.9944 [0.9826; 1.0064] 0.9925 [0.9749; 1.0105]
Number of previously received visits
Step change 1.0002 [0.9977; 1.0027] −0.0639 [−0.2455; 0.1177] 1.0095* [1.0019; 1.0172] 1.0056 [0.9887; 1.0229]
Change in trend 1.0010 [0.9998; 1.0022] 0.0243 [−0.0166; 0.0653] 0.9993 [0.9972; 1.0014] 0.9978 [0.9953; 1.0004]
Age of academic detailer≥40 years)
Step change 0.9741 [0.9482; 1.0007] −0.8419** [−1.3166;−0.3673] 1.0570 [0.9736; 1.1475] 0.9391 [0.8559; 1.0305]
Change in trend 1.0067 [0.9901; 1.0235] 0.2232 [−0.1231; 0.5696] 0.9922 [0.9691; 1.0159] 1.0087 [0.9930; 1.0247]
Academic detailer physician
Step change 0.9698 [0.9337; 1.0072] −0.7183 [−1.6650; 0.2284] 1.0786* [1.0038; 1.159] 0.9706 [0.8948; 1.0528]
Change in trend 1.0040 [0.9843; 1.0242] 0.2245 [−0.0665; 0.5155] 1.0075 [0.9923; 1.0229] 1.0267** [1.0075; 1.0463]
Step changedifference in step change between the intervention and control group immediately after the intervention;change in trenddifference between the
change in trend between the intervention and control group after the intervention;PO1proportion of patients reimbursed for an analgesic;PO2average defined
daily dose of paracetamol per patient reimbursed for paracetamol per month;PO3proportion of patients reimbursed for a recommended nonsteroidal anti-inflammatory
drug (NSAID) among those reimbursed for any NSAID;PO4proportion of patients reimbursed for an NSAID and a proton-pump inhibitor among those reimbursed for an
benefit to familiarity with either the visitor or the ADS. At the time of the study, Farmaka reached about one in three active GPs in Belgium with their ADS [30]. These practices are not reached, because they did not receive a visit by an academic detailer before. These practices are however similar in baseline characteristics to the practices that were reached, and absence of this study group will most likely not have a major impact on the findings reached here. As Anthierens et al. demonstrated, AD visits which are appreciated by GPs, reaching these unvisited practices, and not necessarily all its GPs, would increase the nationwide impact of Farmaka’s ADS [10]. Meanwhile, half of the Belgian GPs are being visited. Another limitation
of the study is that it only reveals short-term effects, as we considered only 6 months after the intervention. This implies that the sustainability of effects more than 6 months after the AD visit could not be assessed.
Conclusions
The ADS provided by Farmaka was effective in improving the proportion of recommended NSAIDs prescribed by GPs. An impact on overall prescription rates of analgesics and NSAIDs was not detected. The implementation of the ADS could be improved further by selecting academic detailers based on their profile and age.
Table 5Covariates’effect on the impact of the intervention on secondary outcomes in an intention to treat analysis
SO1: estimate [95% Wald CI]
SO2: odds ratio [95% Wald CI]
SO3: odds ratio [95% Wald CI]
SO4: odds ratio [95% Wald CI]
Region (Flanders)
Step change −0.1550 [−0.7237; 0.4138] 1.0049 [0.9663–1.0450] 1.0064 [0.9696–1.0445] 0.9705 [0.8587–1.0968]
Change in trend −0.1711** [−0.2866;−0.0557] 0.9860 [0.9695–1.0026] 1.0076 [0.9900–1.0256] 1.0100 [0.9347–1.0914]
Number of general practitioners visited by Farmaka before in the practice
Step change −0.0553 [−0.2427; 0.1320] 1.0229* [1.0013–1.0451] 1.0156 [0.9853–1.0469] 0.9844 [0.8718–1.1115]
Change in trend −0.0024 [−0.0730; 0.0683] 1.0014 [0.9910–1.0119] 0.9905* [0.9825–0.9986] 0.9865 [0.9600–1.0137]
Number of previously received visits
Step change −0.0057[−0.0640; 0.0526] 0.9994 [0.9962–1.0026] 0.9989 [0.9951–1.0027] 1.0059 [0.9912–1.0209]
Change in trend 0.0079[−0.0055; 0.0213] 0.9999 [0.9973–1.0025] 1.0016** [1.0004–1.0028] 0.9975 [0.9923–1.0028]
Age of academic detailer (≥40 years)
Step change −0.2413 [−0.5875; 0.1050] 0.9791 [0.9183–1.0440] 0.9627** [0.9357–0.9906] 0.9505 [0.8012–1.1269]
Change in trend 0.0991 [−0.0075; 0.2056] 1.0149 [0.9913–1.0391] 1.0023 [0.9855–1.0193] 1.0139 [0.9709–1.0589]
Academic detailer physician or not (physician)
Step change −0.3906 [−0.9401; 0.1588] 0.9436 [0.8903–1.0001] 0.9551** [0.9231–0.9883] 0.9473 [0.8550–1.0496]
Change in trend 0.0488 [−0.0975; 0.1951] 0.9966 [0.9747–1.0190] 0.9991 [0.9773–1.0214] 1.0072 [0.9687–1.0473]
Step changedifference in step change between the intervention and control group immediately after the intervention;change in trenddifference between the
change in trend between the intervention and control group after the intervention;SO1average defined daily dose of pain relief medication per patient reimbursed for
an analgesic or NSAID per month;SO2proportion of patients reimbursed for paracetamol;SO3proportion of patient reimbursed for any nonsteroidal anti-inflammatory
drug (NSAID);SO4proportion of patients reimbursed for both an NSAID and a proton-pump inhibitor among those reimbursed for an NSAID for the first
time in 3 months;β6difference in step change due to the intervention;β7difference in the change in trend due to the intervention; *pvalue < 0.05; **p
value < 0.01;underlined< 0.05 in all four analyses (ITT, ITT-V1, ITT-V2 and PPR)
10 15 20 25 30 35 40
Time (months before (−) or after (+) intervention)
PO2
−5 −4 −3 −2 −1 0 1 2 3 4 5 6 Academic detailer Age≥40 Academic detailer Age < 40
Fig. 5Predicted dose (95% confidence bounds) for PO2 in intervention group over time. PO2, average defined daily dose of paracetamol per patient reimbursed for paracetamol per month
3.0 3.5 4.0 4.5 5.0
Time (months before (−) or after (+) intervention)
SO3 (%)
−5 −4 −3 −2 −1 0 1 2 3 4 5 6 Academic detailer is GP Academic detailer is no GP
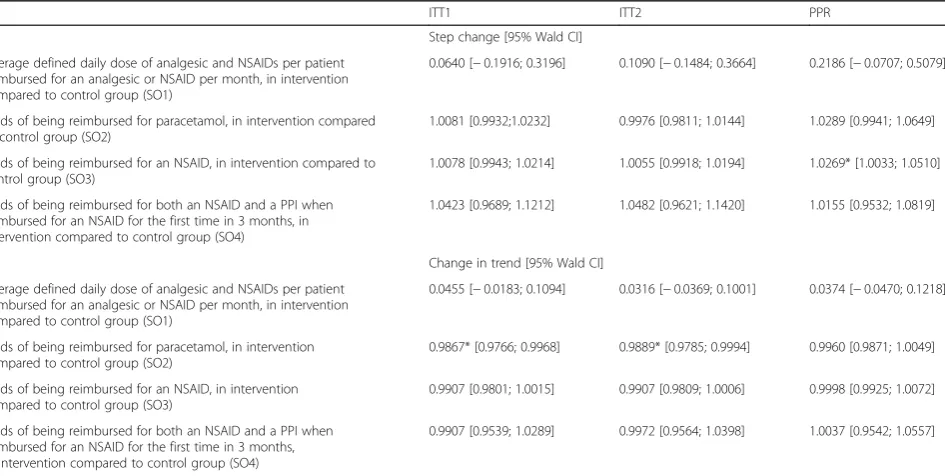
Appendix
Table 6Summary of impact of academic detailing visits on primary outcomes
ITT1 ITT2 PPR
Step change [95% Wald CI]
Odds of being reimbursed for an analgesic or NSAID, in intervention compared to control group (PO1)
0.9973 [0.9860; 1.0088] 0.9929 [0.9780; 1.0081] 1.0218 [0.9982; 1.0459]
Average defined daily dose of paracetamol per patient reimbursed for paracetamol per month, in intervention compared to control group (PO2)
−0.3106 [−0.8493; 0.2281] −0.2442 [−0.8677; 0.3793] −0.2665 [−0.8491; 0.3161]
Odds of being reimbursed for a recommended NSAID when reimbursed for any NSAID, in intervention compared to control group (PO3)
1.1887* [1.1004; 1.2841] 1.2158* [1.1276; 1.3109] 1.2158* [1.1276; 1.3109]
Odds of being reimbursed for an NSAID and a PPI when reimbursed for an NSAID, in intervention compared to control group (PO4)
1.0194 [0.9419; 1.1032] 1.0188 [0.9336; 1.1117] 1.0050 [0.9534; 1.0593]
Change in trend [95% Wald CI]
Odds of being reimbursed for an analgesic or NSAID, in intervention compared to control group (PO1)
0.9882* [0.9790; 0.9975] 0.9896* [0.9806; 0.9987] 0.9990 [0.9945; 1.0035]
Average defined daily dose of paracetamol per patient reimbursed for paracetamol per month, in intervention compared to control group (PO2)
0.0389 [−0.1446; 0.2224] 0.0937 [−0.0686; 0.2560] 0.1400 [−0.0513; 0.3313]
Odds of being reimbursed for a recommended NSAID when reimbursed for any NSAID, in intervention compared to control group (PO3)
0.9902 [0.9775; 1.0030] 0.9894 [0.9776; 1.0013] 0.9882 [0.9753; 1.0012]
Odds of being reimbursed for an NSAID and a PPI when reimbursed for an NSAID, in intervention compared to control group (PO4)
0.9940 [0.9765; 1.0118] 0.9944 [0.9762; 1.0129] 0.9968 [0.9770; 1.0170]
Step changedifference before and after the intervention;change in trendmonthly change after the intervention;CIconfidence interval;NSAIDnonsteroidal
anti-inflammatory drug;PPIproton pump inhibitor;ITT1adjusted intention to treat analysis after dropping contaminated controls;ITT2adjusted intention to treat
analysis after dropping contaminated controls and fully contaminated cases;PPRper protocol analysis; *pvalue < 0.05
Table 7Summary of impact of academic detailing visits on secondary outcomes
ITT1 ITT2 PPR
Step change [95% Wald CI]
Average defined daily dose of analgesic and NSAIDs per patient reimbursed for an analgesic or NSAID per month, in intervention compared to control group (SO1)
0.0640 [−0.1916; 0.3196] 0.1090 [−0.1484; 0.3664] 0.2186 [−0.0707; 0.5079]
Odds of being reimbursed for paracetamol, in intervention compared to control group (SO2)
1.0081 [0.9932;1.0232] 0.9976 [0.9811; 1.0144] 1.0289 [0.9941; 1.0649]
Odds of being reimbursed for an NSAID, in intervention compared to control group (SO3)
1.0078 [0.9943; 1.0214] 1.0055 [0.9918; 1.0194] 1.0269* [1.0033; 1.0510]
Odds of being reimbursed for both an NSAID and a PPI when reimbursed for an NSAID for the first time in 3 months, in intervention compared to control group (SO4)
1.0423 [0.9689; 1.1212] 1.0482 [0.9621; 1.1420] 1.0155 [0.9532; 1.0819]
Change in trend [95% Wald CI]
Average defined daily dose of analgesic and NSAIDs per patient reimbursed for an analgesic or NSAID per month, in intervention compared to control group (SO1)
0.0455 [−0.0183; 0.1094] 0.0316 [−0.0369; 0.1001] 0.0374 [−0.0470; 0.1218]
Odds of being reimbursed for paracetamol, in intervention compared to control group (SO2)
0.9867* [0.9766; 0.9968] 0.9889* [0.9785; 0.9994] 0.9960 [0.9871; 1.0049]
Odds of being reimbursed for an NSAID, in intervention compared to control group (SO3)
0.9907 [0.9801; 1.0015] 0.9907 [0.9809; 1.0006] 0.9998 [0.9925; 1.0072]
Odds of being reimbursed for both an NSAID and a PPI when reimbursed for an NSAID for the first time in 3 months, in intervention compared to control group (SO4)
0.9907 [0.9539; 1.0289] 0.9972 [0.9564; 1.0398] 1.0037 [0.9542; 1.0557]
Step changedifference before and after the intervention;change in trendmonthly change after the intervention;CIconfidence interval;NSAIDnonsteroidal
anti-inflammatory drug;PPIproton pump inhibitor;ITT1adjusted intention to treat analysis after dropping contaminated controls;ITT2adjusted intention to treat
Additional file
Additional file 1: Figure A1.Information package on appropriate use of pain relief medication in patients with osteoarthritis used by the academic detailer (PDF 1229 kb)
Abbreviations
A02BC:ATC code for proton pump inhibitor; AD: Academic detailing; ADS: Academic detailing service; ATC: Anatomic therapeutic chemical; CME: Continuing medical education; cRCT: Cluster-randomized controlled trial; DDD: Defined daily dose; DPM: Number of defined daily doses per patient per month; GEE: Generalized estimating equations; GI: Gastrointestinal; GP: General practitioner; ITT: Intention to treat; KM: Key message; M01A: ATC code for nonsteroidal anti-inflammatory drugs; M01AE01: ATC code for ibuprofen; M01AE02: ATC code for naproxen; N02: ATC code for general analgesics; N02BE01: ATC code for paracetamol; NSAID: Nonsteroidal anti-inflammatory drug; PO: Primary outcome; PPI: Proton pump inhibitor; PPR: Per protocol; RCT: Randomized controlled trial; SO: Secondary outcome
Acknowledgements
We acknowledge Hilde and Stijn from Farmaka for the very helpful collaboration on this project.
Funding
The study is funded by the Federal Agency for Medicines and Health Products (FAMHP; www.famhp.be/en/famhp). They however had no role in the study design, data collection, analysis, interpretation of results or writing the manuscript.
Availability of data and materials
Please contact author for data requests.
Authors’contributions
RB conducted the statistical analyses, contributed to the interpretation of the data and to all versions of the manuscript and was responsible for the final draft. VV and SA contributed to the first draft of the paper and all the revisions. KC contributed to the data management and exploratory analysis of the Intermutualistic Agency data and critically revised a final draft of the manuscript. KA contributed to the acquisition of the Intermutualistic Agency data and critically revised a final draft of the manuscript. BG contributed to the design of the study and the acquisition of the Intermutualistic Agency data and critically revised a final draft of the manuscript. SC conceived the study; developed the protocol; contributed to the acquisition, analysis and interpretation of the data; and contributed to all versions of the manuscript. All authors approve this version of the manuscript.
Ethics approval and consent to participate
The trial was approved by the ethics committee of the University of Antwerp/Antwerp University Hospital (B300201317018).
Consent for publication
Not applicable
Competing interests
The authors declare that they have no competing interests.
Publisher’s Note
Springer Nature remains neutral with regard to jurisdictional claims in published maps and institutional affiliations.
Author details
1
Laboratory of Medical Microbiology, Vaccine & Infectious Disease Institute (VAXINFECTIO), University of Antwerp, Antwerp, Belgium.2Interuniversity Institute for Biostatistics and statistical Bioinformatics (I-BIOSTAT), University of Hasselt, Agoralaan building D, 3590 Diepenbeek, Hasselt, Belgium. 3
Department of Primary and Interdisciplinary Care (ELIZA), University of Antwerp, Antwerp, Belgium.4Intermutualistic Agency (IMA-AIM), Brussels, Belgium.5Department of Epidemiology and Social Medicine (ESOC), University of Antwerp, Antwerp, Belgium.
Received: 3 May 2017 Accepted: 26 December 2017
References
1. Pisacane A. Rethinking continuing medical education. BMJ. 2008;337:a973. https://doi.org/10.1136/bmj.a973
2. Grol R, Grimshaw J. From best evidence to best practice: effective implementation of change in patients’care. Lancet. 2003:1225–30. 3. Cervero RM, Gaines JK. The impact of CME on physician performance and
patient health outcomes: an updated synthesis of systematic reviews. J Contin Educ Heal Prof. 2015;35:131–8.
4. O’Brien MA, Rogers S, Jamtvedt G, Oxman AD, Odgaard-Jensen J, Kristoffersen D, Forsetlund L, Bainbridge D, Freemantle N, Davis DA, Haynes RB, Freemantle N, Harvey EL. Educational outreach visits: effects on professional practice and health care outcomes. Cochrane Database Syst Rev. 2007;(4):1–80. https://doi.org/10.1002/14651858.CD000409.pub2 5. Habraken H, Janssens I, Soenen K, van Driel M, Lannoy J, Bogaert M. Pilot
study on the feasibility and acceptability of academic detailing in general practice. Eur J Clin Pharmacol. 2003;59:253–60.
6. Coenen S, Van Royen P, Michiels B, Denekens J. Optimizing antibiotic prescribing for acute cough in general practice: a cluster-randomized controlled trial. J Antimicrob Chemother. 2004;54:661–72.
7. Berings D, Blondeel L, Habraken H. The effect of industry-independent drug information on the prescribing of benzodiazepines in general practice. Eur J Clin Pharmacol. 1994;46:501–5.
8. Borgermans L, Dubois C, Rieppi S, Vanhaeren S, Geukens N, Fallon C, Claisse F, Massart C, Brunet S, Kohn L, Piérart J, Paulus D. Impact of academic detailing on primary care physicians | KCE. In: KCE reports 125A. Brussel: federaal kenniscentrum voor de gezondheidszorg; 2010.
9. Sherman RE, Anderson SA, Dal Pan GJ, Gray GW, Gross T, Hunter NL, LaVange L, Marinac-Dabic D, Marks PW, Robb MA, Shuren J, Temple R, Woodcock J, Yue LQ, Califf RM. Real-world evidence—what is it and what can it tell us? N Engl J Med. 2016;375:2293–7.
10. Sibyl A, Verhoeven V, Schmitz O, Coenen S: Academic detailers’and general practitioners’views and experiences of their academic detailing visits to improve the quality of analgesic use: process evaluation alongside a pragmatic cluster randomized controlled trial. BMC Health Services Research.17(1):841. https://doi.org/10.1186/s12913-017-2797-8. 11. (UK) NCC for CC:Osteoarthritis. Royal College of Physicians (UK); 2008. 12. Chou R, McDonagh MS, Nakamoto E, Griffin J:Analgesics for Osteoarthritis.
Agency for Healthcare Research and Quality (US); 2011.
13. Henry D, Lim LL, Garcia Rodriguez LA, Perez Gutthann S, Carson JL, Griffin M, Savage R, Logan R, Moride Y, Hawkey C, Hill S, Fries JT. Variability in risk of gastrointestinal complications with individual non-steroidal anti-inflammatory drugs: results of a collaborative meta-analysis. BMJ. 1996;312:1563–6. 14. Massó González EL, Patrignani P, Tacconelli S, Rodríguez LAG. Variability
among nonsteroidal antiinflammatory drugs in risk of upper gastrointestinal bleeding. Arthritis Rheum. 2010;62:1592–601.
15. Hernández-Díaz S, Rodríguez LA. Association between nonsteroidal anti-inflammatory drugs and upper gastrointestinal tract bleeding/perforation: an overview of epidemiologic studies published in the 1990s. Arch Intern Med. 2000;160:2093–9.
16. Belaiche J, Burette A, De Vos M, Louis E, Huybrechts M, Deltenre M. Belgian Study Group of GI Complications: Observational survey of NSAID-related upper gastro-intestinal adverse events in Belgium. Acta Gastroenterol Belg. 2002;65:65–73.
17. Lanza FL, Chan FKL, Quigley EMM. Guidelines for prevention of NSAID-related ulcer complications. Am J Gastroenterol. 2009;104:728–38. 18. Penfold RB, Zhang F. Use of interrupted time series analysis in evaluating
health care quality improvements. Acad Pediatr. 2013;13:S38–44. 19. Lopez Bernal J, Cummins S, Gasparrini A. Interrupted time series regression
for the evaluation of public health interventions: a tutorial. Int J Epidemiol 2016;46(1):348–55.
20. Molenberghs G, Verbeke G. Models for discrete longitudinal data. New York: Springer; 2005.
21. Liang K-Y, Zeger SL. Longitudinal data analysis using generalized linear models. Biometrika. 1986;73:13–22.
Ukoumunne O, Eldridge S, Chinn S, et al. Can the buck always be passed to the highest level of clustering? BMC Med Res Methodol. 2016;16:29. 23. Blommaert A, Hens N, Beutels P: Data mining for longitudinal data under
multicollinearity and time dependence using penalized generalized estimating equations. 2012.
24. Agresti A. Categorical data analysis. Hoboken: Wiley; 2002. 25. Chhina HK, Bhole VM, Goldsmith C, Hall W, Kaczorowski J, Lacaille D.
Effectiveness of academic detailing to optimize medication prescribing behaviour of family physicians. J Pharm Pharm Sci. 2013;16:511–29. 26. Gorin SS, Ashford AR, Lantigua R, Hossain A, Desai M, Troxel A, Gemson D.
Effectiveness of academic detailing on breast cancer screening among primary care physicians in an underserved community. J Am Board Fam Med. 2006;19:110–21.
27. Goldberg HI, Wagner EH, Fihn SD, Martin DP, Horowitz CR, Christensen DB, Cheadle AD, Diehr P, Simon G. A randomized controlled trial of CQI teams and academic detailing: can they alter compliance with guidelines? Jt Comm J Qual Improv. 1998;24:130–42.
28. Ennis ZN, Dideriksen D, Vaegter HB, Handberg G, Pottegård A.
Acetaminophen for chronic pain: a systematic review on efficacy. Basic Clin Pharmacol Toxicol. 2016;118:184–9.
29. da Costa BR, Reichenbach S, Keller N, Nartey L, Wandel S, Jüni P, Trelle S. Effectiveness of non-steroidal anti-inflammatory drugs for the treatment of pain in knee and hip osteoarthritis: a network meta-analysis. Lancet. 2016; 387:2093–105.
30. Jaarverslag 2015 [https://www.farmaka.be/frontend/files/publications/files/ jaarverslag-vzw-farmaka-2015.pdf]. Accessed 29 Dec 2017.
• We accept pre-submission inquiries
• Our selector tool helps you to find the most relevant journal
• We provide round the clock customer support
• Convenient online submission
• Thorough peer review
• Inclusion in PubMed and all major indexing services
• Maximum visibility for your research
Submit your manuscript at www.biomedcentral.com/submit