R E S E A R C H
Open Access
A comparison of prognostic significance of
strong ion gap (SIG) with other acid-base
markers in the critically ill: a cohort study
Kwok M. Ho
1,2,3*, Norris S. H. Lan
4, Teresa A. Williams
5, Yusra Harahsheh
1, Andrew R. Chapman
1,
Geoffrey J. Dobb
1,4and Sheldon Magder
6Abstract
Background:This cohort study compared the prognostic significance of strong ion gap (SIG) with other acid-base markers in the critically ill.
Methods:The relationships between SIG, lactate, anion gap (AG), anion gap albumin-corrected (AG-corrected),
base excess or strong ion difference-effective (SIDe), all obtained within the first hour of intensive care unit (ICU) admission, and the hospital mortality of 6878 patients were analysed. The prognostic significance of each acid-base marker, both alone and in combination with the Admission Mortality Prediction Model (MPM0 III) predicted mortality, were assessed by the area under the receiver operating characteristic
curve (AUROC).
Results: Of the 6878 patients included in the study, 924 patients (13.4 %) died after ICU admission. Except for
plasma chloride concentrations, all acid-base markers were significantly different between the survivors and non-survivors. SIG (with lactate: AUROC 0.631, confidence interval [CI] 0.611–0.652; without lactate: AUROC 0. 521, 95 % CI 0.500–0.542) only had a modest ability to predict hospital mortality, and this was no better than using lactate concentration alone (AUROC 0.701, 95 % 0.682–0.721). Adding AG-corrected or SIG to a
combination of lactate and MPM0 III predicted risks also did not substantially improve the latter’s ability to
differentiate between survivors and non-survivors. Arterial lactate concentrations explained about 11 % of the variability in the observed mortality, and it was more important than SIG (0.6 %) and SIDe (0.9 %) in predicting hospital mortality after adjusting for MPM0 III predicted risks. Lactate remained as the strongest
predictor for mortality in a sensitivity multivariate analysis, allowing for non-linearity of all acid-base markers.
Conclusions: The prognostic significance of SIG was modest and inferior to arterial lactate concentration for
the critically ill. Lactate concentration should always be considered regardless whether physiological, base excess or physical-chemical approach is used to interpret acid-base disturbances in critically ill patients.
Keywords: Acidosis, Anion gap, Alkalosis, Outcomes, Strong ion difference
* Correspondence:[email protected]
1Department of Intensive Care Medicine, Royal Perth Hospital, Wellington Street, Perth, WA 6000, Australia
2School of Population Health, University of Western Australia, Perth, Australia Full list of author information is available at the end of the article
Background
Acid-base disturbances due to either the underlying pathological process or intensive care therapy are common in critically ill patients. Broadly speaking, there are three approaches to assess acid-base distur-bances, including the physiological approach, the base excess (BE) approach and the physical-chemical approach [1]. The physiological approach uses the Henderson-Hasselbalch equation, and arterial pH is assumed to be solely determined by the balance between arterial carbon dioxide tension (respiratory component) and plasma bicarbonate concentration (metabolic component). The BE approach has some similarities to the physiological approach, but it uses the BE instead of bicarbonate to define the metabolic component of acid-base distur-bances. BE is estimated by how much acid or base is needed to adjust the pH back to 7.40 while correcting the arterial carbon dioxide tension to 40 mmHg. Further refinement of these approaches includes anion gap (AG) with and without correcting for hypoalbuminaemia (AG-corrected) to define whether excessive anions other than chloride (Cl−) and bicarbonate are present.
The third approach to quantify acid-base distur-bances is the physical-chemical approach, also called Stewart’s acid-base approach. In this approach, the three main determinants of acid-base status are (i) total carbon dioxide content in vitro (representing carbon dioxide in both dissolved and undissolved forms) or partial pressure of carbon dioxide in vivo, (ii) the weak non-volatile acids (mainly albumin and phos-phate) and (iii) the strong ion difference. Strong ion difference (SID-apparent or SIDa) is the difference between the amount of fully dissociated cations (Na+, K+, Ca2+, Mg2+) and anions (Cl−). The physical-chemical approach to acid-base is more comprehensive than the other two approaches and can identify subtle or combined acid-base disturbances that are not apparent using the physiological or BE approach alone [2, 3]. Furthermore, recent evidence suggested that abnor-malities in SIDa or strong ion gap (SIG) are associ-ated with severity of inflammation, suggesting that abnormal Stewart’s acid-base status may have patho-genic consequences and hence prognostic significance [4]. Stewart’s approach to acid-base disturbances is, however, more complicated than the physiological and BE approaches, and unless such data are automatically generated from the laboratory, a smartphone application may be needed to facilitate interpretation [1].
We hypothesised that SIG may be more important than the other acid-base markers, and Stewart’s ap-proach to acid-base disturbances may be superior to other markers of acid-base status in predicting mor-tality of critically ill patients [5, 6]. If this is the case, it would be essential for SIG to be determined and
monitored regularly in critically ill patients. In this cohort study, we compared the prognostic significance of SIG with other commonly used acid-base markers and determined whether SIG is better than other acid-base markers, either by itself or when combined with a validated prognostic model, in predicting hos-pital mortality of the critically ill.
Methods
In this study, the physiological and biochemical data of the patients on admission to the ICU at the Royal Perth Hospital Intensive Care Unit (ICU) between 1 January 2008 and 31 December 2013 were analysed. Royal Perth Hospital is a 450-bed university teaching hospital, and the 20-bed ICU is a tertiary ICU, staffed by fully trained intensivists, admitting critically ill adult patients of all specialties with the exception of liver transplantation. The dataset contained all the components of the Sim-plified Acute Physiology Score (SAPS) III [7], Acute Physiology and Chronic Health Evaluation (APACHE) II score [8] and Admission Mortality Prediction Model (MPM0 III) [9], as well as biochemical data required to
estimate AG, SIDa and SIG in the blood tests obtained within the first hour of ICU admission [10]. The data on SIG and SIDa were not automatically generated by the laboratory, and none of the clinicians in the study centre used Stewart’s approach to diagnose and manage acid-base disturbances.
The study data were checked for transcription errors and completeness by a designated trained clerical staff member, using data from the computerised laboratory database and going through the ICU vital signs flow chart again before the data were transferred to the computer. A single data custodian was responsible for ensuring data quality. The data were reviewed for in-ternal consistency, and there were no patients lost to follow-up or with missing hospital mortality data. This study utilised only clinical data that were de-identified and all ICU readmissions during the same hospitalisa-tion were excluded, was registered as a clinical audit with the Clinical Safety and Quality Unit (150521-02) and was exempt from review by the Royal Perth Hospital Ethics Committee.
effect from the BE. The methods to estimate and calculate AG, AG-corrected, SIDa (with and without including lactate in the calculations), SID-effective (SIDe), SIG (with and without including lactate in the calculations) and
‘other unmeasured ions’ (or BE gap) are described in Appendix 1.
Statistical analysis
After confirming that the acid-base markers did not have an extreme U-shape relationship with the observed risks of death (Appendix 2) which may compromise the accuracy of the area under the receiver operating charac-teristic curve (AUROC) analysis [11], AUROC was used to compare the discrimination ability of different acid-base markers. The difference in AUROC between diffe-rent acid-base markers derived from the same patients was calculated by the z statistic as described by Hanley and McNeil [12]. We then assessed whether each of these acid-base markers would improve the ability of the MPM0III model to predict hospital mortality of the
cri-tically ill patients by combining each of these markers with the predicted risks of MPM0 III [13], also by
AUROC. In addition, we also assessed whether SIG (with lactate included as part of SIG) or SIDe was supe-rior to arterial lactate concentration in explaining the variability in the observed hospital mortality, based on each predictor’s chi square contribution in a multivariate logistic regression [14], while adjusting for the MPM0III
predicted risks. The MPM0 III prognostic model was
primarily chosen as the preferred risk adjustment model in this study because it does not utilise any laboratory markers of acid-base status, and hence, no one acid-base marker was favoured in terms of its prognostic signifi-cance due to multicollinearity with the risk adjustment prognostic model in the AUROC and logistic regression analyses.
Finally, four separate sensitivity analyses were per-formed; one analysis was on patients with known cirrhosis to assess whether SIG, SIDe or bilirubin concentration was better than arterial lactate in predicting mortality as this specific subgroup of patients was known to have substantial accumulation of unmeasured anions [15, 16]. The second sensitivity analysis was conducted by re-placing the MPM0 III predicted risks with the SAPS
III predicted risks to assess whether SIG or SIDe would be better than lactate concentrations when a different risk adjustment tool was used. The third sen-sitivity analysis was to assess whether the AUROC of the predictors that had some degree of U-shape relationship to mortality (pH, chloride, bicarbonate and arterial carbon dioxide tension) (Appendix 2) would change substantially after centring these predictors [11]. In the last sensitivity analysis, we analysed all acid-base markers in a multivariate analysis, allowing non-linearity
by a 3-knot restricted cubic spline function for all acid-base markers [14, 17].
In this study, a p value < 0.05 was taken as signi-ficant and all statistical analyses were performed by SPSS for Windows (version 22.0, IBM, USA), Med-Calc for Windows (version 12.5, Ostend, Belgium) or S-PLUS (version 8.0, 2007; Insightful Corp., Seattle, WA, USA).
Availability of data and materials
The SPSS dataset supporting the findings of this study will be provided if the readers contact the corresponding author.
Results
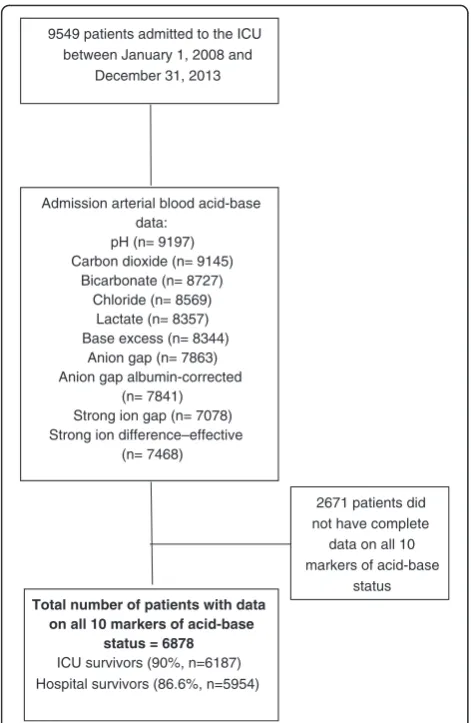
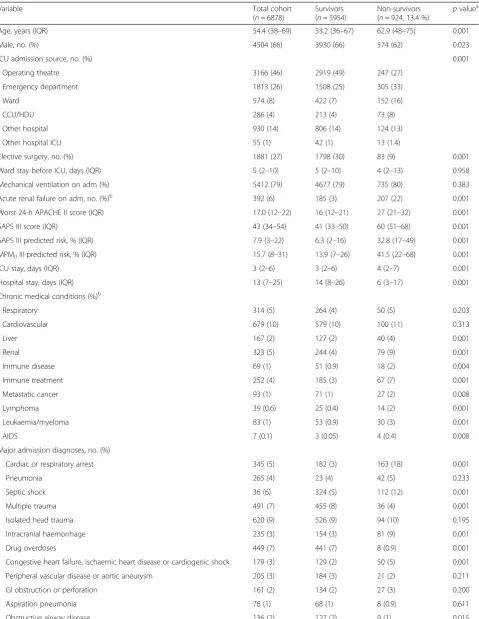
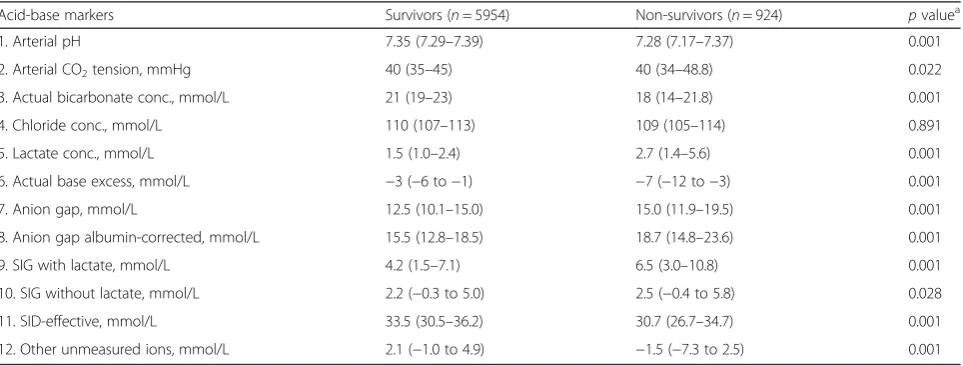
Of the 6878 patients included in the study (Fig. 1), 924 patients (13.4 %) died during the same hospita-lisation after ICU admission. The patients who died were older, with more comorbidities and a higher acuity of acute illness (Table 1). Except for plasma chloride concentrations, all acid-base markers on admis-sion to the ICU were significantly different between hospital survivors and non-survivors (Table 2).
SIG (with lactate: AUROC 0.631, confidence interval [CI] 0.611–0.652; without lactate: AUROC 0.521, 95 % CI 0.500–0.542) only had a modest ability to predict hospital mortality, and this was no better than using lactate concentration alone (AUROC 0.701, 95 % 0.682– 0.721). Arterial lactate concentration, both by itself and in combination with the MPM0 III predicted risks
(AUROC 0.824, 95 % CI 0.809–0.839), had the strongest ability to differentiate between survivors and non-survivors compared to AG (AUROC 0.660, 95 % CI 0.639–0.680), AG-corrected (AUROC 0.665, 95 % CI 0.645–0.686), SID-effective (AUROC 0.634, 95 % CI 0.613–0.655), SIG-with lactate included (AUROC 0.631, 95 % CI 0.611–0.652), SIG-without including lactate (AUROC 0.521, 95 % CI 0.500–0.542) and ‘other unmeasured ions’(AUROC 0.679, 95 % CI 0.658–0.700) (all p values associated with these comparisons were < 0.01) (Table 3). Arterial lactate concentrations also had a good calibration in predicting mortality, with a relatively linear relationship to the risks of observed mortality (Appendix 2). The observed hospital mortality risk of those with an admission lactate concentration > 2 mmol/L was substantially greater than those with an ad-mission lactate concentration≤2 mmol/L (22.6 vs. 8.2 %, p= 0.001).
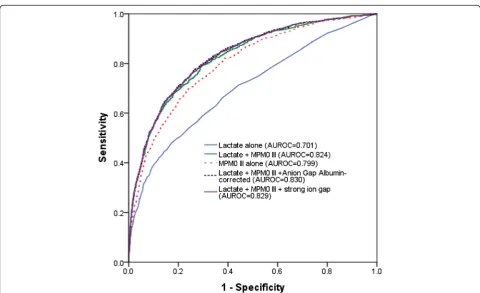
Adding AG-corrected (AUROC 0.830, 95 % CI 0.816–0.845) or SIG-with lactate included (AUROC 0.829, 95 % CI 0.815–0.844) to a combination of lactate and the MPM0 III predicted risks did increase
CI 0.809–0.839; p= 0.007 and p= 0.014, respectively), but the magnitude of improvement was quite small (Fig. 2).
In the multivariate logistic regression model dir-ectly comparing the significance of arterial lactate with SIG-with lactate included and SIDe, arterial lactate concentrations explained about 11 % of the variability in the observed mortality and was, by far, more important than SIG-with lactate (0.6 %) and SIDe (0.9 %), while adjusting for MPM0 III predicted
risks (65 %).
In the sensitivity analysis involving only patients with known cirrhosis (n= 167), the ability of arterial lactate (AUROC 0.734, 95 % CI 0.652–0.816) to dis-criminate between survivors and non-survivors remained better than SIG-with lactate (AUROC 0.644, 95 % CI 0.535–0.753), SIDe (AUROC 0.616, 95 % CI 0.518–0.714) or even bilirubin concentration (AUROC 0.604, 95 % CI 0.500–0.707). Similarly, combining
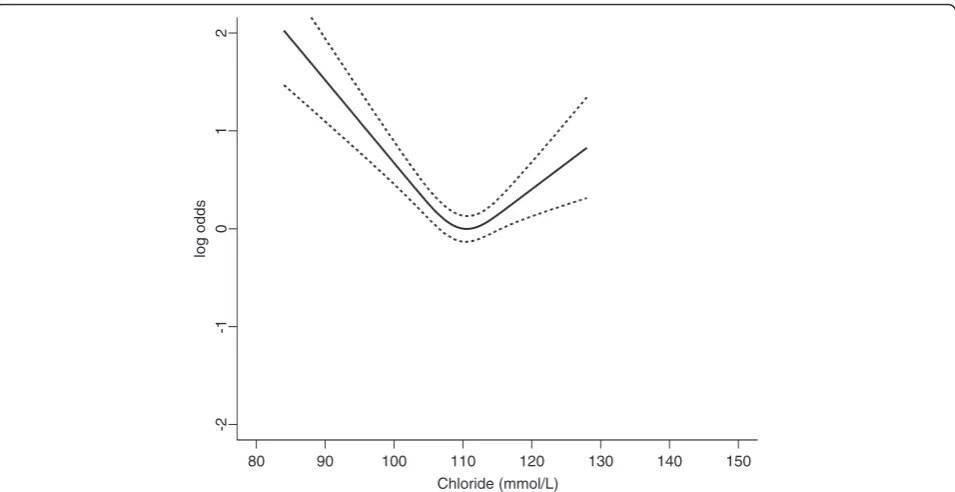
arterial lactate concentrations with SAPS III predicted risks of mortality (AUROC 0.852) was still better than the combination of SIG-with lactate (AUROC 0.836) or SIDe (AUROC 0.835) with the SAPS III predicted risks in differentiating between survivors and non-survivors. After centring the U-shape predictors be-fore the ROC analyses, the improvements in AUROC for pH, chloride, bicarbonate and arterial carbon di-oxide tension were small (all increments < 0.015) and remained inferior to using lactate alone. When all acid-base markers were analysed simultaneously in a multivariate model with a 3-knot restricted cubic spline function allowing non-linearity for all predictors in the model, lactate explained 19 % of the variability in hospital mortality and remained as the strongest predictor for hos-pital mortality compared to other acid-base markers (Fig. 3). In this direct comparison of all acid-base markers while allowing predictors to assume a U-shape relation-ship, chloride became the second most important acid-base predictor (Fig. 4).
Discussion
This study showed that many markers of acid-base status of critically ill patients on ICU admission were significantly different between survivors and non-survivors. Of all the acid-base markers assessed, arte-rial lactate concentration had the best discrimination and was better than SIG (with and without including lactate as part of its calculations) in discriminating between survivors and non-survivors—both when it was analysed on its own and simultaneously with the MPM0 III predicted risks of mortality. Adding SIG to
a combination of lactate and MPM0 III predicted
risks also did not greatly improve our ability to pre-dict mortality of critically ill patients. These findings are clinically relevant and require further discussion.
Evidence suggests that Stewart’s approach to acid-base may help us to identify important metabolic acid-base abnormalities that are not apparent by using the physio-logical or BE approach alone [18]. There were also stu-dies showing that SIG or SIDe could be better than BE, AG or lactate in predicting outcomes of critically ill patients [5, 6, 19–22]. However, many of these studies are relatively small, with the two largest studies (invol-ving 410 and 935 patients) both showing an insignificant advantage by using SIG and SIDe instead of standard markers of acid-base disturbances in predicting mortality of critically ill patients [3, 23, 24]. To the best of our knowledge, this is the largest study (n= 6878) assessing the prognostic significance of SIG (with and without including lactate) relative to 10 other acid-base markers in a heterogeneous group of critically ill patients, and our findings are consistent with the data from two largest published studies [3, 23]. Indeed, both these
9549 patients admitted to the ICU between January 1, 2008 and
December 31, 2013
Admission arterial blood acid-base data:
pH (n= 9197) Carbon dioxide (n= 9145)
Bicarbonate (n= 8727) Chloride (n= 8569)
Lactate (n= 8357) Base excess (n= 8344)
Anion gap (n= 7863) Anion gap albumin-corrected
(n= 7841) Strong ion gap (n= 7078) Strong ion difference–effective
(n= 7468)
Total number of patients with data on all 10 markers of acid-base
status = 6878 ICU survivors (90%, n=6187) Hospital survivors (86.6%, n=5954)
2671 patients did not have complete data on all 10 markers of acid-base
status
Table 1Characteristics of the study cohort
Variable Total cohort
(n= 6878)
Survivors (n= 5954)
Non-survivors
(n= 924, 13.4 %) p valuea
Age, years (IQR) 54.4 (38–69) 53.2 (36–67) 62.9 (48–75) 0.001
Male, no. (%) 4504 (66) 3930 (66) 574 (62) 0.023
ICU admission source, no. (%) 0.001
- Operating theatre 3166 (46) 2919 (49) 247 (27)
- Emergency department 1813 (26) 1508 (25) 305 (33)
- Ward 574 (8) 422 (7) 152 (16)
- CCU/HDU 286 (4) 213 (4) 73 (8)
- Other hospital 930 (14) 806 (14) 124 (13)
- Other hospital ICU 55 (1) 42 (1) 13 (1.4)
Elective surgery, no. (%) 1881 (27) 1798 (30) 83 (9) 0.001
Ward stay before ICU, days (IQR) 5 (2–10) 5 (2–10) 4 (2–13) 0.958
Mechanical ventilation on adm (%) 5412 (79) 4677 (79) 735 (80) 0.383
Acute renal failure on adm, no. (%)b 392 (6) 185 (3) 207 (22) 0.001
Worst 24-h APACHE II score (IQR) 17.0 (12–22) 16 (12–21) 27 (21–32) 0.001
SAPS III score (IQR) 43 (34–54) 41 (33–50) 60 (51–68) 0.001
SAPS III predicted risk, % (IQR) 7.9 (3–22) 6.3 (2–16) 32.8 (17–49) 0.001
MPM0III predicted risk, % (IQR) 15.7 (8–31) 13.9 (7–26) 41.5 (22–68) 0.001
ICU stay, days (IQR) 3 (2–6) 3 (2–6) 4 (2–7) 0.001
Hospital stay, days (IQR) 13 (7–25) 14 (8–26) 6 (3–17) 0.001
Chronic medical conditions (%)b
- Respiratory 314 (5) 264 (4) 50 (5) 0.203
- Cardiovascular 679 (10) 579 (10) 100 (11) 0.313
- Liver 167 (2) 127 (2) 40 (4) 0.001
- Renal 323 (5) 244 (4) 79 (9) 0.001
- Immune disease 69 (1) 51 (0.9) 18 (2) 0.004
- Immune treatment 252 (4) 185 (3) 67 (7) 0.001
- Metastatic cancer 93 (1) 71 (1) 27 (2) 0.008
- Lymphoma 39 (0.6) 25 (0.4) 14 (2) 0.001
- Leukaemia/myeloma 83 (1) 53 (0.9) 30 (3) 0.001
- AIDS 7 (0.1) 3 (0.05) 4 (0.4) 0.008
Major admission diagnoses, no. (%)
Cardiac or respiratory arrest 345 (5) 182 (3) 163 (18) 0.001
Pneumonia 265 (4) 23 (4) 42 (5) 0.233
Septic shock 36 (6) 324 (5) 112 (12) 0.001
Multiple trauma 491 (7) 455 (8) 36 (4) 0.001
Isolated head trauma 620 (9) 526 (9) 94 (10) 0.195
Intracranial haemorrhage 235 (3) 154 (3) 81 (9) 0.001
Drug overdoses 449 (7) 441 (7) 8 (0.9) 0.001
Congestive heart failure, ischaemic heart disease or cardiogenic shock 179 (3) 129 (2) 50 (5) 0.001
Peripheral vascular disease or aortic aneurysm 205 (3) 184 (3) 21 (2) 0.211
GI obstruction or perforation 161 (2) 134 (2) 27 (3) 0.200
Aspiration pneumonia 76 (1) 68 (1) 8 (0.9) 0.611
studies showed that lactate had the strongest ability to differentiate between survivors and non-survivors com-pared to SIG or SIDe (AUROC lactate: 0.67 and 0.77 vs. AUROC SIG: 0.62 and 0.67, respectively), suggesting that arterial lactate concentration should always be con-sidered [1], regardless of the approach used to assess acid-base disturbances in the critically ill. This result also supports the hypothesis that lactate concentration is a preferred resuscitation target in patients with critical illness [25–27].
So, why was SIG or SIDe not better than arterial lac-tate in predicting mortality in our patients? First of all, it may be too simplistic to assume, by intuition, that the prognostic significance of SIG with lactate should be better than using lactate alone just because the former includes lactate and also other biochemical variables. Although the SIG has the ability to reflect acid-base abnormalities as a result of different pathologies, its prognostic significance can also be confounded by changes
in the underlying elements of SIG in different directions. Lactate is an anion and an elevated lactate concen-tration would be, at least in part, accounted for by an abnormal SIG, or SIDe. However, hyperlactataemia can also be ‘concealed’ with a relatively normal SIG, bicarbonate concentration, BE or SIDe, due to coexisting hypochloraemic alkalosis [28]. As such, by combining not so important predictors with an important predictor of mortality (e.g. lactate) within the calculation of SIG, it has the potential to reduce the prognostic significance of SIG. Furthermore, an increase in other measured and unmea-sured anions including ketoacids, formate, oxalate, salicyl-ate, sulphate and phosphate [1], leading to an increase in SIG (and a decrease in SIDe) without hyperlactataemia, also does not have the same prognostic significance as lactic acidosis and is more amendable to specific suppor-tive therapy that can directly improve patient outcomes.
Second, acute and chronic and liver diseases were uncommon in our patients (2 %). Previous studies have
Table 1Characteristics of the study cohort(Continued)
Heart valve surgery 516 (8) 503 (8) 13 (1) 0.001
Coronary artery bypass graft surgery 982 (14) 958 (16) 24 (3) 0.001
Acute lung injury or ARDS 27 (0.4) 22 (0.4) 5 (0.5) 0.398
Gastrointestinal bleeding 125 (2) 106 (2) 19 (2) 0.511
Pulmonary embolism 22 (0.3) 16 (0.3) 6 (0.6) 0.106
All values are median and interquartile range (IQR) in parenthesis unless stated otherwise
Admadmission,GIgastrointestinal,APACHEAcute Physiology and Chronic Health Evaluation,ARDSacute respiratory distress syndrome,CCUcoronary care unit,
HDUhigh dependency unit,ICUintensive care unit,MPM0IIIMortality Prediction Model on admission,SAPSSimplified Acute Physiology Score a
pvalues generated by either Mann-Whitney or chi square test
b
According to the definitions by the APACHE model
Table 2Differences in different markers of acid-base disorders at ICU admission between survivors and non-survivors (n= 6878)
Acid-base markers Survivors (n= 5954) Non-survivors (n= 924) pvaluea
1. Arterial pH 7.35 (7.29–7.39) 7.28 (7.17–7.37) 0.001
2. Arterial CO2tension, mmHg 40 (35–45) 40 (34–48.8) 0.022
3. Actual bicarbonate conc., mmol/L 21 (19–23) 18 (14–21.8) 0.001
4. Chloride conc., mmol/L 110 (107–113) 109 (105–114) 0.891
5. Lactate conc., mmol/L 1.5 (1.0–2.4) 2.7 (1.4–5.6) 0.001
6. Actual base excess, mmol/L −3 (−6 to−1) −7 (−12 to−3) 0.001
7. Anion gap, mmol/L 12.5 (10.1–15.0) 15.0 (11.9–19.5) 0.001
8. Anion gap albumin-corrected, mmol/L 15.5 (12.8–18.5) 18.7 (14.8–23.6) 0.001
9. SIG with lactate, mmol/L 4.2 (1.5–7.1) 6.5 (3.0–10.8) 0.001
10. SIG without lactate, mmol/L 2.2 (−0.3 to 5.0) 2.5 (−0.4 to 5.8) 0.028
11. SID-effective, mmol/L 33.5 (30.5–36.2) 30.7 (26.7–34.7) 0.001
12. Other unmeasured ions, mmol/L 2.1 (−1.0 to 4.9) −1.5 (−7.3 to 2.5) 0.001
All data are median values with the interquartile range reported in parenthesis
CO2carbon dioxide,SIDstrong ion difference,SIGstrong ion gap a
Table 3The areas under the receiver operating characteristic curve (AUROC) of the different markers of acid-base disorders at ICU admission, with and without combining with Admission Mortality Prediction Model (MPM0III) predicted risks of mortality, in differentiating between hospital survivors and non-survivors (n= 6878)
Acid-base markers Mean AUROC (95 % confidence interval [CI])
Without MPM0III With MPM0III
1. Arterial pH 0.655 (0.633–0.677) 0.805 (0.789–0.821)
2. Arterial CO2tension 0.521 (0.499–0.544) 0.798 (0.782–0.814)
3. Actual bicarbonate conc. 0.676 (0.655–0.696) 0.812 (0.796–0.828)
4. Chloride conc. 0.517 (0.495–0.539) 0.801 (0.785–0.816)
5. Lactate conc. 0.701 (0.682–0.721) 0.824 (0.809–0.839)
6. Actual base excess 0.685 (0.664–0.706) 0.813 (0.797–0.829)
7. Anion gap 0.660 (0.639–0.680) 0.813 (0.798–0.828)
8. Anion gap albumin-corrected 0.665 (0.645–0.686) 0.818 (0.803–0.833)
9. Strong ion gap (SIG) with lactate 0.631 (0.611–0.652) 0.812 (0.797–0.827)
10. SIG without lactate 0.521 (0.500–0.542) 0.801 (0.786–0.817)
11. Strong ion difference-effective 0.634 (0.613–0.655) 0.809 (0.794–0.825)
12. Other unmeasured ions 0.679 (0.658–0.700) 0.820 (0.805–0.835)
The AUROC for MPM0III predicted risks of mortality alone was 0.799 (95 % CI 0.783–0.814) and SAPS III predicted risks alone was 0.833 (95 % CI 0.821–0.844). The
AUROC for combining lactate with anion gap albumin-corrected and MPM0III, and combining lactate with SIG and MPM0III were 0.830 (95 % CI 0.816–0.845) and
0.829 (95 % CI 0.815–0.844), respectively
showed that patients with liver diseases often have accu-mulation of unmeasured anions in addition to lactate [15, 16]; hence, SIG and SIDe may have a stronger prog-nostic significance than using lactate alone for these patients. Third, we assessed the prognostic significance
of all the markers of acid-base disturbances in blood samples obtained within the first hour of ICU admission. It is well established that administering large quantity of intravenous fluid to critically ill patients can alter their acid-base status through multiple mechanisms,
80 90 100 110 120 130 140 150
Chloride (mmol/L)
-2
-1
0
1
2
log odds
Fig. 4A U-shape relationship between plasma chloride concentrations and hospital mortality after adjusting for all other acid-base markers.
Dotted linesindicate 95 % confidence interval
0 20 40 60 80 100 120
Chi-Square Minus Degrees of Freedom Lactate (19%)
Chloride (7.9%)
CO2 (2.2%)
pH (2.1%)
Anion gap (0.9%) Unmeasured ions (0.8%) HCO3 (0.7%)
SIG (0.6%)
Base excess (0.4%)
Anion gap corrected (0.4%)
SIDe (0.1%)
including inducing hyperchloraemic acidosis and dilu-tional hypoalbuminaemia. Whether SIG and SIDe may have a stronger association with mortality than arterial lactate in the later phase of critical illness after a large quantity of intravenous fluid is used for resuscitation remains uncertain, and this merits further evaluation.
Although‘other unmeasured ions’(or BE gap) is theo-retically similar to SIG calculated without lactate and has received considerable attention over the years [29, 30], it is not simple to use and was not as good as lactate, both alone and in combination with MPM0III predicted risks,
in predicting mortality of the critically ill. In addition, our study also showed that arterial carbon dioxide tension (AUROC 0.521) and chloride concentrations (AUROC 0.517) were not as important as arterial lactate concen-trations in discriminating between survivors and non-survivors. This may be due to the fact that the underlying causes for both respiratory acidosis and hyperchloraemia are usually obvious to the treating clinicians and are also more readily treatable than lactic acidosis using mechanical ventilation and sodium bicarbonate or di-uretics, respectively.
This study has some limitations. First, although we had included a large number of patients and our results were consistent with largest published studies [3, 23], this was still a single-centre study potentially limiting its general applicability and to different specific subgroups of critically ill patients, especially those with acute liver failure. Second, inherent to all diagnostic tests, noting abnormal results from a diagnostic test is not necessarily translatable to improved outcomes, unless the under-lying pathological process reflected by the diagnostic test can be identified and modified. Finally, temporal changes in acid-base markers during the course of critical illness and after different interventions are common and may affect the prognostic significance of each acid-base marker differently. Whether serial lactate concentrations are the most important acid-base marker to be targeted in the critically ill remains uncertain [25, 27], and this merits further investigation.
Conclusions
In conclusion, many markers of acid-base status in cri-tically ill patients were significantly different between survivors and non-survivors. The prognostic significance of SIG was modest and inferior to arterial lactate concen-tration for the critically ill. Of all the acid-base markers assessed in this large cohort study, arterial lactate concen-tration had the best discrimination—both when it was analysed on its own and simultaneously with the MPM0
III predicted risks of mortality or other acid-base markers while allowing a U-shape relationship for all acid-base markers—suggesting that arterial lactate concentration is the important marker of acid-base disorders in
determining mortality outcome of critically ill patients. Lactate concentration should always be considered re-gardless of which approach is used to interpret acid-base disturbances in critically ill patients; a high lactate concen-tration can be considered as a simple, and yet, important warning acid-base marker for patients who are at risk of dying from critical illness.
Appendices
Appendix 1
Calculated acid-base variables:
Anion gap = [Na+] + [K+]−[Cl−]−[HCO3−]
Anion gap albumin-corrected = anion gap + 0.25 × (42 −observed albumin in g/L)
Strong ion difference-effective (SIDe) = [HCO3−] +
[albumin] × (0.123 × pH − 0.631) + 2 × [phosphate] × (0.309 × pH−0.469)
Strong ion difference-apparent (SIDa) = [Na+] + [K+] + 2 × [Ca2+] + 2 × [Mg2+]−[Cl−]−[lactate]
Strong ion difference-apparent (SIDa with lactate in-cluded) = [Na+] + [K+] + 2 × [Ca2+] + 2 × [Mg2+]−[Cl−]
Strong ion gap = (strong ion difference-apparent) − (strong ion difference-effective)
Strong ion gap with lactate included = (strong ion difference-apparent with lactate) − (strong ion difference-effective)
‘Other unmeasured ions’= base excess (BE) − ‘protein effect’ −‘chloride effect’− ‘water effect’= BE −(0.148 × pH−0.818) × (42−measured albumin in g/L)−(102− measured [Cl−] × 140/measured [Na+]) − 0.3 × (measured [Na+]−140)
Arterial blood gases including lactate, chloride concen-trations were measured by ABL800 FLEX blood gas ana-lyser (Radiometer®, Copenhagen, Denmark) (bias and precision are described in http://www.radiometeramerica. com/~/media/files/radiometercomcloneset/rame/man uals/abl800/989-963i%20abl800%20reference%20man ual%20-%20english%20us.Pdf?bcsi_scan_313cddce030931 be=sI53xPnlknYjOddC3jutx1ef6TcKAAAA7PkeTA==&bc si_scan_filename=989-963i%20abl800%20reference%20 manual%20-%20english%20us.Pdf ).
All concentration measurements used in the calcula-tions are based on millimole per litre.
Appendix 2
Abbreviations
AG:Anion gap; APACHE: Acute Physiology and Chronic Health Evaluation; AUROC: Area under the receiver operating characteristic curve; ICU: Intensive care unit; MPM: Mortality Prediction Model; SAPS: Simplified Acute Physiology Score; SID: Strong ion difference; SIG: Strong ion gap
Competing interests
The authors declare that they have no competing interests.
Authors’contributions
KMH and NSHL did the study design, data collection, data analysis and drafting of the manuscript. TAW did the study design, data collection, data interpretation and drafting of the manuscript. YH, ARC and GJD did the study design, data interpretation and drafting of the manuscript. SM did the study analysis, data interpretation and drafting of the manuscript. All authors agreed with the final version of this manuscript.
Acknowledgements
None.
Funding statement
This study was solely funded by Department of Intensive Care Medicine, Royal Perth Hospital. KMH is funded by the Raine Medical Research Foundation and WA Department of Health through the Raine Clinical Research Fellowship. No funding was received from the National Institutes of Health, NHMRC and Wellcome Trust.
Author details
1
Department of Intensive Care Medicine, Royal Perth Hospital, Wellington Street, Perth, WA 6000, Australia.2School of Population Health, University of Western Australia, Perth, Australia.3School of Veterinary and Life Sciences, Murdoch University, Perth, Australia.4School of Medicine and Pharmacology,
University of Western Australia, Perth, Australia.5School of Nursing, Midwifery and Paramedicine, Curtin University, Perth, Australia.6Critical Care Division, Department of Medicine and Physiology, Royal Victoria Hospital, McGill University Health Centre and McGill University, Montréal, Canada.
Received: 10 May 2016 Accepted: 21 June 2016
References
1. Magder S, Emami A. Practical approach to physical-chemical acid-base management. Stewart at the bedside. Ann Am Thorac Soc. 2015;12: 111–7.
2. Moviat M, van den Boogaard M, Intven F, van der Voort P, van der Hoeven H, Pickkers P. Stewart analysis of apparently normal acid-base state in the critically ill. J Crit Care. 2013;28:1048–54.
3. Dubin A, Menises MM, Masevicius FD, Moseinco MC, Kutscherauer DO, Ventrice E, et al. Comparison of three different methods of evaluation of metabolic acid-base disorders. Crit Care Med. 2007;35:1264–70.
4. Zampieri FG, Kellum JA, Park M, Ranzani OT, Barbeiro HV, de Souza HP, et al. Relationship between acid-base status and inflammation in the critically ill. Crit Care. 2014;18:R154.
5. Dondorp AM, Chau TT, Phu NH, Mai NT, Loc PP, Chuong LV, et al. Unidentified acids of strong prognostic significance in severe malaria. Crit Care Med. 2004;32:1683–8.
6. NovovićMN, Jevdjićt J. Prediction of mortality with unmeasured anions in critically ill patients on mechanical ventilation. Vojnosanit Pregl. 2014;71:936–41.
7. Moreno RP, Metnitz PG, Almeida E, Jordan B, Bauer P, Campos RA, et al. SAPS 3—from evaluation of the patient to evaluation of the intensive care unit. Part 2: development of a prognostic model for hospital mortality at ICU admission. Intensive Care Med. 2005;31:1345–55.
A)
B) E)
F)
H)
I)
K)
L) C)
D) G) J)
8. Knaus WA, Draper EA, Wagner DP, Zimmerman JE. APACHE II: a severity of disease classification system. Crit Care Med. 1985;13:818–29.
9. Higgins TL, Kramer AA, Nathanson BH, Copes W, Stark M, Teres D. Prospective validation of the intensive care unit admission Mortality Probability Model (MPM0-III). Crit Care Med. 2009;37:1619–23. 10. Ho KM, Williams TA, Harahsheh Y, Higgins TL. Using patient admission
characteristics alone to predict mortality of critically ill patients: a comparison of 3 prognostic scores. J Crit Care. 2016;31:21–5. 11. Ho KM. Effect of a U-shape or non-linear continuous predictor on
performance of an ROC curve in differentiating a dichotomised outcome: a simulation study. Anaesth Intensive Care. 2015;43:797–8.
12. Hanley JA, McNeil BJ. A method of comparing the areas under receiver operating characteristic curves derived from the same cases. Radiology. 1983;148:839–43.
13. Ho KM, Burrell M, Rao S. Extracranial injuries are important in determining mortality of neurotrauma. Crit Care Med. 2010;38:1562–8.
14. Ho KM, Knuiman M, Finn J, Webb SA. Estimating long-term survival of critically ill patients: the PREDICT model. PLoS One. 2008;3:e3226. 15. Kellum JA, Kramer DJ, Pinsky MR. Strong ion gap: a methodology for
exploring unexplained anions. J Crit Care. 1995;10:51–5.
16. Gilfix BM, Bique M, Magder S. A physical chemical approach to the analysis of acid-base balance in the clinical setting. J Crit Care. 1993;8:187–97. 17. Ho KM, Leonard AD. Concentration-dependent effect of hypocalcaemia on
mortality of patients with critical bleeding requiring massive transfusion: a cohort study. Anaesth Intensive Care. 2011;39:46–54.
18. Antonogiannaki EM, Mitrouska I, Amargianitakis V, Georgopoulos D. Evaluation of acid-base status in patients admitted to ED-physicochemical vs traditional approaches. Am J Emerg Med. 2015;33:378–82.
19. Sen S, Wiktor A, Berndtson A, Greenhalgh D, Palmieri T. Strong ion gap is associated with mortality in pediatric burn injuries. J Burn Care Res. 2014;35: 337–41.
20. Berndtson AE, Palmieri TL, Greenhalgh DG, Sen S. Strong ion difference and gap predict outcomes after adult burn injury. J Trauma Acute Care Surg. 2013;75:555–60.
21. Funk GC, Doberer D, Sterz F, Richling N, Kneidinger N, Lindner G, et al. The strong ion gap and outcome after cardiac arrest in patients treated with therapeutic hypothermia: a retrospective study. Intensive Care Med. 2009;35:232–9.
22. Kaplan LJ, Kellum JA. Comparison of acid-base models for prediction of hospital mortality after trauma. Shock. 2008;29:662–6.
23. Ratanarat R, Sodapak C, Poompichet A, Toomthong P. Use of different approaches of acid-base derangement to predict mortality in critically ill patients. J Med Assoc Thai. 2013;96:S216–23.
24. Gatz R. Strong ion gap in cardiogenic shock—the calculation seems wrong. Acute Card Care. 2014;16:34.
25. Bloos F, Zhang Z, Boulain T. Lactate-guided resuscitation saves lives: yes. Intensive Care Med. 2016;42:466–9.
26. Dettmer MR, Mohr NM, Fuller BM. Sepsis-associated pulmonary complications in emergency department patients monitored with serial lactate: an observational cohort study. J Crit Care. 2015;30:1163–8. 27. Fuller BM, Dellinger RP. Lactate as a hemodynamic marker in the critically ill.
Curr Opin Crit Care. 2012;18:267–72.
28. Tuhay G, Pein MC, Masevicius FD, Kutscherauer DO, Dubin A. Severe hyperlactatemia with normal base excess: a quantitative analysis using conventional and Stewart approaches. Crit Care. 2008;12:R66.
29. Balasubramanyan N, Havens PL, Hoffman GM. Unmeasured anions identified by the Fencl-Stewart method predict mortality better than base excess, anion gap, and lactate in patients in the pediatric intensive care unit. Crit Care Med. 1999;27:1577–81.
30. Boyle M, Lawrence J. An easy method of mentally estimating the metabolic component of acid/base balance using the Fencl-Stewart approach.
Anaesth Intensive Care. 2003;31:538–47. • We accept pre-submission inquiries
• Our selector tool helps you to find the most relevant journal
• We provide round the clock customer support
• Convenient online submission
• Thorough peer review
• Inclusion in PubMed and all major indexing services
• Maximum visibility for your research
Submit your manuscript at www.biomedcentral.com/submit