S O F T W A R E
Open Access
CognitionMaster: an object-based image analysis
framework
Stephan Wienert
1,2, Daniel Heim
2, Manato Kotani
3,4, Björn Lindequist
5, Albrecht Stenzinger
6, Masaru Ishii
3,4,
Peter Hufnagl
1,5, Michael Beil
7, Manfred Dietel
1, Carsten Denkert
1and Frederick Klauschen
1*Abstract
Background:Automated image analysis methods are becoming more and more important to extract and quantify image features in microscopy-based biomedical studies and several commercial or open-source tools are available. However, most of the approaches rely on pixel-wise operations, a concept that has limitations when high-level object features and relationships between objects are studied and if user-interactivity on the object-level is desired.
Results:In this paper we present an open-source software that facilitates the analysis of content features and object relationships by using objects as basic processing unit instead of individual pixels. Our approach enables also users without programming knowledge to compose“analysis pipelines“that exploit the object-level approach. We demonstrate the design and use of example pipelines for the immunohistochemistry-based cell proliferation quantification in breast cancer and two-photon fluorescence microscopy data about bone-osteoclast interaction, which underline the advantages of the object-based concept.
Conclusions:We introduce an open source software system that offers based image analysis. The object-based concept allows for a straight-forward development of object-related interactive or fully automated image analysis solutions. The presented software may therefore serve as a basis for various applications in the field of digital image analysis.
Keywords:Software, Open source, Image analysis, Object-based image analysis
Background
Image analysis has been an active research field since the development of scientific computing decades ago and since then many biomedical (and other) studies have been reported that rely on image analysis software to support their investigations, e.g. [1-6] just to name a few. Several open source imaging projects exist in that
context with ImageJ [7] as one of the most popular.
Some other projects, e.g.CellProfiler[8],Fiji[9] andicy
[10] are based on ImageJ and provide powerful and
flexible user interfaces including region-of-interest (ROI) selection, data analysis and plug-in interfaces. Other
software frameworks likeOpenCV[11] andITK[12] are
designed as libraries that provide algorithms for the integration into high-level applications. A common feature of the aforementioned solutions is that the basic
processing unit is the single image pixel, which is the smallest processable unit of a digital image containing intensity and color information (see [13] for the measurement of image information). By grouping pixels into distinct segments (referred to as objects) using the pixel intensity/color information or image texture biological meaningful objects and structures may be represented and used for an object-based analysis [14-16]. This can be advantageous when object-related properties (features) and relationships between objects (neighbourhood) have to be taken into account. As an example: After the initial segmentation of certain image objects (e. g. cells) a typical task in image analysis is to classify all objects according to certain features (e. g. dark and bright objects). With our approach the user may easily experiment interactively with the classification step by computing various features (e.g. size, shape localization and color) and then study correlations between different properties to define the optimal classification routine. This is all done on the object level and connected with * Correspondence:[email protected]
1
Institute of Pathology, Charité University Hospital Berlin, Charitéplatz 1, Berlin 10117, Germany
Full list of author information is available at the end of the article
visualization of feature statistics. Another important question is the topological relationship between objects of the different classes. Evaluating topological problems could in principle be solved with the aforementioned pixel-based programs, too, but its implementation becomes less complicated if the basic processing unit is the image-object. Unfortunately, open source software tools that utilize object-based image analysis and cover a broad spectrum of functionality comparable to the flexible pixel-based tools mentioned above are not yet available. Here, we present an object-based open-source software platform that may be used for a broad spectrum of tasks in the field of (biomedical) image analysis: Ranging from algorithm development with an integrated C# compiler to (pipeline-style) one-click analysis provided through a powerful plug-in interface. An object layer structure was designed to handle image objects and their properties and therefore allow high-level formulations of image analysis algorithms. The tool provides flexible and interactive functionality with a variety of image analysis algorithms that may be combined in process chains, an object model editor and visualization/statistics functions. We demonstrate the utility of our approach with the design of an exemplary processing chain for quantifying Ki67 proliferation marker [17,18] in bright-field histological breast cancer. A second example shows the advantages of the object-based software design for the analysis of relationships between objects for the quantification of osteoclast–bone interactions in two-photon fluorescence microscopy data [19,20].
Implementation
CognitionMaster was implemented in C# for Microsoft. NET. SharpDevelop [21] was used for the integrated editing ofC#code. Icons from theTango![22] project were used for the graphical user interface. A documentation of the application programming interface (API) was generated
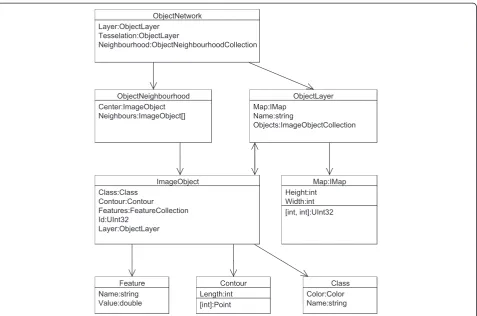
using doxygen [23]. Figure 1 shows the main data
structures, which were designed to organize objects/ segments (instead of image pixels) and their properties and therefore allow for an object-based (with respect to handle image contents) modeling of software applications
and algorithms. The class ImageObject represents a
coherent group of neighbouring pixels (segment). Several properties can be used to describe anImageObjectas the contour for its spatial position or a collection of key value pairs (Features) for properties like mean intensity, object
pixels etc. The ObjectLayer class was designed to
summarize all information of one processing step: it contains a list of allImageObjectsand a two-dimensional map of the same size as the corresponding image which contains the identifier of theImageObjecta pixel belongs to. This map may be used for pixel-based access to objects or pixel-based operations (e.g. distance transformation).
In an analysis pipeline sequential processing modules
ob-tain and pass on their input as ObjectLayer instances
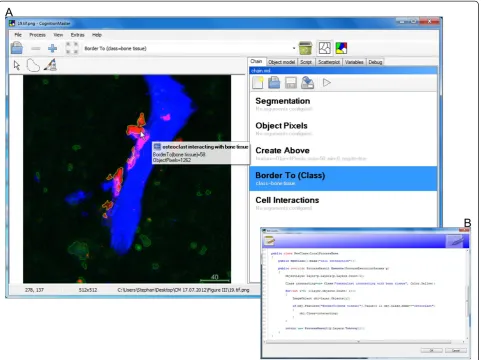
containing all objects and the respective features. Discrete Voronoi tessellation [24] on the object layers map is used to compute the topological relationships. These are represented in anObjectNetworkclass which contains the ObjectNeighbourhoodfor each object. The neighbourhood information can be used, e.g. to compute the length of the border to an object of a certain class or the number of neighbouring objects (or touching objects, respectively) of a certain class. The object-based design makes it easier to communicate between algorithms and handle user interactions: instead of passing a label image (were often the meaning of the labels is implicit) and several lists/ dictionaries containing the related properties only an object layer or even a single object has to be passed. E.g. when the mouse is moved over a certain object the MouseEnterObjectandMouseLeaveObjectevents are fired. The corresponding object is passed with the events data. Via this object reference all consumers of the event get access to all object properties and the corresponding object layer. TheMouseEnterObjectevent, for example, is used to display the classification and features of this object (Figure 2A). Everything that happens is that in the event handler the name of the assigned class and the objects
features are read from the corresponding ImageObject
instance and printed to the popup. The object-based approach also allows for the (multi-) selection of objects in the image and scatter plot diagram. Selected objects are highlighted in both representations (Figure 2A and B). All algorithms can be used within the graphical user interface or in any other .NET application by referencing the CognitionMasterassemblies.
Results
CognitionMasteris a software tool designed to serve as a basis for various interactive and/or fully automated image analysis tasks. The plug-in concept allows for the expansion of the software with new menu entries, tab pages and handling of special image formats, e.g. plug-ins for the support of DICOMaand whole slide imagesb(WSI) are available from the download page. Plug-ins even may extend the image rendering to present additional image (meta) information e.g. image sharpness maps [25] or visited regions [26] in virtual slides, an emerging field of medical imaging [27]. Additionally, plug-ins may change the default behavior of the software (e.g. reactions on mouse and key events) by overriding the corresponding event handler: the ROI manager plug-in enables users to assign labels to points or regions of interest by
mouse-clicks. Besides the application CognitionMaster
offers aC#component library with more than 250 classes (image analysis algorithms, data structures and visual components, etc.). Image analysis algorithms may be
Wienertet al. Diagnostic Pathology2013,8:34 Page 2 of 8
selected from theProcessmenu (Figure 3), whereas results of prior executed algorithms may be used as input for consecutive processing steps. Processing steps may also be combined into processing chains (“analysis pipelines”). Objects are rendered as contours or filled, colored according to an assigned class (Figure 2 and 4) or with a default color if no class is assigned. A debug console may be used to output status messages when writing new algorithms (see in-program scripting section for details). For global data interchange (between plug-ins and/or
in-program scripts) theVarInteropplug-in may be used:
this plug-in manages and displays global variables. For data visualization a two-dimensional interactive scatter plot diagram is available. How objects can be classified best can be tested using the built-in object model editor: This plug-in enables the user to describe the ideal
“model” object with features. This object model may be applied to a certain image and the user may check if his
“object model”meets the real image.
Ki67 proliferation assessment in breast cancer immunohistology samples
In the following section we demonstrate how different methods or hypothesis can be tested using a processing
chain for the quantification of proliferation marker as-sessment in breast cancer using Ki67 immunhistochemic staining [17,18]. Scoring proliferation through Ki67-immunohistochemistry is an important component in predicting response to chemotherapy in breast cancer patients. Therefore, positive and negative stained tumor cells have to be detected and counted by the pathologist in routine diagnostics. If one would like to set up a fully automated scoring system 4 major functions have to be implemented:
a. Detection and segmentation of cell nuclei b. Classification into tumor and non-tumor cells c. Classification into Ki67-positive (Ki67+) and
Ki67-negative (Ki67-) cells
d. Counting of all Ki67+ and Ki67- tumor cells
A method for the detection and segmentation of cell nuclei (a) was introduced recently in [28]. The modules described in this study (contour-based segmentation, non-compact pixel removal and concave object
separ-ation) are standard-components of the CognitionMaster
tumor cells can be distinguished best from non-tumor cells: often non-tumor cells are smaller than tumor-cells or have a different aspect ratio (connective tissue cells are often spindle-shaped). For the validation of these hypothesizes it is important to be able to easily get an impression of the feature values of a certain object or the distribution of a certain feature respectively. Therefore,
users may select one or more features from the Process
menu once the segmentation is executed. The selected features are computed for each object (cell nuclei). Then, features are displayed in a popup when the mouse cursor is moved over a certain object (Figure 2A). Additionally, the scatter plot diagram (Figure 2B) can be used to de-cide which feature and threshold is optimal. For the classi-fication into Ki67+ and Ki67- cells features based on color
deconvolution [29] may be used from the
Immunohisto-chemistrygroup. Finally, the number of cells for each class
are counted using Num(Class) algorithm available from
the Process menu. The complete example including the sample image, the processing chain and a guidance file (readme.txt) can be found in Additional file 1 online.
Cell interaction analysis
In the example described here, we demonstrate the advantages of our object-based approach for the analysis of relationships between objects. Therefore, we use image analysis to test the hypothesis that osteoclast attachment to bone surface as a proxy for bone decomposition is influenced by sphingosine-1-phosphate [19]. The main aspect of this approach is the analysis of interactions
between bone tissue and osteoclasts. CognitionMaster
contains a set of routines/algorithms that allow for the computation and analysis of object neighbourhoods e.g. the ObjectNetwork class (Figure 1) and the NumberOf-Neighbouring and NumberOfTouching features. The first step of the analysis pipeline is the detection of the different types of tissue/cells (bone tissue, osteoclasts, monocytes). Here we re-implemented the detection algorithm including the threshold selection method and channel merging approach presented in the original publication [20] using in-program scripting (Figure 4, see in-program scripting section and the first processing step in the processing chain in Additional file 2 online). Figure 2Image of Ki67 [18] stained breast cancer tissue displayed inCognitionMasterwith Ki67+ tumor cells (red), Ki67- tumor cells (yellow) and normal cells (green).Segmentation was performed according to [28].A. Showing the objects features as a mouse-over effect.B. Scatter plot diagram displaying two features for all image objects (cells) marked in the image on the left: the mean haematoxylin intensity in the H-DAB stain (x-axis) and a form factor given by contour-length2/contour-area (y-axis). The displayed features may be selected by the user once the features are computed (Processmenu).AandB. Objects may be selected in the image or in the scatter plot diagram. Selected objects are highlighted in both presentations (blue).
Wienertet al. Diagnostic Pathology2013,8:34 Page 4 of 8
After the segmentation the next step of the analysis is the computation of the interfacing-length between bone tissue and osteoclasts. This can easily be solved by using the BorderTo feature, which is a standard component of the software and computes the number of contour pixels with a neighbouring pixel of another object class. Finally, the user may export the results containing the object id, class name and features into a .csv file which he may then open with other statistics tools (e.g. Microsoft EXCEL) for further analysis. The complete example containing the sample image, the processing chain and a guidance file (readme.txt) can be found in Additional file 2 online.
In-program scripting
While many image analysis algorithms are already avail-able, the development of new methods is an important field in digital image analysis. Furthermore many image analysis tasks require special pixel- or object-based opera-tions that can hardly be part of common purpose image analysis software e.g. the specialized automatic threshold segmentation and channel merging technique used in the previous section. It can be very helpful to be able to write and execute user-specific source code without needing an extra software project or switching between different applications. A high-execution speed is important while testing the new idea and in the consecutive deployment to other users which should be, however, as simple as possible: it should be possible to use the new code directly among other (standard) components without the need for a re-implementation due to performance or deployment
reasons. CognitionMaster comes with an integrated C#
editor/compiler: this component enables the user to write, compile and execute standard C# code (so called scripts) within the main application (Figure 4B). For most
algorithms contained in the CognitionMaster library
(e.g. watershed-segmentation and extraction of various features) a script comes with the installation and can
be accessed via the Process menu (Figure 3), which is
generated dynamically when the software is launched: Therefore all available scripts and processing chains are read from a certain file directory. This offers the opportunity to add own scripts to this menu. A major advantage of the in-program scripting technique is the high execution speed: the script is compiled using the
standard.NETcompiler and then executed with the same
performance as a normal .NET executable (not an
interpreted script). In contrast, the macro language of ImageJis interpreted and therefore offers lower perform-ance. Additionally, scripts can be combined in processing chains, whereby the source code of a script is copied into the processing chain and compiled when executing. Embedding the source code (instead of linking to it) offers the possibility to change the behavior (source code) of standard components in a certain processing chain. Furthermore, arguments can be denoted for each process-ing step, which avoids the necessity of usprocess-ing input dialogs at each module.
Comparison with ImageJ
With ImageJ the built-in ROI Manager and Particle
Analyzer can be used to analyze images on the
“online” between different rendering modes. In contrast, CognitionMaster allows“online” switching of the render-ing mode (contours, filled, none) and moreover, supports visualization of classification results by rendering each ob-ject with the color of the assigned class. ImageJonly al-lows for the selection of certain objects by using the
object list provided by theROI Manager plug-in.
Free-hand selection or selecting individual objects by mouse-clicks are not supported. Mouse-over feature statistics for a certain object are also not supported byImageJas well as the interactive scatter plot diagram, which are both
available in CognitionMaster (see Figure 2). Finally,
CognitionMaster allows for overriding or extending user-interactions by using the corresponding events (e.g. MouseEnterObject, MouseLeaveObject or SelectedObjects Changed), which is not possible withImageJbecause of the lack of a dedicated object model.
Discussion
Conventional image analysis applications were designed with the single image pixel as basic processing unit. This concept is advantageous when image-to-image transfor-mations (filters) are the main purpose of the software application, but has limitations when image objects and their properties and relationships between objects are considered. In this case the object-based approach allows for the use of high-level features, such as the interactivity with image objects like mouse-over effects (Figure 2A) and data-analysis on the object level through a GUI-based pipeline assembly such as, for instance, the evaluation of spatial relationships between cells. Object-based
approaches, however, require a prioriobject
segmenta-tion/detection, for which the CognitionMaster offers
a variety of established approaches and the option to implement alternative methods using in-program scripting. Figure 4User defined cell interaction analysis of a fluorescent bone image with in-program scripting. A. Processing chain with standard elements (e.g. the computation of the length of the objects border to objects classified as bone tissue) and user-defined in-program scripts (e.g. the segmentation and (primary) classification of the three object types bone tissue (blue), osteoclast (green) and monocyte (red)). Names of processing steps are displayed in large black letters, configured arguments in small gray letters. Segmentation result with red, green and blue contours. Interacting cells with yellow contours.B. Source code editor showing the source code of the“Cell Interactions”processing step that computes the length of the border of osteoclasts to bone tissue and assigns the“osteoclast interacting”class if this length is above zero.
Wienertet al. Diagnostic Pathology2013,8:34 Page 6 of 8
Moreover, using object-based data structures to process object-based image contents facilitates the design of a software architecture compliant to state-of-the-art object-oriented-programming (OOP). This favors clarity of de-sign and especially the reusability of available analysis modules not only in processing pipelines or in-program scripts within theCognitionMaster,but also as components in other .NET projects. In contrast to that, several label maps (or one label map and several lists) are required to store “pixel” to “segment”, “segment” to “features” and
“segment” to“class” mappings in pixel-based approaches, which can hardly be reused (e.g. by inheritance).
Conclusions
We introduce the open source software system CognitionMasterthat features object-based image ana-lysis and implements a large variety of image anaana-lysis algorithms that may be extended using a plug-in interface
or in-program scripting. Therefore,CognitionMaster may
serve as a basis for a broad range of applications in the field of digital image analysis.
Availability and requirements
CognitionMasteris released under the terms of the GNU General Public License (GPL). The installation packages, source code files and documentation for the main application and available plug-ins can be found on http:// sourceforge.net/projects/cognitionmaster/.CognitionMaster
can be installed on all Microsoft Windows PCs (Windows
XPor newer, 32-bit or 64-bit). Microsoft .NET 2.0 is
required. A documentation of the application programming interface (API) is provided with the installation packages.
Endnotes
a
Using ClearCanvas, free
b
Using Virtual Slide Access – SDK 4.0 from VMscope
GmbH (Germany), commercial
Additional files
Additional file 1:Example 1.
Additional file 2:Example 2.
Additional file 3:Comparison with ImageJ.
Competing interests
The authors declare no conflict of interests.
Authors’contributions
SW, FK and DH wrote the paper. SW implemented the software. BL wrote the software manual. FK, AS, CD, PH, MD and MB supervised the software design and architecture and algorithm implementation. DH, AS and FK performed software tests. FK and CD selected and provided histological samples. MI and MK provided the two-photon microscopy data and advised on the image analysis. All authors reviewed the manuscript. All authors read and approved the final manuscript.
Acknowledgements
This work was partly supported by the Grant from the International Human Frontier Science Program (RGY0077/2011) to FK and MI.
Author details 1
Institute of Pathology, Charité University Hospital Berlin, Charitéplatz 1, Berlin 10117, Germany.2VMscope GmbH, Charitéplatz 1, Berlin 10117,
Germany.3Laboratory of Cellular Dynamics, WPI-IFReC, Osaka University, 3-1 Yamada-oka, Suita 5650871Osaka, Japan.4CREST, Japan Science and
Technology Agency (JST), 5 Sanbancho, Chiyoda-ku 1020075Tokyo, Japan.
5University of Applied Sciences Berlin, Wilhelminenhofstraße 75A, Berlin
12459, Germany.6Institute of Pathology, University Hospital Heidelberg, Im Neuenheimer Feld 220/221, Heidelberg 69120, Germany.7Department of
Medicine I, University of Ulm, Albert-Einstein-Allee 23, Ulm 89081, Germany.
Received: 11 January 2013 Accepted: 17 February 2013 Published: 27 February 2013
References
1. Graham J, Taylor CJ:Automated chromosome analysis using the magiscan image analyser.Anal Quant Cytol1980,2:237–242.
2. Salazar I, Cifuentes JM, Sánchez Quinteiro P, Garcia Caballero T:Structural, morphometric, and immunohistological study of the accessory olfactory bulb in the dog.Anat Rec1994,240:277–285.
3. Portet S, Vassy J, Beil M, Millot G, Hebbache A, Rigaut JP, Schoëvaërt D: Quantitative analysis of cytokeratin network topology in the MCF7 cell line.Cytometry1999,35:203–213.
4. Brinkmann M, Lütkemeyer D, Gudermann F, Lehmann J:New technologies for automated cell counting based on optical image analysis; The Cellscreen’.Cytotechnology2002,38:119–127.
5. Gutiérrez R, Gómez F, Roa-Peña L, Romero E:A supervised visual model for finding regions of interest in basal cell carcinoma images.Diagn Pathol
2011,6:26.
6. Grimm M, Krimmel M, Alexander D, Munz A, Kluba S, Keutel C, Hoffmann J, Polligkeit J, Reinert S, Hoefert S:Prognostic value of histamine H1 receptor expression in oral squamous cell carcinoma.Clin Oral Investig2012, Epub ahead of print.
7. Schneider CA, Rasband WS, Eliceiri KW:NIH Image to ImageJ: 25 years of image analysis.Nat Meth2012,9:671–675.
8. Jones TR, Kang I, Wheeler DB, Lindquist RA, Papallo A, Sabatini DM, Golland P, Carpenter AE:Cell profiler analyst: data exploration and analysis software for complex image-based screens.BMC Bioinforma2008,9:482. 9. Schindelin J, Arganda-Carreras I, Frise E, Kaynig V, Longair M, Pietzsch T,
Preibisch S, Rueden C, Saalfeld S, Schmid B, Tinevez J, White DJ, Hartenstein V, Eliceiri K, Tomancak P, Cardona A:Fiji: an open-source platform for biological-image analysis.Nat Meth2012,9:676–682.
10. de Chaumont F, Dallongeville S, Chenouard N, Hervé N, Pop S, Provoost T, Meas-Yedid V, Pankajakshan P, Lecomte T, Le Montagner Y, Lagache T, Dufour A, Olivo-Marin J:Icy: an open bioimage informatics platform for extended reproducible research.Nat Meth2012,9:690–696.
11. OpenCV. http://opencv.org.
12. Yoo TS, Ackerman MJ, Lorensen WE, Schroeder W, Chalana V, Aylward S, Metaxas D, Whitaker R:Engineering and algorithm design for an image processing Api: a technical report on ITK–the insight toolkit.Stud Health Technol Inform2002,85:586–592.
13. Kayser K, Görtler J, Borkenfeld S, Kayser G:How to measure diagnosis-associated information in virtual slides.Diagn Pathol2011,6(Suppl 1):S9. 14. Blaschke T, Strobl J:What’s wrong with pixels? Some recent
developments interfacing remote sensing and GIS.GIS-Zeitschrift für Geoinformationssysteme2001,06:12–17.
15. Hay GJ, Castilla G, Wulder MA, Ruiz JR:An automated object-based approach for the multiscale image segmentation of forest scenes.Int J Appl Earth Obs Geoinf2005,7:339–359.
16. Baatz M, Arini N, Schäpe A, Binnig G, Linssen B:Object-oriented image analysis for high content screening: detailed quantification of cells and sub cellular structures with the cellenger software.Cytometry A2006, 69:652–658.
18. Gerdes J:Ki-67 and other proliferation markers useful for
immunohistological diagnostic and prognostic evaluations in human malignancies.Semin Cancer Biol1990,1:199–206.
19. Ishii M, Egen JG, Klauschen F, Meier-Schellersheim M, Saeki Y, Vacher J, Proia RL, Germain RN:Sphingosine-1-phosphate mobilizes osteoclast precursors and regulates bone homeostasis.Nature2010,465:966. 20. Klauschen F, Ishii M, Qi H, Bajénoff M, Egen JG, Germain RN,
Meier-Schellersheim M:Quantifying cellular interaction dynamics in 3D fluorescence microscopy data.Nat Protoc2009,4:1305–1311. 21. #Develop. http://www.icsharpcode.net/.
22. Tango. http://tango.freedesktop.org/. 23. Doxygen. http://doxygen.org.
24. VelićM, May D, Moresi L:A fast robust algorithm for computing discrete voronoi diagrams.J Math Model Algor2009,8:343–355.
25. Zerbe N, Hufnagl P, Schlüns K:Distributed computing in image analysis using open source frameworks and application to image sharpness assessment of histological whole slide images.Diagn Pathol2011,6:S16. 26. Romo D, Romero E, González F:Learning regions of interest from low
level maps in virtual microscopy.Diagn Pathol2011,6:S22. 27. Kayser K, Görtler J, Borkenfeld S, Kayser G:Interactive and automated
application of virtual microscopy.Diagn Pathol2011,6:S10. 28. Wienert S, Heim D, Saeger K, Stenzinger A, Beil M, Hufnagl P, Dietel M,
Denkert C, Klauschen F:Detection and segmentation of cell nuclei in virtual microscopy images: a minimum-model approach.Sci Rep2012, 2:503.
29. Ruifrok AC, Johnston DA:Quantification of histochemical staining by color deconvolution.Anal Quant Cytol Histol2001,23:291–299.
doi:10.1186/1746-1596-8-34
Cite this article as:Wienertet al.:CognitionMaster: an object-based image analysis framework.Diagnostic Pathology20138:34.
Submit your next manuscript to BioMed Central and take full advantage of:
• Convenient online submission
• Thorough peer review
• No space constraints or color figure charges
• Immediate publication on acceptance
• Inclusion in PubMed, CAS, Scopus and Google Scholar
• Research which is freely available for redistribution
Submit your manuscript at www.biomedcentral.com/submit
Wienertet al. Diagnostic Pathology2013,8:34 Page 8 of 8
![Figure 2 Image of Ki67 [18] stained breast cancer tissue displayed inScatter plot diagram displaying two features for all image objects (cells) marked in the image on the left: the mean haematoxylin intensity in theH-DAB stain (x-axis) and a form factor gi](https://thumb-us.123doks.com/thumbv2/123dok_us/674014.1563531/4.595.57.545.92.397/displayed-inscatter-diagram-displaying-features-objects-haematoxylin-intensity.webp)