• No results found

Inequality of obstetric and gynaecological workforce distribution in China

N/A
N/A
Protected

Academic year: 2020

Share "Inequality of obstetric and gynaecological workforce distribution in China"

Copied!
11
0
0

Loading.... (view fulltext now)

Full text

Figure

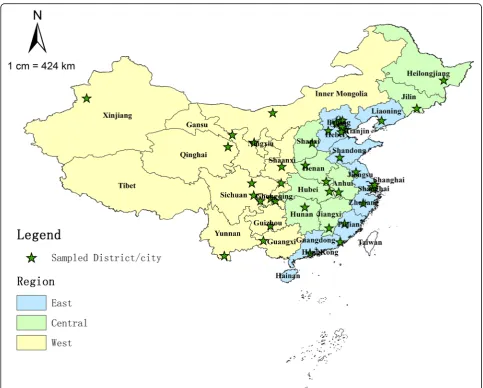
Fig. 1 Map of China showing the East, Central, and West regions and sampled districts/cities
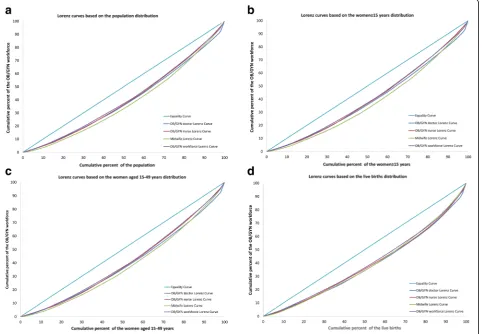
Fig. 2 Lorenz curves for the demographic distributions of different indicators.women a Based on the population distribution; b Based on the ≥15 years distribution; c Based on the of reproductive age distribution; d Based on the live births distribution
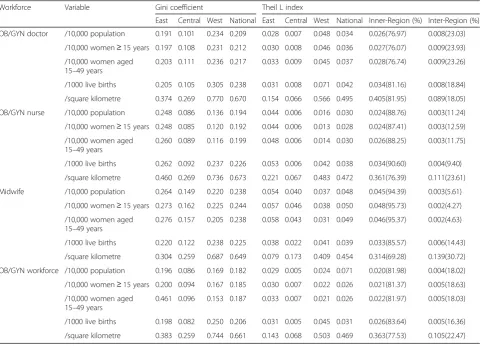
Table 1 Gini coefficients and Theil L indexes of different indicators in the three regions
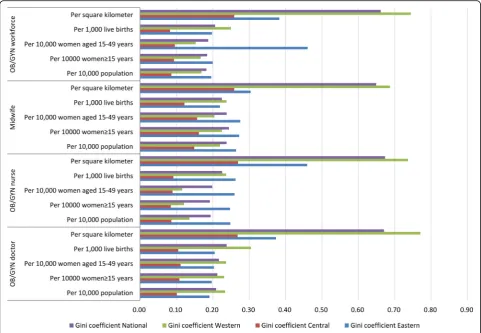
Fig. 3 Comparison of Gini coefficients of different indicators at both national and regional levels
+4

References

Related documents