the Nailfold Videoscopic frames for better enchanced image and thereby helping to have more accurate calculations. In this paper we have first try to enchanced the image/frames by using deconvolution method and Jacob enchancement filter which gives excellent results and improved segmentation for better accurate flow calculations.
Keywords— Blood cells, Image processing, Nailfold capillaroscopy, Velocity measurements.
I.
INTRODUCTION
Since, early diagnosis and sound prognosis of various chronic diseases like sclerosis, arthritis, auto immune diseases etc. require reliable information pertaining to blood flow measurements in the micro vessels, it is therefore of paramount importance to have a technique which is simple, repeatable, highly sensitive and inexpensive method of evaluating micro vascular abnormalities, so that issues related to the accuracy of the measurement are achieved to highest level ,this can be attained by including better segmentation techniques and bringing each frame of Nailfold video into frequency domain and the doing the calculations of the flow that includes velocity measurements.
All the future methods must yield average values well within the experimental error limits of the techniques. The speed of moving particles in the capillaries of the human Nailfold must be evaluated non-invasively more so that the patients do not undergo hardship of invasive methods. In this paper we have surveyed and developed a technique for achieving better improved results which is proposed in section after related work.
II.
RELATED WORK
Cutolo M et al. [1] this paper is work out of the correlation of the microvascular abnormalities, evaluated by nailfold video capillaroscopy (NVC), with the duration of both Raynaud's phenomenon (RP) and systemic sclerosis (SSc) from the date of diagnosis, in a large number of patients with Ssc.The classification of defined major nailfold patterns may be useful in assessing the appearance and progression of sclerodermic microangiopathy. As well, nailfold changes might represent a morphological reproduction of the evolution of Ssc. Ninety-seven consecutive patients were recruited and distributed into 3 groups on the basis of the morphological NVC patterns observed: "early" (E), "active" (A), and "late" (L). In each group the age of patients, age at onset, and the duration of RP as well as of overt SSc were investigated and correlated with the different NVC pattern variables.
Mariusz Paradowski et al. [2] this paper basically calculating Avascular area for detecting abnormality in nailfold capillaries. They have used pattern recognition as a tool for identifying the abnormalities in the vascular capillaries. The pattern recognition techniques include histogram analysis and classification algorithm. The usage of the classifier is based on feature extracted from the frames of the nailfold video. The features can only be extracted if they are segmented properly and considering the background in density variables.
Karthika Ramanathan et al. [3] In their methodology they have used distance measures like Battacharaya distance and the contours of each segmented cell, the growth of blood vessels is tracked when a person is injured and invitro method is used to collect data and observe it. This collected data is in form of images from which the acquisition of cell properties in form of segmented cell having particular gradient and texture are collected are subjected to distance measures for tracking their path with respect to sequential time.
III.
THE PROPOSED METHOD
Fig.3.1 Flow diagram of Improvised Deconvolution Algorithm
The methods we used are all homomorphic in nature to get the right image. In general, our degradation is modeled as a convolution plus noise. Since, in the frequency domain, convolution becomes multiplication. Therefore, we ignore the additive noise, take the log of the multiplication and get addition. Thus, the log of the FT of our degraded image DI is equal to the log of the FT of the original image OI plus the log of the Transfer Function H.
Now that we have addition, we can use statistical estimation to estimate H and thus solve for OI. It was also assumed that we knew the image spectral density Suu and Spectral noise Snn as well after conduction many trails on nailfold images and found in practice we can't ignore the noise. Therefore, we need ways to estimate the log of the multiplication of OI and H plus the Noise Spectrum. It uses the following estimate for H.
𝑙𝑜𝑔 𝐻 =1
M 𝑙𝑜𝑔 𝑉 𝑘 − 𝑙𝑜𝑔 𝑈 𝑘
𝑀
𝑛=1
Uk and Vk are obtained by breaking the input image (u) and degraded image (v) into M smaller blocks and computing their Fourier Transforms. H is then used with Snn and Suu to compute the Wiener Filter. Notice that this method only computes Magnitude of H, so it’s best for phaseless LSI filters. This necessitated our filter design of a phase less h. Our image degration model is the same as always, and we calculated H using the above equation with M = 16. This broke down the images into 64x64 pixel blocks, then deconvolves image I using maximum likelihood algorithm, returning both deblurred image J and a restored point-spread function (PSF) as show below. The PSF can be measured by imaging a point source. The point source must be small enough compared to the camera system's resolution to act as a point source. The frequency (color) of the point source should also closely match light created or reflected by the object.
Fig.3.2 Point-spread Function
Force PSF to satisfy this by normalization: sum to one. Make core for the LR estimation.
Determine next iteration image & apply positivity constraint
Determine next iteration PSF & apply positivity constraint plus normalization. Calculate Max like hood function.
Restore Image/frame ready for motion calculations.
IV.
INTERPRETATION OF RESULTS
The main objective of my research work was to develop an improvised algorithm of Yuan Chen [4] after considering due limitations of the paper.
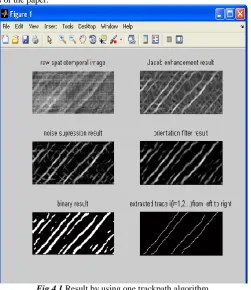
Fig.4.1 Result by using one trackpath algorithm
We concluded and stated in our problem statement that the code needs further optimisation in terms of computational time and in-accuracy in tracking the path as it can be seen in 4.1 and 4.2 diagrams.
Fig.4.2 Result of Proposed Deconvolution algorithm
A. Theratical background of the proposed algorithm:
In mathematics, deconvolution is an algorithm-based process used to reverse the effects of convolution on recorded data. The concept of deconvolution is widely used in the techniques of signal processing and image processing. In general, the object of deconvolution is to find the solution of a convolution equation of the form:
f * g = h
Usually, h is some recorded signal, and ƒ is some signal that we wish to recover, but has been convoluted with some other signal g before we recorded it. The function g might represent the transfer function of an instrument or a driving force that was applied to a physical system. If we know g, or at least know the form of g, then we can perform deterministic deconvolution. However, if we do not know g in advance, then we need to estimate it. This is most often done using methods of statistical estimation.
In physical measurements, the situation is usually closer to
(f * g) + 𝜖 = h
In this case ε is noise that has entered our recorded signal. If we assume that a noisy signal or image is noiseless when we try to make a statistical estimate of g, our estimate will be incorrect. In turn, our estimate of ƒ will also be incorrect. The lower the signal-to-noise ratio, the worse our estimate of the deconvolved signal will be.
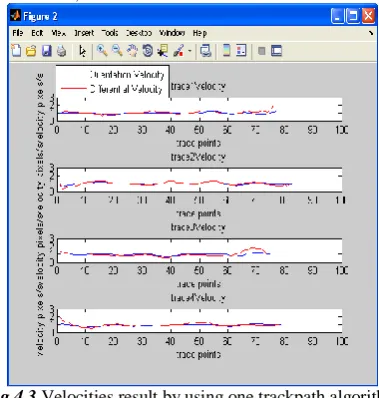
Fig.4.3 Velocities result by using one trackpath algorithm
Fig.4.4 Velocities result of Proposed Deconvolution trackpath algorithm
Orientation velocity: Orientation velocity is a quantitative expression of the amount of rotation that a spinning/moving object (cell, plasma, red blood cells, and white blood cells) undergoes per unit time (of the video frame). It is a vector quantity, consisting of an angular speed component and either of two defined directions.
Orientation velocity is usually represented by the symbol omega (ω, rarely Ω).
The direction of the Orientation velocity vector is perpendicular to the plane of rotation, in a direction which is usually specified by the right-hand rule is measured in the same units as angular speed (radians per second, degrees per second, revolutions per second, or revolutions).
In two dimensions the Orientation velocity ω is given by
𝜔 =𝑑∅ 𝑑𝑡
Fig.4.5 Orientation velocity
The Orientation velocity of a particle is measured around or relative to a point, called the origin. As shown in the diagram (with angles ɸ and θ in radians), if a line is drawn from the origin (O) to the particle (P), then the velocity (v) of the particle has a component along the radius (radial component, v‖) and a component perpendicular to the radius (cross-radial component, v⊥).
Differential velocity: Differential velocity is rate of change of velocity with respect to time. So,
Δ𝑑𝑣=∆𝑣
∆𝑡
B. Time analysis:
Fig.4.6 Bar chart of time analysis
As shown above in the figure 4.6, it can be seen that the improvised algorithm took close to 20-21 seconds to get results but the old algorithm was taking 42-43 seconds.
V.
CONCLUSIONS
All the methods have yielded values well within the experimental error limits of the techniques. The speed of moving particles in the capillaries of the human nail fold is evaluated non-invasively and there is no need for the patients to undergo hardship of invasive methods. Our results have been very promising as it has been able to reduce the computational time of the algorithm and also been able to do tracking of the particles more accurately.
VI.
FUTURE SCOPE
In the introduction as well as in the problem statement we have mentioned problems related to the nailfold capillary flow measurements in which blurring of the frames of the video was the main reason for the low level of accuracy for the flow measurements. Considering this fact we have used de-convolution, de-blurring algorithm to overcome this limitation which has shown very promising results as shown in result section of my thesis work.
However, it is also proposed for the future work that the images/frames of the nailfold capillary video can be further enhanced for more types of the segmentation techniques and we can take also help of some machine algorithm to further automate the process and thus improve the reliability of the algorithm and it will become more useful for medical people for diagnose of diseases like Hyper-tension, fibrosis, arthritis, sclerosis etc.
VII.
ACKNOWLEDGMENT
We would like to thank our friends and our parents for supporting us and showing trust in us which helps us for successfully completing this work.
REFERENCES
[1]. Cutolo M, Pizzorni C, Sulli A.( 2005) “Capillaroscopy” Best Pract Res Clin Rheumatol: 19; 437-52
[2]. Mariusz Paradowski, Halina Kwasnicka, Krzysztof Borysewicz (2009)“Avascular Area Detection in Nailfold Capillary
Images” Proceedings of the International Multiconference on Computer Science and Information Technology.
[3]. Karthika Ramanathan, Lee-Ling S. Ong, H. Harry Asada and Marcelo H. Ang, Jr. (2011) “Automated Tracking of Biological
Cells in an “In-vitro” Environment using Active Contours and Distance Measures” 978-1-61284-200-4/11/$26.00_c IEEE.
[4]. Yuan Chen, (2010) “Nanjing university of aeronautic and astronautic”.
Authors Profile
Miss.Navneet Kaur was born in the small village of Sangrur, Punjab. After finishing high school in Dhuri, she moved to the
BBSBEC Fatehgarh Sahib, Punjab to pursue a Bachelor’s degree in Information Technology. After graduating with a Bachelor of Technology in Information Technology from BBSBEC, Fatehgarh Sahib in 2010, she started her M.tech in Computer Science Engineering from SVIET, Banur (punjab).
Ms. Gurpinder Kaur was born in the small village of Gurdaspur, punjab. She had completed her secondary education from