International Journal of Current
Medical and Pharmaceutical
Research
Available Online at http://www.journalcmpr.com
DOI: http://dx.doi.org/10.24327/23956429.ijcmpr20170277
CASE REPORT
STABILITY INDICATING NORMAL PHASE HPTLC METHOD FOR ESTIMATION OF
SOFOSBUVIR IN BULK DRUG AND PHARMACEUTICAL DOSAGE FORM
Vishal. G. Gadade., Sachin L. Darkunde., Rabindra K. Nanda., Santosh S. Bhujbal
and Ritesh P. Bhole
Dr. D. Y. Patil Institute of Pharmaceutical Sciences and Research, Pimpri,
Pune- 411018, India
ARTICLE INFO ABSTRACT
This paper presents the development and validation of normal phase High Performance Thin Layer Chromatography methods for analysis of Sofosbuvir in Bulk and tablet Dosage form. Chromatography was performed on silica gel 60F254 plate as stationary phase and the mobile phase comprised of Toluene: Methanol (7:3, v/v). Sofosbuvir showed Rf value of 0.60±0.03 was scanned at
265 nm using Camag TLC Scanner 3. Method was validated according to ICH guidelines. Determination of correlation coefficient was found to be 0.9948 in the concentration ranges 200-1200 ng/band. The method was validated for precision and recovery. The limits of detection and quantification were 95 and 200 ng/spot respectively. The developed method was successfully used for the assay of Sofosbuvir tablet formulations. The method is simple, sensitive and precise; it can be used for the routine quality control testing of marketed formulations.
Copyright © 2017 Vishal. G. Gadade et al. This is an open access article distributed under the Creative Commons Attribution License, which permits unrestricted use, distribution, and reproduction in any medium, provided the original work is properly cited.
INTRODUCTION
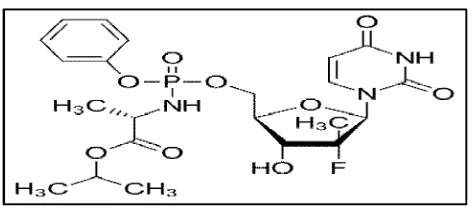
Chronic hepatitis C virus (HCV) infection is currently a major health problem. This virus affects 170 million people in the world and is one of the causes of chronic liver cirrhosis and hepatocellular carcinoma. Sofosbuvir is a newer antiviral drug used for the treatment of Hepatitis C.(1,2)Chemically, It is (S )-isopropyl-2-(S)-(2R,3R,4R,5R
)-5-(2,4-dioxo-3,4-dihydropyrimidin-1(2H )-yl)-4-fluoro-3-hydroxy-4-methyltetrahydrofuran-2-yl)methoxy)-phenoxy) phosphorylamino) propanoate (Fig.No.1).
It is a white to off-white non-hygroscopic crystalline solid. It is slightly soluble in water, freely soluble in ethanol, methanol and acetone, insoluble in hexane. This upon its conversion in
the liver to its active form serves as a nucleotide RNA polymerase inhibitor.(3,4)The activated drug (2‟-deoxy-2‟-α -fluoro-β-C-methyluridine-5‟-triphosphate), acts as a defective substrate for the RNA polymerases. Once this analogue is bound to the RNA polymerases, further synthesis of viral RNAs are inhibited which in turn leads to the termination of viral replication. Literature survey reveals that few HPLC methods are reported for determination of Sofosbuvir and stability indicating HPLC method also reported the spectroscopy method for sofosbuvir is also reported.(5,6,7) However, no HPTLC method is reported for estimation of sofosbuvir in bulk and pharmaceutical Dosage Form. This paper describes a simple, accurate, precise, and sensitive HPTLC method for determination Sofosbuvir in tablets which was optimized and validated in accordance with guidelines suggested through International Conference on Harmonization.
Experimental Work
Instrumentation
HPTLC aluminum plates pre-coated with silica gel 60F254 (10 cm X 10 cm) were from Merck. Densitometry was carried out using Camag TLC Scanner 3 (Camag, Muttenz, Switzerland) fitted with win-CATS software version 4 was used for scanning. Samples were applied as band on the HPTLC plates
Article History:
Received 9th July, 2017 Received in revised form 5th August, 2017
Accepted 25th September, 2017 Published online 28th October, 2017
Key words:
Sofosbuvir, High Performance Thin Layer Chromatography, validation, Tablet.
ISSN: 2395-6429
using the spray-on technique of CamagLinomat V under nitrogen gas flow, and developed in a Camag 10 cm X 10 cm twin trough chamber.
Reference substances, reagents and chemicals
Working standards of sofosbuvir were kindly provided as a gratis sample from TajMahal Vision Chemicals PVT. LTD. Mumbai. All solvents and chemicals used were of analytical grade, purchased from Merck Specialities Pvt. Ltd., India. Marketed tablet formulations used in this study were procured from local market; Myhep 28 tablet, from Mylan Pharmaceutical Industries Ltd.
Chromatographic conditions
Selection of mobile phase
Solutions of 2 μl were applied on precoated silica gel
aluminium plate 60F254, (10×10 cm) 100 μm thickness as
bands of 6 mm using Linomat V. Application positions were at least 15 mm from the sides and 10 mm from the bottom of the plates. Mobile phase components Toluene: Methanol (7:3 v/v) was mixed prior to use and the development chamber was left to saturate with mobile phase vapor for 10 min before each run. Development of the plate was carried out by the ascending technique to a migration distance of 8 cm. Then the plates were dried on a hot plate. Room temperature and relative humidity were always maintained at 25ºC ± 2 and 60 %± 5.Densitometric scanning was done in absorbance mode at 265 nm using a deuterium Lamp.
Sample preparation
A stock solution of Sofosbuvir were prepared by weighing accurately 10 mg of each drug followed by dilution in methanol in 10 ml volumetric flask and volume was made up
to the mark with methanol,(Concentration 1000 μg/ml) The
solution was filtered through 0.2 μ membrane filter.
Calibration plot for Sofosbuvir
Different volumes of standard stock solutions (0.2, 0.4, 0.6,
0.8,1 and 1.2 μl) were applied separately on HPTLC plate to
deliver 200, 400, 600, 800 and 1200 ng/band of Sofosbuvir. Each concentration was applied six times on the HPTLC plate. The correlation coefficients, slopes and Y-intercepts of the calibration curve were determined.
Analysis of marketed formulation
Preparation of standard solution
Accurately weighed quantity 10.0 mg of Sofosbuvir was transferred to 10.0 ml volumetric flask, dissolved and diluted up to the mark with mobile phase. From above solution, 1.0 ml of solution was diluted to10.0 ml with methanol. (Concentration 100 μg/ml for Sofosbuvir). The solution was
filtered through 0.2 μ membrane filter.
Fig 2 Spectra for Sofosbuvir
Fig 3 Calibration curve for linearity y = 5.202x + 472.5
R² = 0.994
0 1000 2000 3000 4000 5000 6000 7000 8000
0 500 1000 1500
P
e
a
k
a
r
e
a
conc (ng/band)
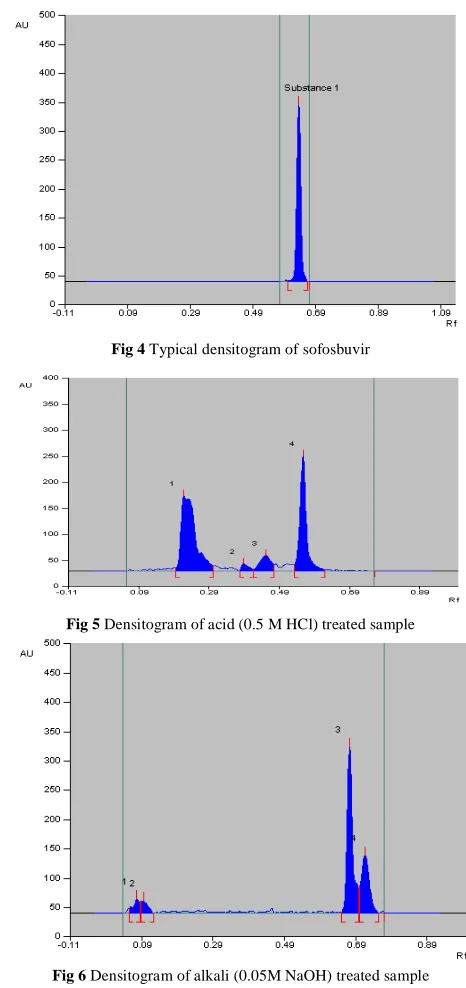
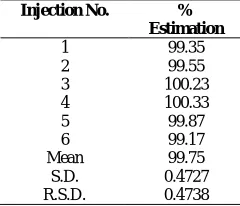
Fig 4 Typical densitogram of sofosbuvir
Fig 5 Densitogram of acid (0.5 M HCl) treated sample
Preparation of sample solution
The tablet powder equivalent to 10mg of drug was weighed followed by dilution in methanol in 10 ml volumetric flask and volume was made up to the mark with methanol. 5ml methanol was added and ultrasonicated for 15 min., volume was then made up to the mark with methanol. The solution was filtered by using Whatman filter paper No. 42. From this solution, 1.0 ml of solution was then diluted to 10.0 ml with methanol. The resulting solution was used as sample solution. On the TLC plate two bands of standard stock solution A and four bands of sample solution of band width, 6.0mm each, were applied and the plate was developed and scanned under the optimum chromatographic condition After scanning the peak obtained for standard and sample bands were integrated. Amount of drug present in sample was calculated by comparing the mean peak area of sample band with that of the standard band.
Method validation
The method was validated in compliance with ICH guidelines
Accuracy
Accuracy of method was ascertained by spiking with standard at three concentration levels (80, 100 and 120%) in triplicate. Recovery studies for Sofosbuvir were carried out by spiking three different amounts of Sofosbuvir standard (480, 600 and 720 ng) to the marketed tablet dosage form (600 ng/band).
Precision
Precision of the developed method was studied by considering intra-day precision, inter-day precision and variation between analysts.
Robustness
The change in composition of the mobile phase, volume of mobile phase, and chamber saturation time was involved in this study. The composition and volume of the mobile phase were varied in the range of ± 0.1 ml and ± 10%, respectively, of the used optimized conditions. Time variations for chamber saturation were varied ± 5 min. Spotting development time also varied from 5min to 1hrs.Development to scanning time interval also varied from 5min to 1hrs. The effects of these changes on the Rf values were evaluated by calculating the
relative standard deviations (%RSD).
Limit of detection (LOD) and Limit of quantitation (LOQ)
As per ICH guideline, limit of detection (LOD) and limit of quantitation (LOQ) were separately determined of the developed method and were calculated from the standard deviation of the response and slope of the calibration curve of each drug using the formulae, limit of detection=3.3×σ/S and
limit of quantitation=10×σ/S, where, σ is standard deviation of
response and S is the slope of calibration curve.
Forced degradation studies
In order to ensure that the analytical method was stability indicating, stress studies were performed.
1. Acid Degradation Studies: To 3 ml of 0.1Mhydrochloric acid was added 10mg of standard drug and tablet powder equivalent to 10mg. Heat it for 3hrs at 80ºC. 2. Alkali Degradation Studies: To 3 ml of 0.05MSodium
hydroxide was added 10mg of standard drug and tablet powder equivalent to 10mg. Heat it for 3hrs at 80ºC. 3. Oxidation Studies: To 3 ml of 3% hydrogen peroxide
was added 10mg of standard drug and tablet powder equivalent to 10mg. Heat it for 3hrs at 80ºC.
RESULTS AND DISCUSSION
Optimization of procedures
Several trials were made by using different solvent systems containing non-polar solvents and relatively polar solvents. Different proportions of chloroform, ethyl acetate, methanol, and ammonia were tried while selection of mobile phase. Among the mobile phase combinations tested, Toluene: Methanol (7:3 v/v) was finalized as mobile phase. This combination shows the good and sharp peak which gave the Rf
value at 0.60 ±0.03 at detection wavelength 265nm.
Linearity
Linearity for both the drugs was tested in the concentration range 200-1200 ng/band. The solutions were chromatographed six times, in accordance with the International Conference on Harmonization. Plots of calibration for Sofosbuvir were constructed by plotting peak area against the respective concentrations, and the method was evaluated by determination of the correlation coefficient and intercept, calculated in the corresponding statistical study (ANOVA; P < 0.05). R2values>0.999 and intercepts very close to zero confirmed the good linearity of the method.
Analysis of marketed formulation
Analysis of Sofosbuvir tablet market formulation (10mg) was performed and results were expressed as percentage amount of the label claim. The amount of Sofosbuvir was estimated by comparing the peak area of sample with that of the standard bands.
Fig 7 Densitogram of oxide (3 % H2O2) treated sample
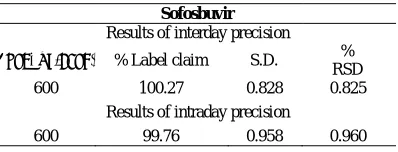
Table 1 Results of Analysis of marketed formulation
Injection No. %
Estimation
1 99.35
2 99.55
3 100.23
4 100.33
5 99.87
6 99.17
Mean 99.75
S.D. 0.4727
The Sofosbuvir content was found to be close to 100 % and the results were summarized in Table 1. No interference of the Excipients was found during analysis of drug formulation. The low value of SD indicated the suitability of this method for routine analysis.
Recovery studies
The mean percentage recovery for the compound was calculated at each concentration level and reported with its standard deviation. The results obtained for Sofosbuvir at 80 %, 100 % and 120 %concentration levels were 99.85 ± 0.40, 99.76 ± 0.57and 100.13 ± 0.53 respectively. In conclusion, the method was considered to have an acceptable recovery and trueness.
Precision
Repeatability and intermediate precision of the developed method were performed for Sofosbuvir in terms of % RSD. The % RSD for both intra-day and inter-day precision of the method was found to be less than 2%.
Robustness
The standard deviations of peak areas were calculated for the a for mentioned four parameters (variation in composition of the mobile phase, Volume of mobile phase, development to scanning and spotting to development time and chamber saturation time) and coefficients of variation were found to be less than 2% in all cases as shown in Table 4. The low CV values indicate the robustness of the method
Forced degradation studies
HPTLC studies of the samples obtained during the stress testing of Sofosbuvir under different conditions. Different degradation peaks are shown in figures 3-7. The mass balance is a process of adding together the assay value and the levels of degradation products to see how closely these add up to 100% of initial value of drug. The amount of drug recovered after degradation studies and the Rf of the degradation products are
given in table 4. (Table 4)
Limit of detection (LOD) and limit of quantitation (LOQ)
The limit of detection and limit of quantification values, calculated as described above, for Sofosbuvir were found to be 1.93 ng/band and 5.86 ng/band, respectively.
CONCLUSION
A new HPTLC method has been developed for the identification and quantification of Sofosbuvir in formulations. The method was found to be simple, sensitive, precise, accurate and specific for estimation and can be conveniently employed for the routine quality control analysis of Sofosbuvir tablets.
Acknowledgement
The authors are very thankful to Principal, Dr. D.Y. Patil Institute of Pharmaceutical Sciences and Research, Pimpri, Pune for providing necessary facilities. The authors are also thankful to TajMahal Vision Chemicals PVT. LTD. Mumbai, India, for providing the gift sample of Sofosbuvir API.
Reference
1. Mohd HK, Groeger J, Flaxman AD, Wiersma ST,(2013), Global epidemiology of hepatitis C virus infection: new estimates of age-specific antibody to HCV seroprevalence, Hepatology, 57,1333-42.
2. Isaac N, Christudas M. Sofosbuvir: New and promising treatment for hepatitis C virus infection-A review.
World J Pharmacy and Pharmaceutical sciences.2015;
4(9);318-326.
3. Jeyabaskaran M, Rambabu C, Rajinikanth V. A New RP-HPLC method development and validation of sofosbuvir in bulk and pharmaceutical dosage form. J
Pharmacreation. 2014;1(4);125-133.
4. Nemade R, Dole M, Sawant S. Development and validation of stability indicating RP-HPLC method for the estimation of sofosbuvir by forced degradation studies. World J Pharmacy and Pharmaceutical
sciences. 2017; 6(4); 1503-1512.
5. Vikas P, Satyanarayana T, Kumar D. Development and validation of new RP-HPLC method for the determination of sofosbuvir in pure form. World J
Pharmacy and Pharmaceutical sciences. 2016;
5(5);775-781.
6. Vejandla R, Subramanyam C, Veerabhadram G. Estimation and validation sofosbuvir in bulk and tablet dosage form by RP-HPLC. International J Pharmacy. 2016; 6(2); 121-127.
7. Khedkar P, Mahajan M. Development and validation of UV spectrophotometric method for the estimation of sofosbuvir in bulk and tablet formulation. International
J Pharma Research and review. 2017;6(3);1-4.
Table 2 Result of Recovery studies
Level of recovery % recovery
80 100.3 99.75 99.5 100 100.4 99.59 99.30 120 100.66 99.66 100.08 Mean of recovery
S.D. 99.60
0.462
R.S.D. 0.463
Table 3 Result of intermediate precision study
Sofosbuvir
Results of interday precision
Conc.(μg/band) % Label claim S.D. % RSD
600 100.27 0.828 0.825
Results of intraday precision
600 99.76 0.958 0.960
Table 4 Results of forced degradation studies
Stress condition degraded products
Assay of active substance%
Rf values of
Acid( 0.1 M HCl) Base (0.05 M NaOH)
Oxide ( 3% H2O2) Neutral ( Distilled water)
8. ICH, (Q2R1), Harmonized Tripartite Guideline, Validation of analytical procedures: Text and Methodology, IFPMA. Geneva, 2005.
9. ICH, (Q2A), Harmonized Tripartite Guideline, Text on Validation of Analytical Procedures. IFPMA. Geneva, 1994.
10. ICH, (Q2B), Harmonized Tripartite Guideline, Validation of Analytical Procedures: Methodology, Text and Methodology, IFPMA. Geneva, 1996.