STUDY &ANALYSIS OF AN URBAN BUS AND
METRO ROUTE USING VISSIM SIMULATED
DATA
B.Brahmaiah1 and A.Devi Prasad2
RESEARCH REVIEW
Eluru et al. (2012) examined the effect of the performance of the public transportation system on commuter travel mode and transit route choice in Montreal, Canada. They observed the factors that discourage individuals from using public transit and also the reasons that effect transit route choice decisions. Information related to travel patterns, socio-demographic aspects and residential location was collected. Multinomial logit model was used for the travel mode choice analysis and a mixed multinomial logit model was used for the transit route choice analysis.
Sebastian et al. (2011) incorporated network topology in a route choice model for public transit network. The topological variables represent directness of the chosen route and user knowledge of the network. The necessary data for these variables is simple to obtain.
Bhatta et al. (2011) pronounced that level of service attributes are the important factors for defining the travel demand on multinomial logit model. They have made attempts to investigate
1
Department of Civil Engineering Vignan’s Institute Of Information Technology, Visakhapatnam, A.P, India.
2
Department of Civil Engineering Vignan’s Institute Of Information Technology, Visakhapatnam, A.P, India.
Abstract: Delhi has been taken as study area to measure the performance analysis of the bus and multimodal transit route. The main objective of this work is to measure the performance of direct route and multimodal route in terms travel time, travel cost, transfer time, waiting time and line haul time. For this analysis, data was collected as commuter travel survey.
In this study VISSIM (simulation modal) software were used simulate the bus and metro travel times, pedestrian transfer times and waiting times at varies transit stops for selected network, and analyse the travel times and delays at various segments in the network.From the commuter travel survey questionnaires and simulated travel time elements, some (OVTT, IVTT, cost, reliability, comfort age and gender) variables were used to define the utility of the two alternative route choices and construct the discrete choice (multinomial logit) model, and the choice probability of the alternative routes were analyzed for both equations.
the magnitude of such biases and finally observed that biased parameter estimates lead to poor policy decisions.
BRIEF OVERVIEW OF STUDY AREA
Apart the commuter travel survey to get an overlook of the study area,the study of two lines are considered from same origin to destination. One is the direct bus route (817) and other multimodal transit route from the same origin to destination (Najafgarh to Inderlok), in both routes most of the trips patterns observed are work-based trips. Some of them are leisure trips.
Walk Bus Service Walk Figure 1.0 Direct Bus Trip
Commuter Survey:For this analysis required large and extensive commuter travel data i). Personal Information of the passenger: Gender, Age, Income, and Purpose of Trip.
ii). Travel Information of the passenger: Origin, Destination, Access mode and Access time, Egress mode and Egress time, Transfer Time and Wait time at each switch point, In-vehicle time. iii). Passenger Satisfaction Measures in terms of speed, cost, comfort, reliability and transfer.
METHODOLOGY
Performance Measures
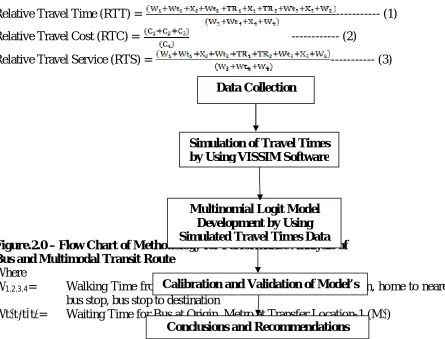
Relative Travel Time (RTT) = --- (1)
Relative Travel Cost (RTC) = --- (2)
Relative Travel Service (RTS) = --- (3)
Figure.2.0 – Flow Chart of Methodology for Performance Analysis of Bus and Multimodal Transit Route
Where
W1,2,3,4= Walking Time from Home to bus stop, Bus stop to destination, home to nearest
bus stop, bus stop to destination
Wt₁t₂t₃t₄= Waiting Time for Bus at Origin, Metro at Transfer Location-1 (M₁) Data Collection
Multinomial Logit Model Development by Using Simulated Travel Times Data
Data
Conclusions and Recommendations Calibration and Validation of Model’s
Bus at Transfer Location, -2 (B₂), Bus at Origin (Direct Bus Route)
X1,2,3,4= Travel Time From Origin to Transfer Location -1 (B₁), Transfer Location, -1 (M₁) to Transfer Location, -2 (M₂) ,Transfer Location, -2 (M₂) to Destination,Origin to Destination
C1,2,3,4 = Travel Cost of Bus from Origin to B₁, M₁ to M₂, B₂ to DestinationOrigin To Destination
VISSIM: It is used for simulating the travelling time of pedestrian’s and vehicles. VISSIM is a Microscopic simulation model. It can analyze public and private transport operations and makes it useful for evaluation of various alternatives for transportation planning. This VISSIM software is used in this study to simulate the vehicle travel times from origin to destination, pedestrian transfer times, travel times and waiting times at various bust stops and transfer points.It can be valid for all the vehicles (i.e. buses, Bikes, HCV’s, LCV’s, Autos, Cars, Rickshaws and Cycles). Traffic signs (warning signs, prohibited signs, cautionary signs, speed indicators etc.,) are to be placed at necessary locations.
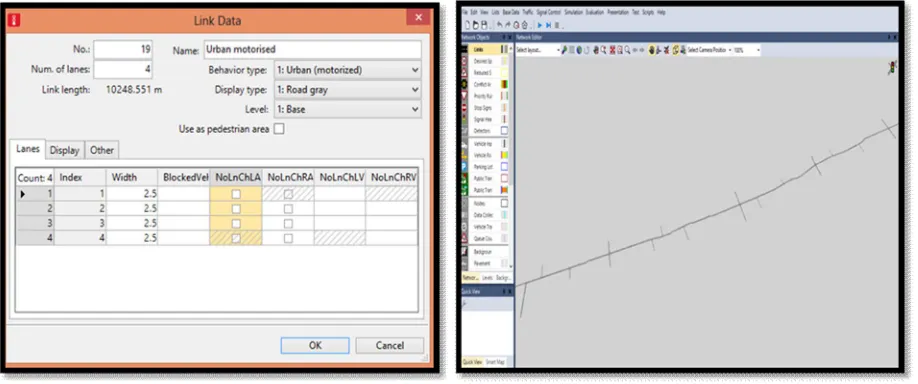
Link Generation
In the present work as a side unidirectional, along the considered road network no of lanes varies, (origin (Najafgarh) to Dwaraka Mor ‘2’ lanes Dwaraka Mor to Uttam Nagar ‘3’ lanes and Uttam Nagar to destination (inderlok) ‘4’ lane road network)) is considered for simulation. The road geometry is plain and lane link data are shown in Figure 3.0. It is required to input the link data such as number of lanes, lane width, and link behavior type& developed road network.
Figure 3.0Link Input Data in VISSIM, Developed Road Network Running of Simulation Model VISSIM
Figure 4.0 A snapshot of simulation run in VISSIM Utility Function
Ui= ai+ a₁x₁+a₂x₂+a₃x₃+a₄x₄--- (4)
j j ---(5) Where Ui and Uj is the utility alternatives, aᵢ and jis calibrated mode-specific constanst for the same model which represents advantages or disadvantages of mode. a₁to a4, coefficients are related to variables.
Multinomial Logit Model of Transit Route Choice
The basic model estimated for predicting transit choice, the discrete choice (multinomial logit) model calculate the probability of choosing mode i if disaggregate, or the proportion of travelers in aggregate case that will select a specific mode according to following relationship. General expression for the probability of choosing an alternative ‘i’ (i = 1, 2 - - - - J) from a set of J alternatives is given as
--- (6)
Where, Pr (i) is the probability of the decision-maker choosing alternative i and j
RESEARCH OUTCOMES
Commuter Satisfaction
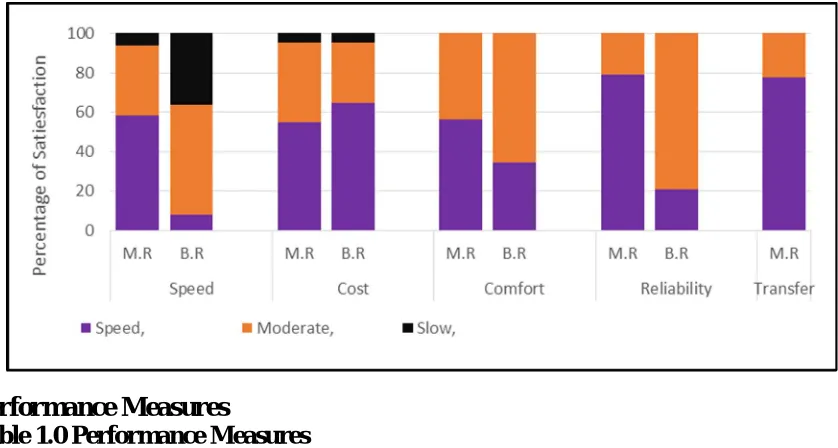
In the study between direct bus route and interchangeable (Bus-Metro-Bus) route, it is required to realize to what degree the overall quality of metro and bus services facilitate the commuters. Commuter travel survey questionnaire asked passengers for their view on their satisfaction in terms of Speed, Cost, Comfort, Time Reliability, and Ease of Transfer. From Fig.5.0, it can noticed that in multimodal transit route as higher percentage of passengers are satisfied in terms of speed, comfort and reliability than the direct bus route, but in direct bus route passengers are satisfied in terms of cost than the multimodal transit route.
x₁ = Waiting Time for mode in minutes x₂ = Travel time (in vehicle time) in minutes x₃ = Travel Cost in Rupees
Performance Measures
Table 1.0 Performance Measures
Indices Minimum Value Maximum Value Mean Value
Relative Travel time 0.622 0.0.974 0.861
Relative Travel Services 2.156 5.800 3.528
Relative Travel Cost 2 2 2
Simulation of Travel Times by Using VISSIM ModelSimulation results are obtained from the output database file created by VISSIM through each simulation run. Public (bus and metro) and private (Car and Two-wheeler) travel times and Pedestrian travel times are simulated,
Fig.6.0shows Vehicle travel times and signal changes output database file & it shows output window for pedestrian travel times. Simulated travel time results are summarized in table 1.0
Fig 6.0 Comparison of OVTT &IVTT from Field and Simulated Data Figure 5.0 Comparison of Commuter Satisfaction
Multinomial Logit Model by Using Simulated Travel Time’s Data
Table 2.0 shows the Multinomial Logit model estimation parameter results from simulated data. The N logit software is selected to calibrate the parameter which is the premier tool for estimating discrete choice models.
U.M.R
--- (7)
U.M.R = 0.014875
B.R = -0.05784*99.6-0.09969*7.033+0.17*13.067 = 0.08712 --- (8) Table 2.0Multinomial Logit model estimation results from simulated travel times
Parameters Coefficients Standard
Error Z-Value P-Value Constant -4.81694 0.034 -1.9 0.0502 OVTT -0.05784 0.067 -1.47 0.0961 IVTT -0.09969 0.114 1.49 0.0933 Travel Cost 0.17 2.559 -1.88 0.0498
Age -0.4816 0.570 0.87 0.2828
Gender 0.17273 0.394 -0.47 0.0521 Comfort 1.00499 0.518 1.94 0.0527 Reliability 3.03453 0.529 5.74 0 Probability of Alternative Route Choice
Probability of choosing route choice are found below:
PM.R = = 0.146 --- (9)
PB.R = = 0.854 --- (10) The probability of alternative multimodal transit route being chosen w.r.t direct bus route would be = 1 – 0.854 = 0.146
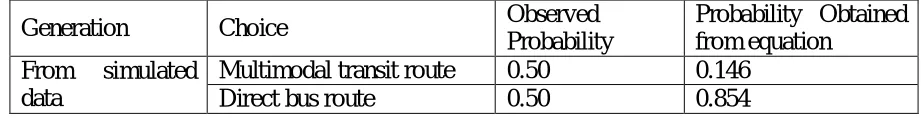
Calibration and Validation of Models
This is presented in Table 3.0 It was seen that predicted percent shares of modes is near to those of observed. The validation sample was 10 percent of the total sample.
Table 3.0 Observed and Predicted Probability of Choice
Generation Choice Observed
Probability
Probability Obtained from equation
From simulated data
Multimodal transit route 0.50 0.146
Direct bus route 0.50 0.854
CONCLUSIONS
In this paper it is concluded that how these factors affect the performance of bus route, multimodal transit route and the choice of alternative routes.
1. From this study RTT says
averagely 15% of travel time will be reduced by multimode transit, as per survey and simulated data.
2. Travel cost of multimodal transit
multimode public transport can improve the performance of multimodal transit route and it can reduce the service time to collect ticket at every transfer.
3. The interconnectivity ratio derived for the different (access–main–egress) mode combinations will be permitted and unrealistic mode chains are eliminated.
4. The travel time coefficients indicate the negative effect depicting travel time of transit increases, its probability of choosing decreases. The model results demonstrates that
Cost, in-vehicle time and out-vehicle travel time are playing a significant role in traveler’s choice behavior.
5. Attribute ‘age’ is having negative impact which means, as age of the individual increases, interest to travel in multimodal transit route reduces.
6. Attributes comfort and reliability are calculating utility for multimodal transit route, their increase in value increases the probability in choosing multimodal transit route.
7. As per simulated travel time metro takes very less IVTT ‘22’ minutes (from Dwaraka mor to Moti Nagar) compared to bus travel ‘56’ for same distance. Because bus has to face congestion and traffic signals which were almost absent in case of metro.
REFERENCES
[1]. Bharat, P.Bhatta., and Larsen, I. (2011), “Errors in variables in multinomial choice modeling: A simulation study applied to a multinomial logit model of travel mode choice”, Transport Policy 18, PP. 326–335. [2]. Sebastian, R., Juan, C., and Louis, de, G. (2011), “A topological route choice model for metro”,
Transportation Research Part A. 45, PP.138–147.
[3]. Eluru, N, Chakour, V., and El-Geneidy A. (2012). Travel Mode Choice and Transit Route Choice Behavior in Montreal: Insights from McGill University Members Commute Patterns. Public Transport: Planning and Operations, 4(2), PP. 129–149
[4]. Agarwal, P. K. and Singh, A.P. (2010), “Performance Improvement of Urban Bus System: Issues and Solution” International Journal of Engineering Science and Technology,Vol. 2(9), PP. 4759-4766.
[5]. Chen, L., Yang, F., Cheng, Y., Yao, Z. and Xu Zhang, (2014), “Urban Public Transport Choice Behavior Analysis and Service Improvement 1 Policy-making: A Case Study from the Metropolitan City, Chengdu, China”, TRB 2014 Annual Meeting, PP.1-14.
[6]. Madhav, G.B. and Murtaza, H. (2007), “An analysis of public bus transit performance in Indian cities”, Transportation Research Part A. 41, PP.961–981.
[7]. Pawan Kumar and Parida, M. (2011), “Vulnerable Road Users in Multi Modal Transport System for Delhi”, PP. 38-46.
[8]. Piet H.L and Lanser, S.H. (2005), “Modelling route choice behavior in multi-modal transport networks” Transportation, Vol. 32, PP. 341–368.